Nomogram for predicting pathological response to neoadjuvant treatment in patients with locally advanced gastric cancer: Data from a phase III clinical trial
Han Shao, Nai Li, Yi‐hong Ling, Ji‐jin Wang, Yi Fang, Ming Jing, Zhi‐wei Zhou, Yu‐jing Zhang

TL;DR
This study developed a prediction tool to assess how well gastric cancer patients respond to pre-surgery treatment, using clinical data to guide personalized care.
Contribution
A novel nomogram was developed to predict pathological response in gastric cancer patients using clinicopathological factors.
Findings
Good pathological response was associated with improved survival outcomes in gastric cancer patients.
A nomogram with five predictors achieved an AUC of 0.777 for predicting good response.
The nomogram was internally validated and showed potential for personalized treatment strategies.
Abstract
This study aimed to establish a nomogram using routinely available clinicopathological parameters to predict the pathological response in patients with locally advanced gastric cancer (LAGC) undergoing neoadjuvant treatment. We conducted this study based on the ongoing Neo‐CRAG trial, a prospective study focused on preoperative treatment in patients with LAGC. A total of 221 patients who underwent surgery following neoadjuvant chemotherapy (nCT) or neoadjuvant chemoradiotherapy (nCRT) at Sun Yat‐sen University Cancer Center between June 2013 and July 2022 were included in the analysis. We defined complete or near‐complete pathological regression and ypN0 as good response (GR), and determined the prognostic value of GR by Kaplan–Meier survival analysis. Eventually, a nomogram for predicting GR was developed based on statistically identified predictors through multivariate logistic…
Genes, proteins, chemicals, diseases, species, mutations and cell lines named across the full text — each resolved to its canonical identifier and authoritative record.
Click any figure to enlarge with its caption.
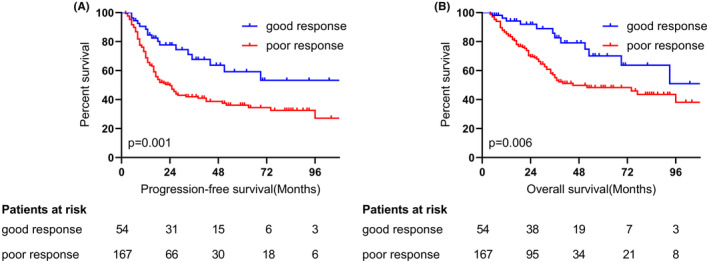 FIGURE 1
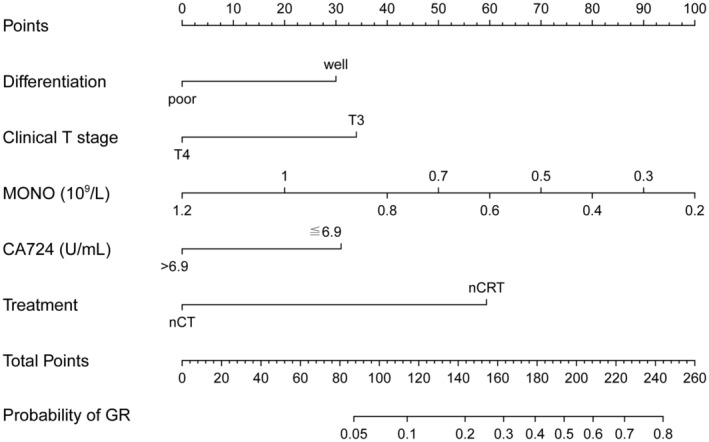 FIGURE 2
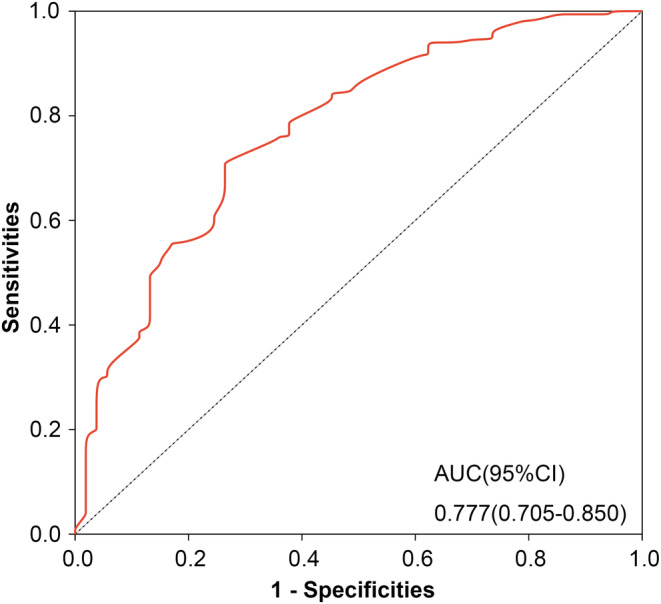 FIGURE 3
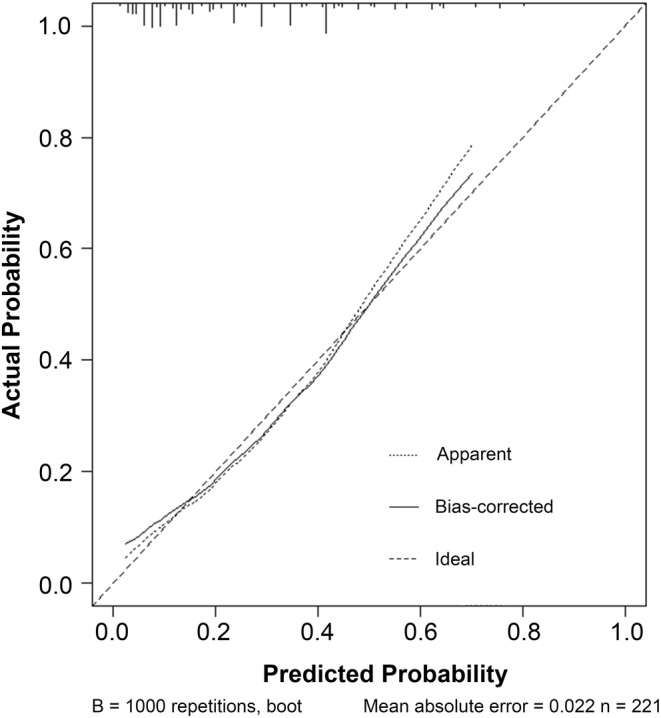 FIGURE 4
| Characteristics | Total ( | GR ( | PR ( |
|
|---|---|---|---|---|
| Sex ( | ||||
| Male | 164 (74.2) | 39 (72.2) | 125 (74.9) | 0.701 |
| Female | 57 (25.8) | 15 (27.8) | 42 (25.1) | |
| Age (years) | 60 (50–65) | 62 (53–66) | 59 (50–65) | 0.170 |
| BMI (kg/m2) | ||||
| ≦24.9 | 166 (75.1) | 42 (77.8) | 124 (74.3) | 0.602 |
| >24.9 | 55 (24.9) | 12 (22.2) | 43 (25.7) | |
| Location ( | ||||
| Esophago‐gastric junction | 43 (19.5) | 12 (22.2) | 31 (18.6) | 0.678 |
| Upper third | 73 (33) | 18 (33.3) | 55 (32.9) | |
| Middle third | 48 (21.7) | 11 (20.4) | 37 (22.2) | |
| Lower third | 51 (23.1) | 13 (24.1) | 38 (22.8) | |
| Whole | 6 (2.7) | 0 (0) | 6 (3.6) | |
| Lauren classification ( | ||||
| Intestinal type | 89 (40.3) | 25 (46.3) | 64 (38.3) | 0.299 |
| Non‐Intestinal type | 155 (59.7) | 33 (53.7) | 122 (61.7) | |
| Differentiation ( | ||||
| Well | 53 (24) | 19 (35.2) | 34 (20.4) | 0.027 |
| Poor | 168 (76) | 35 (64.8) | 133 (79.6) | |
| Signet ring cell ( | ||||
| Yes | 28 (12.7) | 4 (7.4) | 24 (14.4) | 0.181 |
| No | 193 (87.3) | 50 (92.6) | 143 (85.6) | |
| Clinical T stage ( | ||||
| T3 | 43 (19.5) | 17 (31.5) | 26 (15.6) | 0.010 |
| T4 | 178 (80.5) | 37 (68.5) | 141 (84.4) | |
| Clinical N stage ( | ||||
| N0‐2 | 151 (68.3) | 41 (75.9) | 110 (65.9) | 0.167 |
| N3 | 70 (31.7) | 13 (24.1) | 57 (34.1) | |
| Blood type ( | ||||
| Type O | 84 (38) | 24 (44.4) | 60 (35.9) | 0.629 |
| Type A | 70 (31.7) | 17 (31.5) | 53 (31.7) | |
| Type B | 48 (21.7) | 9 (16.7) | 39 (23.4) | |
| Type AB | 19 (8.6) | 4 (7.4) | 15 (9) | |
| WBC (109/L) | 6.30 (5.15–7.60) | 6.3 (5.00–6.93) | 6.30 (5.20–7.70) | 0.470 |
| NEU (109/L) | 4.00 (3.00–5.00) | 4.00 (2.97–4.63) | 3.90 (3.00–5.10) | 0.565 |
| HGB (g/L) | 125 (105–140) | 123 (108–140) | 126 (103–140) | 0.788 |
| PLT (109/L) | 292 (226–351) | 283 (222–346) | 297 (226–354) | 0.578 |
| LYM (109/L) | 1.60 (1.30–2.00) | 1.55 (1.30–2.00) | 1.70 (1.30–2.00) | 0.471 |
| LYM% | 0.26 (0.21–0.32) | 0.26 (0.21–0.32) | 0.26 (0.21–0.33) | 0.747 |
| MONO (109/L) | 0.40 (0.30–0.50) | 0.40 (0.30–0.50) | 0.40 (0.30–0.54) | 0.010 |
| ALB (g/L) | 40.70 (37.65–42.85) | 41.00 (39.20–43.85) | 40.60 (37.50–42.60) | 0.172 |
| CRP (mg/L) | 2.40 (0.90–7.25) | 2.40 (0.80–6.48) | 2.30 (0.90–7.60) | 0.955 |
| LDH (U/L) | 149.70 (132.20–172.70) | 155.20 (139.68–176.05) | 148.10 (130.10–170.50) | 0.076 |
| NLR | 2.47 (1.78–3.22) | 2.34 (1.91–3.40) | 2.50 (1.71–3.20) | 0.963 |
| LMR | 4.00 (3.07–5.00) | 4.08 (3.25–5.75) | 3.91 (3.00–5.00) | 0.099 |
| PLR | 176.67 (134.20–237.62) | 176.49 (136.25–241.23) | 176.67 (132.55–230.77) | 0.824 |
| CEA (ng/mL) | ||||
| ≦5 | 166 (75.1) | 44 (81.5) | 122 (73.1) | 0.213 |
| >5 | 55 (24.9) | 10 (18.5) | 45 (26.9) | |
| CA199 (U/mL) | ||||
| ≦35 | 178 (80.5) | 43 (79.6) | 135 (80.8) | 0.854 |
| >35 | 43 (19.5) | 11 (20.4) | 32 (19.2) | |
| CA724 (U/mL) | ||||
| ≦6.9 | 156 (70.6) | 44 (81.5) | 112 (67.1) | 0.043 |
| >6.9 | 65 (29.4) | 10 (18.5) | 55 (32.9) | |
| Therapy ( | ||||
| nCT | 111 (50.2) | 12 (22.2) | 99 (59.3) | <0.001 |
| nCRT | 110 (49.8) | 42 (77.8) | 68 (40.7) | |
| Variables |
|
| OR | 95% CI |
|---|---|---|---|---|
| Differentiation (well/poor) | 0.834 | 0.033 | 2.303 | 1.071–4.951 |
| Clinical T stage (T3/T4) | 0.933 | 0.023 | 2.543 | 1.141–5.670 |
| MONO (109/L) | −2.836 | 0.029 | 0.059 | 0.005–0.746 |
| CA724 (≦/>6.9 U/mL) | −0.857 | 0.045 | 0.424 | 0.184–0.980 |
| Therapy (nCRT/nCT) | 1.640 | 0.000 | 5.157 | 2.443–10.888 |
- —Sun Yat‐sen University Clinical Research 5010 Program
Peer Reviews
No public reviews on file for this paper yet. If you reviewed it on a platform where reviews are public (OpenReview, ICLR, NeurIPS, ICML), you can paste yours below so the community can read it here.
Videos
No videos yet. Explain this paper in a talk, walkthrough, or lecture? Add one.
Taxonomy
TopicsBlind Source Separation Techniques · Image and Signal Denoising Methods · Spectroscopy and Chemometric Analyses
INTRODUCTION
1
Gastric cancer ranks fifth among the most common malignant tumors worldwide and is the fourth leading cause of cancer‐related death.1 Traditionally, locally advanced gastric cancer (LAGC) patients were treated with radical surgical resection followed by adjuvant chemotherapy as the standard strategy. However, recent large clinical trials have increasingly recognized the benefits of neoadjuvant treatment for LAGC patients. The MAGIC study2 and the FNCLCC/FFCD3 study demonstrated that neoadjuvant chemotherapy (nCT) can lead to tumor downstaging, higher R0 resection rates, and improved survival compared to surgery alone. In the CROSS trial,4 neoadjuvant chemoradiotherapy (nCRT) significantly increased the R0 resection rate and prolonged survival. Furthermore, the RESOLVE study5 and the PRODIGY study6 confirmed that perioperative chemotherapy provided superior 3‐year disease‐free survival (DFS) for LAGC patients compared to adjuvant therapy.
However, the response to neoadjuvant treatment varies among patients, with only those showing a good response being associated with a better prognosis, while nonresponders do not gain survival benefits.7 Consequently, nonresponders may experience delays in optimal surgery timing, encounter treatment‐related adverse reactions, and incur additional medical costs. Tumor regression grade (TRG) is an effective method of assessing the outcome of neoadjuvant treatment based on pathological evaluation, with TRG0/1 indicating a more favorable prognosis.7, 8 However, despite obvious pathological regression, about 30% of patients still experience recurrence.9, 10 Recent studies have highlighted the importance of pathologic nodal status as an equally significant prognostic factor in LAGC patients undergoing neoadjuvant treatment.11, 12 The combination of TRG with ypN status may generate an evaluation method that is more comprehensive and reproducible to predict disease control.13, 14 However, there has not been much work in this area yet. For this study, we defined TRG0/1 (according to NCCN criteria) and ypN0 as good response (GR). Previous studies have primarily focused on establishing prediction models based on achieving pathological complete response (pCR) or TRG = 0, with enrolled patients receiving different chemotherapy regimens as preoperative treatment.15, 16 This prompted us to investigate whether GR has an independent influence on survival in patients who underwent preoperative treatments, including chemoradiation therapy.
Based on an ongoing prospective clinical trial, we conducted this study to identify pretreatment parameters that are capable of predicting GR to neoadjuvant treatment and establish a nomogram model. We hypothesized that a model to predict GR with a high probability (≥60%) could be developed, so the patients most likely to benefit could be identified and a more individualized, precise treatment strategy could be suggested.
MATERIALS AND METHODS
2
Study population and data collection
2.1
The current study was conducted based on the ongoing Neo‐CRAG study (NCT01815853), a multicenter, phase III randomized controlled trial of perioperative chemotherapy (nCT group) versus preoperative chemoradiotherapy (nCRT group) with postoperative chemotherapy for patients with resectable gastric cancer. All patients were newly diagnosed, untreated, potentially operable gastric cancer patients with stage III‐IVA (cT3N2–3M0, cT4aN+M0, and cT4bN any M0), a good performance status (Eastern Cooperative Oncology Group [ECOG] performance status score of 0–2), and no peritoneal implantation was confirmed by laparoscopy before nCT or nCRT. We conducted an analysis on patients treated at Sun Yat‐sen University Cancer Center between June 2013 and July 2022, who met the following criteria: (1) completion of preoperative treatment; and (2) undergoing gastrectomy. Patients who did not meet these inclusion criteria were excluded from the study. Ultimately, a total of 221 eligible patients were included in the analysis.
We collected all baseline clinicopathological information with potential predictive value, including gender, age, body mass index (BMI), biopsy pathological differentiation, presence of signet ring cell carcinoma component, tumor location, tumor staging information based on the American Joint Committee on Cancer (AJCC) 8th edition, as well as routine hematological and biochemical test results and tumor markers. For the tumor markers, we defined the upper limit of normal (ULN) as follows: CEA ≤5 ng/mL, CA199 ≤35 U/mL, and CA724 ≤6.9 U/mL. Additionally, we conducted follow‐up for each patient after gastrectomy.
Treatment
2.2
Patients in the nCT group received 3 cycles of neoadjuvant chemotherapy before surgery using the XELOX regimen: Oxaliplatin 130 mg/m^2^, intravenous drip, on day 1; and Capecitabine 1000 mg/m^2^, orally, on days 1–14; repeated every 21 days. Patients in the nCRT group also received three cycles of induction chemotherapy, with the latter two cycles combined with radiotherapy. Patients in the nCRT group also received three cycles of induction chemotherapy, with the latter two cycles combined with radiotherapy. Radical gastrectomy was performed 3–4 weeks and 6–8 weeks after the end of nCT and nCRT, respectively. Subsequently, patients continued to receive 3 cycles of adjuvant chemotherapy (XELOX regimen) 3–4 weeks after surgery.
Response assessment
2.3
In accordance with the same standards, all resection specimens were sent to the Department of Pathology for examination by the attending pathologist. The TRG criteria were selected according to the recent NCCN guideline (version 2, 2022).17 These criteria were adopted to reflect the recommendations of the College of American Pathologists (CAP), which designate a four‐category system for scoring treatment effect: grade 0 (complete response: no viable cancer cells), grade 1 (near‐complete response: single cells or rare small groups of cancer cells), grade 2 (partial response: residual cancer cells with evident tumor regression but more than single cells or rare small groups of cancer cells), and grade 3 (poor or no response: extensive residual cancer with no evident tumor regression).
We classified patients into two groups based on their TRG score and ypN status as follows: (1) GR group, consisting of patients with ypN0 status and complete or near‐complete tumor regression (Grades 0 or 1); (2) Poor response (PR) group, comprising patients with ypN0 status and partial or absence of tumor regression (Grade 2 or 3), as well as patients with ypN+ status.
Data analysis
2.4
The normality of the data was evaluated using the Kolmogorov–Smirnov test and normal probability plots. Non‐normally distributed parameters were presented as median (upper quartile to lower quartile) and analyzed using the non‐parametric Mann–Whitney rank test. Parameters that followed a normal distribution were expressed as mean ± standard deviation and analyzed using the t‐test. The Chi‐square test was used to analyze categorical variables. To compare progression‐free survival (PFS) and overall survival (OS) between the two groups, we utilized the Kaplan–Meier (K–M) method with log‐rank tests.
We conducted logistic regression analysis to identify predictive factors for GR, using odds ratio (OR) with 95% confidence interval (CI) to measure the associations. Preoperative parameters with a p‐value ≤0.05 in the univariate analysis were included in a multivariate logistic regression model. The final model was obtained using the Wald stepwise selection method, with an entry and removal probability set at p = 0.05. Subsequently, we constructed a nomogram based on the OR of the independent predictors. For validation, internal validation was performed using the bootstrap method. The calibration curve of the nomogram was plotted to illustrate the relationship between predicted and observed outcomes. The discriminative ability of the nomogram was assessed using a receiver operating characteristic (ROC) curve, and the area under the curve (AUC) was calculated to quantify its performance. Statistical significance was considered at p < 0.05. Data analyses were conducted using SPSS software version 26.0 (IBM, Armonk, NY, United States), GraphPad Prism 8.0 (GraphPad Software, San Diego, CA, USA), and R version 4.1.3 software (The R Foundation for Statistical Computing, Vienna, Austria).
RESULTS
3
Characteristics of the study population
3.1
The clinical characteristics of the study population were summarized in Table 1. The study cohort consisted of 164 males and 57 females. The median age at diagnosis was 60 years (range: 26–75). Over 80% of tumors were clinical T4 (178/221), and 97.7% of patients (216/221) had radiologically suspicious lymph node metastases. In total, 76% of the tumors were poorly differentiated adenocarcinomas (168/221), and 12.7% contained signet ring cell carcinoma (28/221). The median monocyte (MONO) count was 0.4 × 10^9^/L (range: 0.3 × 10^9^/L–0.5 × 10^9^/L). Abnormal elevation of pretreatment CA724 was observed in 29.4% of patients (65/221). During the study period, 110 patients (49.8%) underwent nCRT, and 111 patients (50.2%) underwent nCT.
Pathological analysis
3.2
Pathological examination of the surgical specimens revealed a pCR in 27 patients: 5 patients (4.5%) from the nCT group and 22 patients (20%) from the nCRT group (p < 0.001). Out of 221 patients, 75 (33.9%) achieved complete or near‐complete tumor regression (TRG0/1). Patients receiving nCRT had a significantly higher likelihood of achieving TRG0/1 compared to those receiving nCT (50% vs. 18%; p < 0.001). Nodal downstaging was achieved in 62.4% of the patients, with 75.5% in the nCRT group and 49.5% in the nCT group (p < 0.001). Additionally, ypN0 was observed in 93 patients (42.1%). Furthermore, 54 patients achieved a good response (GR, TRG0/1 plus ypN0): 42 (38.2%) in the nCRT group and 12 (10.8%) in the nCT group (p < 0.001). The PR group consisted of 167 patients: 21 patients achieved TRG0/1 plus ypN+, 39 achieved TRG2/3 plus ypN0, and 107 achieved TRG2/3 plus ypN+.
Survival outcomes
3.3
To validate the prognostic value of TRG combined with ypN0, we conducted a survival analysis of different patient groups. The study population had a median follow‐up time of 42 months (range: 4–115 months). In the overall cohort, the median PFS was 32 months (95% CI, 19.8–44.2 months), and the median OS was 74 months (95% CI, 40.04–107.96 months). The K–M survival curve revealed that patients in the GR group demonstrated improved median PFS (GR vs. PR; not reached vs. 24 months; p = 0.001) and median OS (GR vs. PR; not reached vs. 45 months; p = 0.006) compared to patients with a poor response (Figure 1). The estimated 3‐year survival rates of patients with GR and PR were 82.6% and 55.2%, respectively. Consequently, we focused our attention on GR and established a prediction model.
Survival according to pathological responses. Progression‐free survival (A) and overall survival (B) of patients between good response and poor response group.
Derivation of the prediction model
3.4
Table 1 presents the univariate associations between clinical parameters and pathological response. Among the variables analyzed, five (tumor differentiation, clinical T stage, MONO count, CA724 level, and neoadjuvant modalities) showed significant differences (p < 0.05). Subsequently, using multivariate logistic regression analysis, we identified that GR was independently predicted by well tumor differentiation, a lower MONO count, clinical T3 (cT3), CA724 ≤6.9 U/mL, and the use of nCRT (Table 2). Based on these findings, we constructed a nomogram (Figure 2) that incorporates the five variables to enhance the probability of predicting GR up to 80% when a patient scores >240 points. The corresponding ROC curve (Figure 3) demonstrated an AUC of 0.777 (95% CI 0.705–0.850). After bias correction, the AUC remained high at 0.752, indicating excellent predictive discrimination. Additionally, internal validation was performed, and calibration curves were plotted to compare predicted and actual observations. As shown in Figure 4, the nomogram exhibited favorable statistical performance in predicting GR probabilities.
Nomogram for predicting GR to neoadjuvant treatment (GR, good response; nCT, neoadjuvant chemotherapy; nCRT, neoadjuvant chemoradiotherapy).
Receiver operating characteristic curve for the nomogram model (AUC, area under the curve; 95% CI, 95% confidence interval).
Calibration curve for the nomogram model.
DISCUSSION
4
As treatment models for gastric cancer continue to evolve, neoadjuvant treatment has become increasingly important in comprehensive patient care. However, the challenge of tumor progression during the neoadjuvant treatment period remains. Identifying patients who are sensitive to neoadjuvant treatment is a crucial step in the decision‐making process for optimal treatment strategies.
Recently, various histologic, radiographic, and clinical measures of response to preoperative therapy have been analyzed in gastric cancer. Previous studies have reported associations between response to nCT and factors such as tumor location, differentiation, tumor‐infiltrating lymphocytes (TILs), and death‐associated protein‐3 (DAP‐3).18, 19 Additionally, radiomic information derived from computed tomography (CT) images has shown potential in identifying responsive patients to nCT.20 However, these findings were of limited clinical relevance due to the relatively complicated additional examination required or the small sample sizes involved. Chen et al.15 identified a correlation between higher lymphocyte ratios and carcinoembryonic antigen (CEA) levels, lower monocyte counts, and tumor differentiation grade with a higher pCR. Similarly, Xu et al.16 developed a prediction model for TRG = 0 using four predictors: CA199, CA724, tumor differentiation, and the short axis of the largest regional lymph node (LNmax). Although the indicators mentioned above were easily available, these studies were retrospective analyses of LAGC patients who received nCT with different chemotherapy regimens. In contrast, our study utilized data from a prospective phase III clinical trial, reducing potential biases in the study conclusions. Moreover, we defined and validated a novel and effective prognostic indicator for neoadjuvant treatment in LAGC. Ultimately, a nomogram based on five clinically routinely available predictors emerged, demonstrating a favorable discriminatory capability.
Both TRG and ypN status are equally important in predicting the prognosis of patients with LAGC. TRG, widely used in clinical practice, is determined by the percentage of remaining viable tumor cells, with a complete or near‐complete response indicating a better prognosis. However, conflicting results from some studies have shown that the status of lymph nodes after neoadjuvant treatment is the only independent prognostic factor for OS in gastric cancer patients.11, 21 It is important to consider that in some LAGC patients receiving neoadjuvant treatment, lymph nodes may remain positive despite good tumor regression at the primary site. This suggests possible variations in tumor biology between the stomach and metastatic lymph nodes, highlighting the limitation of evaluating treatment response based on a single factor. Martin‐Romano et al.14 demonstrated a significant survival benefit in patients with Becker grade 1a–b response combined with ypN0, compared to other groups. In our study, we defined “GR” as TRG0/1 and ypN0, and the survival analysis revealed that the GR group showed significantly improved OS and PFS compared to the PR group. Therefore, integrating the extent of tumor regression with ypN status may provide a more precise evaluation of patient response to neoadjuvant treatment and help identify individuals who could potentially benefit from it.
We identified five independent indicators that can predict GR in LAGC patients and developed a nomogram for prediction (with a concordance statistic of 0.752 after correction for optimism). The nomogram revealed that LAGC patients with well tumor differentiation, cT3, a low MONO count, and CA724 ≤6.9 U/mL before treatment were more likely to achieve GR. Prior research has suggested that well tumor differentiation is associated with a higher rate of pathological response to neoadjuvant treatment in gastric cancer.15, 22, 23 However, clinical T stage has consistently shown limited predictive value for histologic response in LAGC.24, 25, 26 In our study, we found that LAGC patients with cT3 were more likely to achieve GR compared to those with cT4. Importantly, most previous studies included a relatively low proportion of patients with cT4, whereas in our study, the proportion of cT4 patients exceeded 80%. Therefore, further research is needed to gain a deeper understanding of the relationship between the clinical T stage and the pathological response to neoadjuvant treatment in gastric cancer.
Monocytes are known to play a crucial role in tumor proliferation, angiogenesis, and progression, while also suppressing acquired immune responses and facilitating tumor invasion and migration. Consequently, patients with elevated monocyte counts often exhibit a poor prognosis.15, 27 In our study, we observed a correlation between elevated pretreatment monocyte levels and PR, which aligns with these previous findings.
Prior research has established serum CA724 levels as a valuable diagnostic and prognostic marker for gastric cancer, as well as an indicator for assessing surgical effect and predicting metastasis and recurrence.28 In the context of preoperative treatment, Sun et al.29 reported that a reduction in CA724 (>70%) can be indicative of a favorable pathological response to nCT. Additionally, Xu et al. demonstrated an association between CA724 ≤3.19 U/mL and pathological response (TRG = 0). In our study, we observed that CA724 ≤6.9 U/mL was linked to GR in gastric cancer patients after neoadjuvant treatment. In other words, lower CA724 levels are associated with an enhanced response to neoadjuvant treatment.
Locoregional recurrence is a critical determinant of prognosis in LAGC, and radiotherapy proves effective in controlling local lesions by precisely targeting and eliminating small clusters of cancer cells in the surrounding tissues. Radiotherapy also aids in eradicating cancer cells within the lymph nodes, increasing the chances of achieving a pCR. Consequently, the use of nCRT generally results in higher rates of complete primary tumor response and improved responsiveness of lymph nodes compared to chemotherapy alone.14, 25, 30 Consistent with previous data, our study demonstrated that patients in the nCRT group were more likely to achieve a GR.
However, we acknowledge certain limitations in our study, including the relatively small number of patients and the absence of external validation. Additionally, the inherent heterogeneity of gastric cancer may pose challenges in applying the predictive model. Various factors influence treatment response and outcomes, which warrant further exploration. In future research, incorporating more effective predictive indicators, such as molecular markers, will contribute to refining the predictive model and enhancing its accuracy. Despite these limitations, the use of convenient indicators has improved the practicality of our model. Moreover, it still offers a valuable reference for the development of future research models.
CONCLUSION
5
The present study developed a nomogram using five simple, readily available, and cost‐effective clinicopathological parameters to accurately predict GR in LAGC patients. These parameters include well tumor differentiation, low MONO count, cT3, CA724 ≤6.9 U/mL, and the acceptance of nCRT. The nomogram exhibited satisfactory discriminatory capability, as evidenced by a fairly high AUC in our cohort. This could potentially assist in devising personalized treatment strategies for LAGC patients. However, the applicability of the model still needs replication and external validation in multicenter, large‐scale studies.
AUTHOR CONTRIBUTIONS
Han Shao: Conceptualization (equal); data curation (equal); formal analysis (equal); visualization (lead); writing – original draft (lead). Nai Li: Resources (equal); data curation (equal); software (equal). Yi‐Hong Ling: Data curation (equal). Ji‐jin Wang: Data curation (equal); formal analysis (equal). Yi Fang: Resources (equal); software (equal). Ming Jing: Resources (equal); software (equal). Zhi‐wei Zhou: Conceptualization (equal); writing – review and editing (equal). Yu‐jing Zhang: Conceptualization (equal); writing – review and editing (equal).
FUNDING INFORMATION
This work was funded by grant 2012013 from the Sun Yat‐sen University Clinical Research 5010 Program.
CONFLICT OF INTEREST STATEMENT
The authors declare no conflict of interest.
ETHICS STATEMENT
The study was conducted in accordance with the Declaration of Helsinki, and approved by the by the Medical Ethics Committee of Affiliated Hospital of Sun Yat‐sen University Cancer Center (5010‐2012‐05‐03).
INFORMED CONSENT STATEMENT
Informed consent to be included in the study was obtained from all patients.
The reference list from the paper itself. Each links out to its DOI / PubMed record.
- 1Sung H , Ferlay J , Siegel RL , et al. Global cancer statistics 2020: GLOBOCAN estimates of incidence and mortality worldwide for 36 cancers in 185 countries. CA Cancer J Clin. 2021;71:209‐249.33538338 10.3322/caac.21660 · doi ↗ · pubmed ↗
- 2Cunningham D , Allum WH , Stenning SP , et al. Perioperative chemotherapy versus surgery alone for resectable gastroesophageal cancer. N Engl J Med. 2006;355:11‐20.16822992 10.1056/NEJ Moa 055531 · doi ↗ · pubmed ↗
- 3Ychou M , Boige V , Pignon JP , et al. Perioperative chemotherapy compared with surgery alone for resectable gastroesophageal adenocarcinoma: an FNCLCC and FFCD multicenter phase III trial. J Clin Oncol. 2011;29:1715‐1721.21444866 10.1200/JCO.2010.33.0597 · doi ↗ · pubmed ↗
- 4van Hagen P , Hulshof MC , van Lanschot JJ , et al. Preoperative chemoradiotherapy for esophageal or junctional cancer. N Engl J Med. 2012;366:2074‐2084.22646630 10.1056/NEJ Moa 1112088 · doi ↗ · pubmed ↗
- 5Zhang X , Liang H , Li Z , et al. Perioperative or postoperative adjuvant oxaliplatin with S‐1 versus adjuvant oxaliplatin with capecitabine in patients with locally advanced gastric or gastro‐oesophageal junction adenocarcinoma undergoing D 2 gastrectomy (RESOLVE): an open‐label, superiority and non‐inferiority, phase 3 randomised controlled trial. Lancet Oncol. 2021;22:1081‐1092.34252374 10.1016/S 1470-2045(21)00297-7 · doi ↗ · pubmed ↗
- 6Kang YK , Yook JH , Park YK , et al. PRODIGY: a phase III study of neoadjuvant docetaxel, oxaliplatin, and S‐1 plus surgery and adjuvant S‐1 versus surgery and adjuvant S‐1 for resectable advanced gastric cancer. J Clin Oncol. 2021;39:2903‐2913.34133211 10.1200/JCO.20.02914 PMC 8425847 · doi ↗ · pubmed ↗
- 7Tomasello G , Petrelli F , Ghidini M , et al. Tumor regression grade and survival after neoadjuvant treatment in gastro‐esophageal cancer: a meta‐analysis of 17 published studies. Eur J Surg Oncol. 2017;43:1607‐1616.28347525 10.1016/j.ejso.2017.03.001 · doi ↗ · pubmed ↗
- 8Lombardi PM , Mazzola M , Achilli P , et al. Prognostic value of pathological tumor regression grade in locally advanced gastric cancer: new perspectives from a single‐center experience. J Surg Oncol. 2021;123:923‐931.33497471 10.1002/jso.26391 · doi ↗ · pubmed ↗