A preliminary study on analysis of lower limb energy during walking in the patients with knee replacement
Haifei Zhou, Yuying Zhang, Archit Agarwal, Graham Arnold, Weijie Wang

TL;DR
This study examines how mechanical energy changes in the lower limbs during walking for patients who have undergone knee replacement surgeries.
Contribution
The study introduces a new method to analyze limb energy during gait, specifically for knee replacement patients.
Findings
The upper leg showed the highest energy recovery coefficient (around 40%) during walking.
The control group had significantly higher energy recovery at the pelvis center compared to TKA and UKA groups.
TKA and UKA patients exhibited higher potential energy activity compared to the control group.
Abstract
Knee replacement surgeries are used to reduce pain and enhance functionality for individuals with knee arthritis. It is predicted that the annual volume of total knee replacement surgeries conducted in the US will surge by a substantial 673% by 2030. Though a lot of studies have done gait analysis on patients with knee replacement, little research is on energy changes in the lower limbs during gait. This study aimed to investigate the mechanical energy changes in the lower limbs for patients with total knee arthroplasty (TKA) and unicondylar knee arthroplasty (UKA), and ultimately to provide a specific tool to analyze limb energy during gait in clinical practice. 10 TKA and 8 UKA patients were recruited for gait analysis. The control group consisted of 11 individuals without knee replacement surgery. Vicon motion capture system and Plug-in-Gait model were used to collect gait data to…
Genes, proteins, chemicals, diseases, species, mutations and cell lines named across the full text — each resolved to its canonical identifier and authoritative record.
Click any figure to enlarge with its caption.
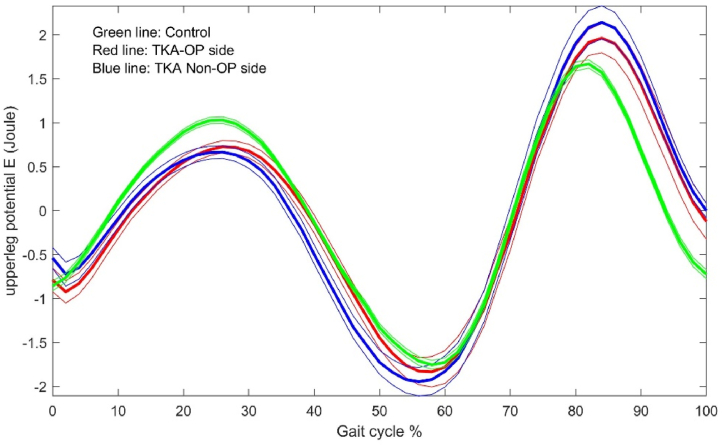 Figure 1
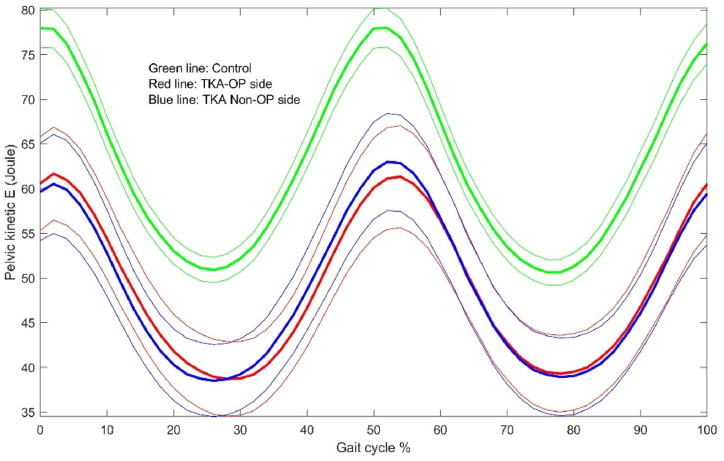 Figure 2
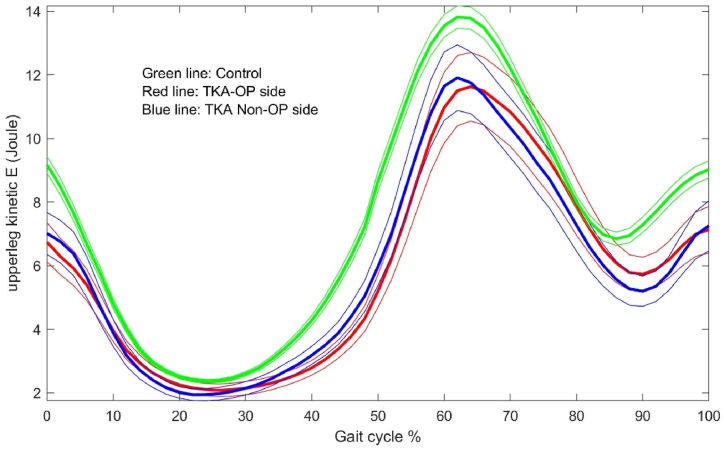 Figure 3
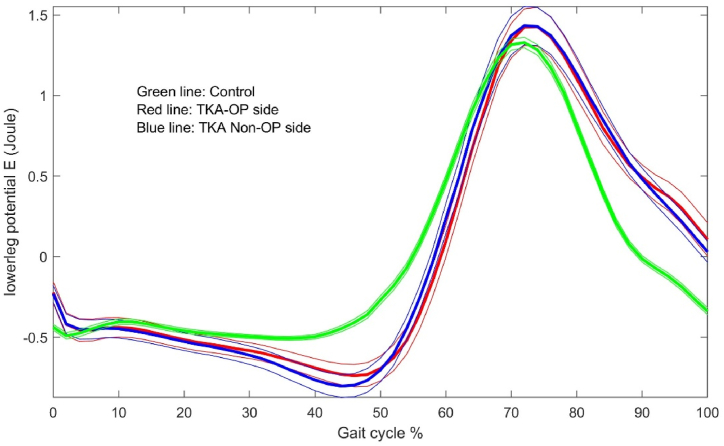 Figure 4
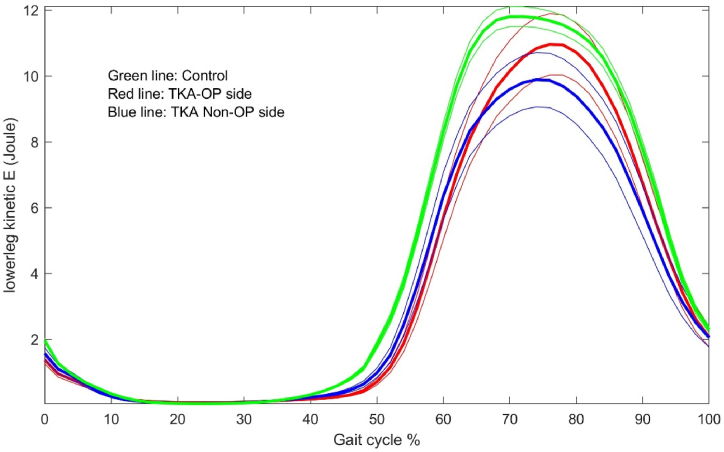 Figure 5
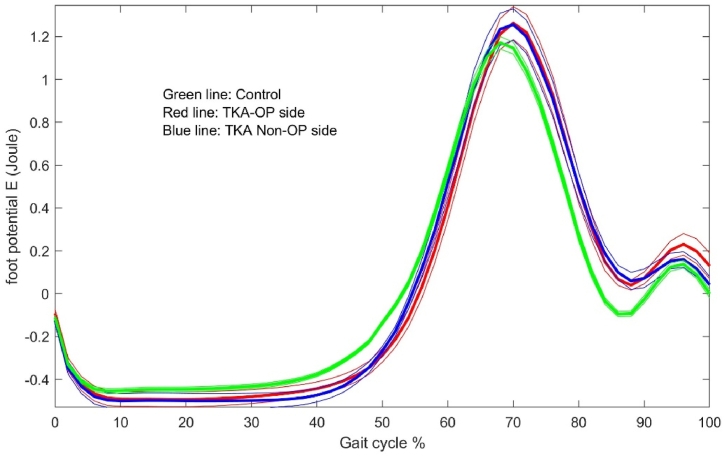 Figure 6
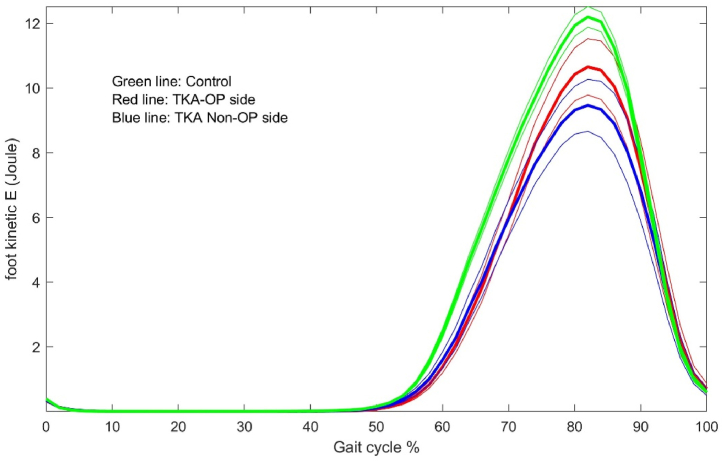 Figure 7
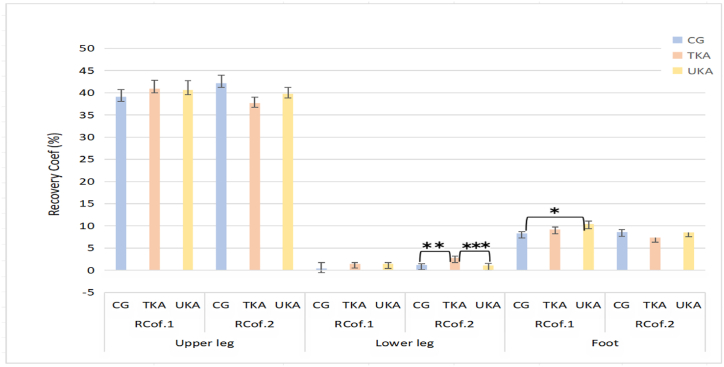 Figure 8
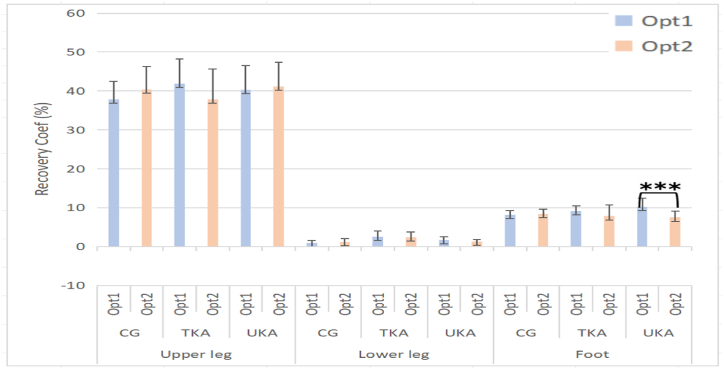 Figure 9
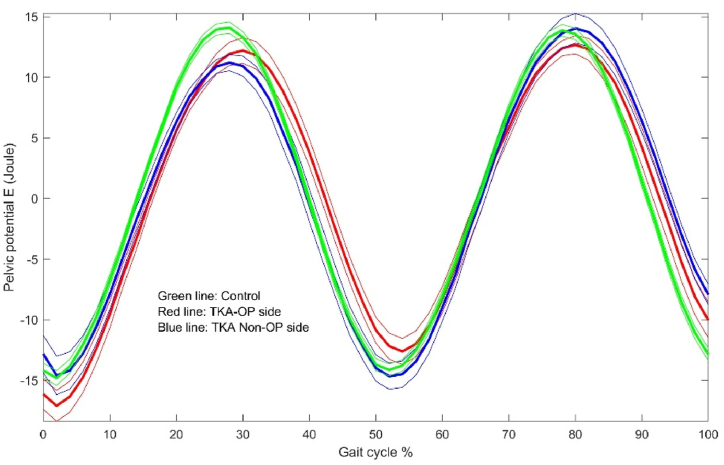 Figure 10
Peer Reviews
No public reviews on file for this paper yet. If you reviewed it on a platform where reviews are public (OpenReview, ICLR, NeurIPS, ICML), you can paste yours below so the community can read it here.
Videos
No videos yet. Explain this paper in a talk, walkthrough, or lecture? Add one.
Taxonomy
TopicsTotal Knee Arthroplasty Outcomes · Lower Extremity Biomechanics and Pathologies · Osteoarthritis Treatment and Mechanisms
Introduction
1
Arthritis is a group of musculoskeletal disorders and also one of the main causes of disability in the elderly population [1]. Osteoarthritis (OA) is the most common type of arthritis, and is characterized by joint degeneration, particularly in the knee, and involvement of multiple joints. OA affected 344 million people worldwide in 2019 [2]. The main symptoms of OA are increased pain and decreased function. Total knee arthroplasty (TKA) is a popular procedure, and OA is the main surgical indication for TKA [3]. TKA is a high-efficiency method to improve patient's quality of life and the level of limb function for people who got OA. The unicondylar knee arthroplasty (UKA) is an increasingly popular alternative to TKA for the treatment of OA. UKA offers OA patients proprioception, superior functional outcomes [4], and less intraoperative blood loss compared to TKA [5].
As the number of TKA and UKA procedures has increased, many studies have demonstrated the efficacy of TKA and UKA in patients with OA, but there are still many post-operative recovery problems gradually exposed. Andrew and Jennifer indicated the postoperative walking speed of patients decreased about 18% when comparing with healthy adults [6]. A study reported that postoperatively, gait assessments reveal significant improvements in stance time, stride length, and other aspects for TKA and UKA patients [7]. The total range of knee motion during walking is lower in TKA patients than in healthy people, while TKA patients have reduced balance and are prone to falls [[8], [9], [10], [11]]. Knee arthroplasty patients were able to produce the same knee extension moments during walking as healthy control limbs [12], but the TKA group reported reduced functional mobility, increased temporal variability of stride length, and impaired balance [13]. Several studies have noted that patients after TKA and UKA have greater difficulty with kneeling, squatting, lateral movements, turning, cutting, weight bearing, lower limb strengthening, tennis, dancing, gardening and sexual activity compared to healthy adults [14]. These studies compared post-joint replacement patients with healthy adults from various aspects to gain a comprehensive understanding of the recovery of post-joint replacement patients. However, most of these studies predominantly focus on spatiotemporal parameters, gait kinetics, or knee joint functionality [[6], [7], [8], [9], [10],12,13]. Nonetheless, there is relatively limited research concerning the mechanical aspects of the gait process. The study of mechanical energy in the lower limbs allowed for a better understanding of the recovery of the lower limbs during walking in patients after TKA or UKA. This would help clinicians and therapists to design rehabilitation programme so that patients after TKA or UKA can improve to normal levels more quickly and fully.
In this study, the research hypotheses were that there was a difference in lower limb energy use between operated and non-operated side 6 months after TKA or UKA, and the lower limb energy performance in operated side was decreased. The purpose of this study was to prospectively evaluate the walking energy performance of patients who had undergone TKA or UKA compared to control group without surgery. The study would also compare the energy performances between the operated and non-operated sides. Clinically, this study would contribute new knowledge on how patients use energies during walking, which would help clinicians and patients to arrange relevant exercises during rehabilitation. In methodology, this project made a useful computer program which could be used in clinical gait analysis for limb energy.
Methods
2
Patient involvement
2.1
A total of 8 post-UKA patients, 10 post-TKA patients, and 11 individuals who had not undergone knee joint surgery were collected from the existing database in our lab. Due to Covid situations, the number of participants could not be increased. When data collection, the inclusion was: 1) those undergone a UKA or TKA for knee osteoarthritis in the local region; 2) those had not undergone knee joint surgery as control; 3) those have an asymptomatic/clinically normal contralateral knee and be able to walk without a walking aid. Exclusion was: 1) those suffered from any poly-arthropathy; 2) suffered from any neuromuscular disease or cardiovascular disorders. All participants signed a written consent form when data collection. The ethical approval was shown in the cover letter for reviewing stage. As the gait data for this study was collected from the existing database, a Caldicott approval was waived from the School of Medicine Research Ethics Committee.
Laboratory and Instrumentation
2.2
The original gait data for the knee replacement was collected at our lab. The lab is 18 m long and 9 m wide enough for any motion measurement, equipped with eighteen highly specialized Vicon optoelectronic cameras (Oxford, UK).
Data collection
2.3
Twenty reflex markers were placed on both lower limbs and the pelvis for each participant as shown in Table 1. A static trial called T-pose was collected so that Vicon Plug-in-Gait model calculated skeletal dimensions. The participants were asked to walk in their natural way as everyday life. Most participants were asked to repeat the walking multiple times to make sure the entire cycle with good marker quality. Finally, 3 good trials for each participant were used in the analysis. All trails were labelled using Vicon Nexus Plug-in-Gait model to obtain the 3D coordinates for the markers and joint centres. The markers and joint centres were used to calculate CoM for each segment, and further used to estimate the moment of inertia for each segment. The gait cycles were manually defined as three events, foot strike, foot off and foot strike again. Only the defined cycles were analysed.Table 1. Anatomical sites of markers.Table 1. Name of markersAnatomical sitesLASIPlaced directly over the left anterior superior iliac spineRASIPlaced directly over the right anterior superior iliac spineLPSIPlaced directly over the left posterior superior iliac spineRPSIPlaced directly over the right posterior superior iliac spineSACRPlaced on the skin mid-way between the posterior superior iliac spines (PSIS). An alternative to LPSI and RPSITHIPlace the marker over the lower lateral 1/3 surface of the thigh, just below the swing of the handLANKPlaced on the lateral malleolus along an imaginary line that passes through the transmalleolar axisLTIBLike the thigh markers, these are placed over the lower 1/3 of the shank to determine the alignment of the ankle flexion axisLTOEPlaced over the second metatarsal head, on the mid-foot side of the equinus break between forefoot and mid-footLHEEPlaced on the calcaneus at the same height above the plantar surface of the foot as the toe marker
Energy calculation
2.4
In motion analysis, mechanical energy is often divided into potential energy (PE) and kinetic energy (KE). The formulas for energy calculation are shown in the following equations (1), (2), (3):
Firstly, PE is potential energy, the product of the mass and the height of the centre of mass (CoM), where m is the mass of an object, g is the gravitational constant, approximately 9.81 m/s^2^, and h is the height of the CoM in a segment relative to a ground level. From the marker coordinates, the mass and CoM were calculated for each segment or the entire lower limb, based on the relative length of the segments and the relative mass of the whole body [[15], [16], [17], [18]].
KE is kinetic energy, the product of the mass and the square of the velocity of CoM.
Where RKE is the rotational kinetic energy, Ic is the moment of inertia of the segment about its CoM, with units of kgm^2^, and ω the angular velocity of the segment (rad/s).
Recovery Coefficient is the ration of the changes of kinetic energy and potential energy to the change of total energy as shown in equation (4) [19], where ΔPE is the maximum change in the potential energy; ΔKE the maximum change in the kinetic energy; and Δ(PE + KE) the maximum change in the sum of the two energies. This coefficient shows the amount of how much the potential and kinetic energies are exchanged between each other. The coefficient value is within 0–100%, and the higher, the better.
The calculation of energy was for the upper leg, lower leg, and foot. Whole lower limb including three segments was also considered as a single multi-segment system for energy analysis. Further, the centre of pelvis constructed by using the centre of four markers, LASI, RASI, LPSI and RPSI (Table 1) was considered as the approximate to the CoM of whole body, and thus the centre of pelvis was calculated for energy change as whole body.
Statistical analysis
2.5
Mean and standard deviation were calculated for all demographic characteristics (Mass, BMI, Height, Segment Length). This study utilized SPSS® version 28 (SPSS® Inc., Chicago, IL, USA) for statistical data analysis. The TKA and UKA groups were divided into operated side and non-operated side based on whether the knee joint was operated. The control group was categorized with the left leg as the assumed operated side and the right leg as the non-operated side. Subsequently, splitting the data according to the operated and non-operated sides was a necessary step to obtain clear results for each side during the gait analysis. The data was analysed using the Repeated Measures or Multivariate options, which is derived from the General Linear Model in SPSS. This approach allowed users not only to input of repeated measurements for paired variable and independent variables for comparison, but also input multi fixed or interactive factors in statistical analysis. In statistical analysis, the operative-sides and non-operative-sides were compared as within-subject way, and the patient and control groups were compared as between-subject way. Additionally, other factors such as Sex was included as fixed factors, while BMI and Age were incorporated as covariate factors. The parameters being compared were set as dependent variables. This facilitated the examination of differences between the operated and non-operated sides in the three groups, displaying means according to the selected factors. A significance level of p < 0.05 was adopted as the threshold for statistical significance.
As this study is completely new and there were no reference studies, there was no power analysis done. The sample size used included all samples available in the database.
Results
3
Demography parameters
3.1
The demographic detail is shown in Table 2. In the TKA group, there were a total of 10 volunteers, including 4 females and 6 males. The participants had an average height of 1.68 (±0.10) m and a weight of 70.91(±8.0) kg. There were 8 volunteers, with 3 females and 5 males in UKA. The average height of the participants was 1.65(±0.09) m, and their weight was 74.14 (±8.92) kg. The Control group consisted of 11 volunteers, including 3 females and 8 males. The participants had an average height of 1.71 (±0.97) m and a weight of 75.66 (±8.07) kg. Demographic information and clinical condition for the participants were shown in Table 2. Overall, the heights are not significantly different among groups.Table 2. Demography information for the participants.Table 2. Dependent VariableCG (n = 11)TKA (n = 10)UKA (n = 8)Sig.Continuous variablesMean ± SDANOVABMI25.79 ± 1.3532.30 ± 3.8427.21 ± 3.17p < 0.001Body mass (Kg)75.66 ± 8.0770.91 ± 8.0074.14 ± 8.92p < 0.001Height (m)1.71 ± 0.971.68 ± 0.101.65 ± 0.090.06Age (years)55.00 ± 2.8768.80 ± 6.0569.89 ± 7.35p < 0.001Categorical variable%Chi-SquareMale72.72%60.00%62.50%0.811Note: CG: Control group.
Gait parameters
3.2
The gait parameters are reported in Table 3. Based on the data from the three groups of participants, it was found that the cadence in the Control group was significantly higher than that in the TKA and UKA groups. Additionally, in the comparison of the operated sides among the three groups, the Control group exhibited a significantly faster walking speed compared to the TKA. No significant difference was observed in other comparisons.Table 3. Comparison of gait parameters among the TKA, UKA and Control groups.Table 3. Dependent VariableGroupMean ± SE95% Confidence IntervalNotesLower BoundUpper BoundCadence 1 (step/min)CG118.44 ± 3.34111.76125.11CG vs TKATKA99.67 ± 3.7292.23107.11CG vs UKAUKA100.51 ± 3.2893.95107.06TKA vs UKACadence 2 (step/min)CG117.61 ± 3.09111.45123.77CG vs TKATKA99.80 ± 3.4492.93106.68CG vs UKA**UKA101.09 ± 3.0395.04107.15TKA vs UKAWalking speed 1 (m/s)CG1.20 ± 0.051.101.30CG vs TKATKA1.05 ± 0.060.941.16CG vs UKAUKA1.10 ± 0.051.001.20TKA vs UKAWalking speed 2 (m/s)CG1.26 ± 0.061.141.38CG vs TKATKA0.94 ± 0.070.811.08CG vs UKAUKA1.09 ± 0.060.971.20TKA vs UKAStride length 1 (m)CG1.21 ± 0.031.151.28CG vs TKATKA1.26 ± 0.041.191.33CG vs UKAUKA1.30 ± 0.031.231.36TKA vs UKAStride length 2 (m)CG1.32 ± 0.061.211.43CG vs TKATKA1.10 ± 0.060.981.22CG vs UKAUKA1.27 ± 0.051.161.38TKA vs UKAStep length 1 (m)CG0.61 ± 0.020.580.65CG vs TKATKA0.61 ± 0.020.570.65CG vs UKAUKA0.65 ± 0.020.620.69TKA vs UKAStep length 2 (m)CG0.66 ± 0.030.600.71CG vs TKATKA0.56 ± 0.030.500.63CG vs UKAUKA0.64 ± 0.030.580.70TKA vs UKANotes: a Covariates appearing in the model are evaluated at the following values: Age = 62.66, BMI = 27.98.b Adjustment for multiple comparisons: Bonferroni.c Dependent Variable 1: Leg without surgical operation; Dependent Variable 2: Leg with surgical operation. KE is translational kinetic energy; PE is potential energy; CG is control group. *:p<0.05; **: p <0.01; ***: p <0.001.
Kinetic energy parameters
3.3
Control group versus TKA group
3.3.1
The following results were observed when comparing the different segments of the lower limbs individually: in the comparison of the operated side of the lower leg, the Control group's Min KE is significantly lower than that in the TKA. In the comparison of the operated side of the foot segment, both the Max KE and the range of KE of the Control group are significantly lower than those of the TKA as in Table 4 and Table 5.Table 4. Comparison of Kinetic and Potential energy (Joule) parameters and recovery coefficients of the whole lower limb among the TKA, UKA, and Control groups.Table 4. SegmentDependent VariableGroupMean ± SE95% Confidence IntervalNotesLower BoundUpper BoundThe whole lower limbMaxKE.1 (Joule)CG26.74 ± 2.1722.4131.07CG vs TKATKA22.31 ± 2.4217.4827.14CG vs UKAUKA25.24 ± 2.1320.9829.49TKA vs UKAmaxKE.2 (Joule)CG25.66 ± 2.1321.4229.91CG vs TKATKA26.61 ± 2.3721.8731.34CG vs UKAUKA27.1 ± 2.0922.9231.27TKA vs UKAMinKE.1 (Joule)CG1.52 ± 0.141.251.79CG vs TKATKA1.43 ± 0.151.131.73CG vs UKAUKA1.52 ± 0.131.261.79TKA vs UKAMinKE.2 (Joule)CG1.43 ± 0.151.131.73CG vs TKATKA1.57 ± 0.171.241.91CG vs UKAUKA1.69 ± 0.151.391.98TKA vs UKARangeKE.1 (Joule)CG25.23 ± 2.0621.1129.34CG vs TKATKA20.88 ± 2.3016.2925.47CG vs UKAUKA23.71 ± 2.0219.6727.76TKA vs UKARangeKE.2 (Joule)CG24.23 ± 2.0220.2128.26CG vs TKATKA25.04 ± 2.2520.5529.53CG vs UKAUKA25.41 ± 1.9821.4529.37TKA vs UKAMaxPE.1 (Joule)CG63.27 ± 2.2458.7967.74CG vs TKATKA80.56 ± 2.5075.5685.55CG vs UKAUKA78.32 ± 2.2073.9282.72TKA vs UKAMaxPE.2 (Joule)CG63.48 ± 2.2359.0167.94CG vs TKATKA80.49 ± 2.4975.5285.47CG vs UKAUKA77.09 ± 2.2072.7081.47TKA vs UKAMinPE.1 (Joule)CG58.50 ± 2.0354.4462.55CG vs TKATKA74.47 ± 2.2669.9578.99CG vs UKAUKA72.28 ± 1.9968.3076.27TKA vs UKAMinPE.2 (Joule)CG58.93 ± 2.0154.9062.96CG vs TKATKA73.90 ± 2.2569.4278.39CG vs UKAUKA71.28 ± 1.9867.3375.24TKA vs UKARangePE.1 (Joule)CG4.77 ± 0.324.125.42CG vs TKATKA6.08 ± 0.365.366.80CG vs UKAUKA6.04 ± 0.325.406.68TKA vs UKARangePE.2 (Joule)CG4.55 ± 0.353.855.24CG vs TKATKA6.59 ± 0.395.817.37CG vs UKAUKA5.80 ± 0.345.126.49TKA vs UKARecoveryCof.1CG8.62 ± 1.016.6110.63CG vs TKATKA10.73 ± 1.128.4912.97CG vs UKAUKA9.02 ± 0.997.0410.99TKA vs UKARecoveryCof.2CG9.68 ± 0.798.0911.27CG vs TKATKA8.88 ± 0.897.1110.65CG vs UKAUKA7.54 ± 0.785.979.10TKA vs UKANote: a. Covariates appearing in the model are evaluated at the following values: Age = 62.66, BMI = 27.98.b. Adjustment for multiple comparisons: Bonferroni.c.Dependent Variable 1: Leg without surgical operation; Dependent Variable 2: Leg with surgical operation. KE is translational kinetic energy; PE is potential energy; CG is control group. :p<0.05; : p <0.01; : p <0.001.Table 5. Comparison of Kinetic and Potential energy (Joule) parameters of the segments among the TKA, UKA, and Control groups.Table 5. SegmentDependent VariableGroupMean ± SE95% Confidence IntervalNotesLower BoundUpper BoundUpper legMaxKE.1 (Joule)CG12.42 ± 0.9910.45**14.39CG vs TKA**TKA11.00 ± 1.10**8.8013.19**CG vs UKAUKA**12.67 ± 0.9710.74**14.61TKA vs UKA**MaxKE.2 (Joule)CG12.99 ± 0.9111.18**14.81CG vs TKA**TKA10.53 ± 1.01**8.5012.55**CG vs UKAUKA**12.26 ± 0.8910.47**14.04TKA vs UKA**MinKE.1 (Joule)CG2.02 ± 0.181.66**2.38CG vs TKA**TKA1.86 ± 0.20**1.472.26**CG vs UKAUKA**1.99 ± 0.181.64**2.34TKA vs UKA**MinKE.2 (Joule)CG1.95 ± 0.191.57**2.33CG vs TKA**TKA1.97 ± 0.21**1.542.39**CG vs UKAUKA**2.15 ± 0.191.78**2.53TKA vs UKA**RangeKE.1 (Joule)CG10.40 ± 0.848.72**12.07CG vs TKA**TKA9.13 ± 0.94**7.2611.00**CG vs UKAUKA**10.68 ± 0.829.03**12.33TKA vs UKA**RangeKE.2 (Joule)CG11.05 ± 0.759.56**12.54CG vs TKA**TKA8.56 ± 0.83**6.9010.22**CG vs UKAUKA**10.10 ± 0.738.64**11.57TKA vs UKA**MaxPE.1 (Joule)CG51.27 ± 1.7747.73**54.81CG vs TKA*****TKA65.82 ± 1.98**61.8769.77**CG vs UKAUKA**63.66 ± 1.7460.1767.14TKA vs UKAMaxPE.2 (Joule)CG51.59 ± 1.7948.0255.16CG vs TKATKA65.41 ± 1.99**61.4369.39**CG vs UKAUKA**62.89 ± 1.7659.3866.40TKA vs UKAMinPE.1 (Joule)CG48.13 ± 1.6544.8351.43CG vs TKATKA61.88 ± 1.84**58.2065.56**CG vs UKAUKA**59.68 ± 1.6256.4462.93TKA vs UKAMinPE.2 (Joule)CG48.41 ± 1.6745.0751.75CG vs TKATKA61.35 ± 1.86**57.6365.07**CG vs UKAUKA**58.84 ± 1.6455.5662.13TKA vs UKARangePE.1 (Joule)CG3.14 ± 0.262.613.66CG vs TKATKA3.93 ± 0.293.354.52CG vs UKAUKA3.97 ± 0.263.464.49TKA vs UKARangePE.2 (Joule)CG3.18 ± 0.262.673.70CG vs TKATKA4.07 ± 0.293.494.64CG vs UKAUKA4.05 ± 0.253.544.55TKA vs UKALower legMaxKE.1 (Joule)CG10.96 ± 0.869.2412.68CG vs TKATKA9.02 ± 0.967.0910.94CG vs UKAUKA10.05 ± 0.858.3611.75TKA vs UKAMaxKE.2 (Joule)CG10.99 ± 0.859.2812.69CG vs TKATKA10.07 ± 0.958.1711.97CG vs UKAUKA10.84 ± 0.849.1612.51TKA vs UKAMinKE.1 (Joule)CG0.04 ± 0.010.030.05CG vs TKATKA0.05 ± 0.010.030.06CG vs UKAUKA0.05 ± 0.010.040.06TKA vs UKAMinKE.2 (Joule)CG0.03 ± 0.010.010.04CG vs TKA*****TKA0.07 ± 0.010.050.09CG vs UKAUKA0.07 ± 0.010.050.09TKA vs UKARangeKE.1 (Joule)CG10.92 ± 0.869.2012.64CG vs TKATKA8.97 ± 0.967.0510.89CG vs UKAUKA10.00 ± 0.858.3111.69TKA vs UKARangeKE.2 (Joule)CG10.96 ± 0.859.2612.65CG vs TKATKA10.00 ± 0.958.1111.89CG vs UKAUKA10.77 ± 0.839.1012.43TKA vs UKAMaxPE.1 (Joule)CG10.65 ± 0.419.8311.47CG vs TKATKA13.13 ± 0.4612.2214.05CG vs UKAUKA12.89 ± 0.4012.0813.70TKA vs UKAMaxPE.2 (Joule)CG10.76 ± 0.409.9711.55CG vs TKATKA13.07 ± 0.4412.1913.95****CG vs UKAUKA12.65 ± 0.3911.8713.42**TKA vs UKAMinPE.1 (Joule)CG8.89 ± 0.33**8.249.54CG vs TKATKA**10.88 ± 0.3610.16**11.61CG vs UKAUKA**10.68 ± 0.3210.04**11.32TKA vs UKA**MinPE.2 (Joule)CG8.96 ± 0.328.33**9.59CG vs TKATKA**10.79 ± 0.3510.09**11.50CG vs UKAUKA**10.56 ± 0.319.94**11.18TKA vs UKA**RangePE.1 (Joule)CG1.76 ± 0.111.55**1.97CG vs TKATKA2.25 ± 0.122.022.48CG vs UKAUKA**2.21 ± 0.102.00**2.41TKA vs UKA**RangePE.2 (Joule)CG1.80 ± 0.101.59**2.01CG vs TKATKA2.28 ± 0.122.052.51CG vs UKAUKA2.09 ± 0.101.882.29TKA vs UKAFootMaxKE.1 (Joule)CG11.63 ± 0.879.8913.36CG vs TKATKA8.97 ± 0.977.0310.90CG vs UKAUKA9.87 ± 0.858.1711.57TKA vs UKAMaxKE.2 (Joule)CG21.71 ± 14.707.6551.08CG vs TKATKA66.35 ± 16.3833.6199.08CG vs UKAUKA24.04 ± 14.444.8252.90TKA vs UKAMinKE.1 (Joule)CG0.00 ± 0.000.000.00CG vs TKATKA0.00 ± 0.000.000.00CG vs UKAUKA0.00 ± 0.000.000.00TKA vs UKAMinKE.2 (Joule)CG0.00 ± 0.000.000.00CG vs TKATKA0.00 ± 0.000.000.00CG vs UKAUKA0.00 ± 0.000.000.00TKA vs UKARangeKE.1 (Joule)CG11.63 ± 0.879.8913.36CG vs TKATKA8.97 ± 0.977.0310.90CG vs UKAUKA9.87 ± 0.858.1711.57TKA vs UKARangeKE.2 (Joule)CG21.71 ± 14.70−51.087.65CG vs TKATKA**66.35 ± 16.3833.6199.08CG vs UKAUKA24.04 ± 14.44****−4.8252.90TKA vs UKAMaxPE.1 (Joule)CG2.30 ± 0.132.052.56CG vs TKATKA2.88 ± 0.142.603.17CG vs UKA**UKA3.05 ± 0.12**2.813.30**TKA vs UKAMaxPE.2 (Joule)CG2.26 ± 0.09**2.082.43**CG vs TKATKA**3.05 ± 0.102.863.25CG vs UKAUKA2.95 ± 0.09**2.773.12**TKA vs UKAMinPE.1 (Joule)CG0.82 ± 0.05**0.720.92**CG vs TKATKA**1.17 ± 0.051.061.27CG vs UKAUKA1.22 ± 0.05**1.131.32**TKA vs UKAMinPE.2 (Joule)CG0.83 ± 0.04**0.740.91**CG vs TKATKA**1.20 ± 0.051.101.30CG vs UKAUKA1.16 ± 0.04**1.071.24**TKA vs UKARangePE.1 (Joule)CG1.48 ± 0.09**1.311.66**CG vs TKATKA**1.72 ± 0.101.52**1.91CG vs UKA**UKA1.83 ± 0.09**1.662.00**TKA vs UKARangePE.2 (Joule)CG1.43 ± 0.06**1.321.54**CG vs TKATKA**1.85 ± 0.061.731.98CG vs UKAUKA1.79 ± 0.06**1.68*1.90TKA vs UKANote: a Covariates appearing in the model are evaluated at the following values: Age = 62.66, BMI = 27.98.b Adjustment for multiple comparisons: Bonferroni. c Dependent Variable 1: Leg without surgical operation; Dependent Variable 2: Leg with surgical operation. KE is translational kinetic energy; PE is potential energy; CG is control group. *:p<0.05; **: p <0.01; ***: p <0.001.
The energy dynamic changes in the upper leg, lower leg and foot are shown in Fig. 1, Fig. 2, Fig. 3, Fig. 4, Fig. 5, Fig. 6. As the UKA group has similar trends to the TKA, the figures for the UKA are neglected.Fig. 1. Comparison of potential energies between TKE op- and non-op sides and control groups in the upper leg. Green-control, red-TKE op-side, blue- TKE non-op side. (For interpretation of the references to colour in this figure legend, the reader is referred to the Web version of this article.)Fig. 1. Fig. 2Comparison of kinetic energies between TKE op- and non-op sides and control groups in the upper leg. Green-control, red-TKE op-side, blue- TKE non-op side. (For interpretation of the references to colour in this figure legend, the reader is referred to the Web version of this article.)Fig. 2. Fig. 3Comparison of potential energies between TKE op- and non-op sides and control groups in the lower leg.Fig. 3. Fig. 4Comparison of kinetic energies between TKE op- and non-op sides and control groups in the lower leg.Fig. 4. Fig. 5Comparison of potential energies between TKE op- and non-op sides and control groups in the foot.Fig. 5. Fig. 6Comparison of kinetic energies between TKE op- and non-op sides and control groups in the foot.Fig. 6
Control group versus UKA group
3.3.2
The results showed that the operated side of UKA exhibited significantly higher Min KE than the Control group in the lower leg segment. However, there was no significant difference observed in other aspects of comparison between the two groups in Table 4 and Table 5.
TKA group versus UKA group
3.3.3
The results are shown in Table 4, Table 5 No significant difference was found in KE between TKA and UKA.
Non-operated side versus operated side
3.3.4
When compared whole lower limb, the Min KE in operated side was significantly higher than non-operated side in UKA. The Max KE and the range of KE in non-operated side was lower than operated side in TKA (Table 6). In the lower leg of the TKA group, the range of KE and Max KE were significantly higher on the operated side than on the non-operated side. The operated side had significantly higher Min KE than the non-operated side in the foot of TKA. In the upper leg and lower leg of the UKA group, the Min KE is significantly higher on the operated side than on the non-operated side. In physics, the change in energy is roughly equal to the work output by an object, so the non-operative side of the lower leg in the TKA group did less work in gait than the operative side as shown in Table 7.Table 6. Comparison of Kinetic and Potential energy (Joule) parameters and Recovery Coefficients of the whole between operated side and non-operated side.Table 6. SegmentGroupDependent VariableMean ± SE95% Confidence IntervalLower BoundUpper BoundThe whole lower limbCGMaxKE.1(Joule)29.76 ± 1.0927.5531.98MaxKE.2(Joule)30.13 ± 1.1327.8232.44MinKE.1(Joule)1.77 ± 0.061.641.90MinKE.2(Joule)1.69 ± 0.051.591.79RangeKE.1(Joule)28.00 ± 1.0425.8830.12RangeKE.2(Joule)28.44 ± 1.1026.2130.68MaxPE.1(Joule)70.69 ± 1.8067.0274.36MaxPE.2(Joule)70.58 ± 1.8466.8474.32MinPE.1(Joule)65.42 ± 1.7061.9568.88MinPE.2(Joule)65.43 ± 1.7161.9468.92RangePE.1(Joule)5.27 ± 0.144.985.56RangePE.2(Joule)5.15 ± 0.184.785.52RecoveryCof.1****8.69 ± 0.348.00**9.39RecoveryCof.29.53 ± 0.428.6710.39TKA****MaxKE.1(Joule)****24.98 ± 2.4819.80**30.17MaxKE.2(Joule)****28.49 ± 2.7822.6834.30MinKE.1(Joule)1.51 ± 0.161.171.84MinKE.2(Joule)1.59 ± 0.181.211.97RangeKE.1(Joule)****23.47 ± 2.3318.59**28.36RangeKE.2(Joule)****26.90 ± 2.6321.4032.40MaxPE.1(Joule)85.74 ± 4.2576.8494.63MaxPE.2(Joule)86.39 ± 4.3977.2095.58MinPE.1(Joule)78.95 ± 3.7771.0786.83MinPE.2(Joule)79.30 ± 3.9471.0587.54RangePE.1(Joule)6.78 ± 0.525.697.88RangePE.2(Joule)7.10 ± 0.516.028.17RecoveryCof.19.94 ± 1.466.8912.99RecoveryCof.28.50 ± 0.677.109.90UKAMaxKE.1(Joule)22.04 ± 2.5016.7627.32MaxKE.2(Joule)22.25 ± 2.2517.4927.00MinKE.1(Joule)1.22 ± 0.140.921.51MinKE.2(Joule)1.40 ± 0.151.091.72RangeKE.1(Joule)20.82 ± 2.3815.8025.85RangeKE.2(Joule)20.84 ± 2.1316.3525.33MaxPE.1(Joule)70.38 ± 2.6464.8075.95MaxPE.2(Joule)**69.34 ± 2.6663.7274.95MinPE.1(Joule)****65.14 ± 2.3460.2170.07MinPE.2(Joule)****64.22 ± 2.3959.1869.25RangePE.1(Joule)5.24 ± 0.394.416.06RangePE.2(Joule)5.12 ± 0.364.375.87RecoveryCof.18.74 ± 0.517.669.82RecoveryCof.27.67 ± 0.606.418.94Note: Dependent Variable 1: Leg without surgical operation; Dependent Variable 2: Leg with surgical operation. KE is translational kinetic energy; PE is potential energy; CG is control group. :p<0.05; : p <0.01; : p <0.001.Table 7. Comparison of kinetic and potential energy (Joule) parameters of the segments between operated side and non-operated side.Table 7. SegmentGroupDependent VariableTypeMean ± SD95% Confidence IntervalLower BoundUpper BoundUpper legCGMaxKE(Joule)Opt-no13.83 ± 0.47*****12.8414.82Opt-yes14.23 ± 0.52MinKE(Joule)Opt-no2.36 ± 0.092.212.52Opt-yes2.28 ± 0.07****RangeKE(Joule)Opt-no11.46 ± 0.4010.6012.33Opt-yes11.94 ± 0.46*****MaxPE(Joule)Opt-no57.44 ± 1.4654.5060.37Opt-yes57.38 ± 1.48MinPE(Joule)Opt-no53.96 ± 1.4051.1656.75Opt-yes****53.72 ± 1.40RangePE(Joule)Opt-no3.48 ± 0.123.243.72Opt-yes****3.66 ± 0.12TKAMaxKE(Joule)Opt-no12.38 ± 1.269.8414.91Opt-yes12.29 ± 1.25MinKE(Joule)Opt-no1.95 ± 0.201.522.39Opt-yes2.01 ± 0.23RangeKE(Joule)Opt-no10.43 ± 1.078.2812.57Opt-yes10.28 ± 1.05MaxPE(Joule)Opt-no69.80 ± 3.3762.8876.71Opt-yes70.00 ± 3.46MinPE(Joule)Opt-no65.36 ± 3.0559.0671.66Opt-yes65.63 ± 3.17RangePE(Joule)Opt-no4.44 ± 0.373.735.15Opt-yes4.37 ± 0.33UKAMaxKE(Joule)Opt-no10.83 ± 1.108.8713.43Opt-yes10.50 ± 0.97MinKE(Joule)Opt-no1.61 ± 0.191.242.09Opt-yes1.80 ± 0.20RangeKE(Joule)Opt-no9.21 ± 0.937.5811.39Opt-yes8.70 ± 0.80MaxPE(Joule)Opt-no57.13 ± 2.1252.2161.65Opt-yes****56.60 ± 2.13MinPE(Joule)Opt-no53.76 ± 1.9349.2457.91Opt-yes****53.14 ± 1.97RangePE(Joule)Opt-no3.37 ± 0.282.723.99Opt-yes3.46 ± 0.29Lower legCGMaxKE(Joule)Opt-no11.94 ± 0.4411.0712.82Opt-yes11.92 ± 0.44MinKE(Joule)Opt-no0.04 ± 0.000.040.05Opt-yes0.04 ± 0.00RangeKE(Joule)Opt-no11.90 ± 0.4411.0312.78Opt-yes11.88 ± 0.44MaxPE(Joule)Opt-no11.84 ± 0.3111.2112.48Opt-yes11.86 ± 0.32MinPE(Joule)Opt-no9.89 ± 0.269.3710.42Opt-yes9.86 ± 0.26RangePE(Joule)Opt-no1.95 ± 0.051.832.08Opt-yes2.00 ± 0.07TKAMaxKE(Joule)Opt-no10.24 ± 0.978.1812.30Opt-yes****11.46 ± 1.06MinKE(Joule)Opt-no0.05 ± 0.010.040.07Opt-yes0.06 ± 0.01RangeKE(Joule)Opt-no10.19 ± 0.97*****8.1412.23Opt-yes11.40 ± 1.05MaxPE(Joule)Opt-no14.14 ± 0.7912.5115.76Opt-yes14.29 ± 0.81MinPE(Joule)Opt-no11.65 ± 0.6110.3912.91Opt-yes11.75 ± 0.64RangePE(Joule)Opt-no2.49 ± 0.192.102.87Opt-yes2.54 ± 0.19UKAMaxKE(Joule)Opt-no9.09 ± 1.007.1611.02Opt-yes9.30 ± 0.90MinKE(Joule)Opt-no0.04 ± 0.010.020.05Opt-yes0.06 ± 0.01RangeKE(Joule)Opt-no9.05 ± 1.007.13**10.98Opt-yes**9.33 ± 0.90MaxPE(Joule)Opt-no11.59 ± 0.4410.6912.48Opt-yes****11.36 ± 0.44MinPE(Joule)Opt-no9.63 ± 0.338.9410.33Opt-yes****9.49 ± 0.35RangePE(Joule)Opt-no1.95 ± 0.13**1.722.18**Opt-yes1.87 ± 0.10**FootCG**MaxKE(Joule)Opt-no12.44 ± 0.4711.52**13.36Opt-yes**12.56 ± 0.45MinKE(Joule)Opt-no0.00 ± 0.00**0.000.00**Opt-yes0.00 ± 0.00**RangeKE(Joule)Opt-no12.44 ± 0.4711.52**13.36Opt-yes**12.56 ± 0.45MaxPE(Joule)Opt-no2.52 ± 0.072.382.67Opt-yes****2.59 ± 0.08MinPE(Joule)Opt-no0.89 ± 0.020.85**0.93Opt-yes0.87 ± 0.02RangePE(Joule)Opt-no1.63 ± 0.051.52**1.74Opt-yes1.72 ± 0.06TKA**MaxKE(Joule)Opt-no11.06 ± 0.838.34**12.24Opt-yes**26.29 ± 14.70MinKE(Joule)Opt-no0.63 ± 0.190.00**0.00Opt-yes0.71 ± 0.21RangeKE(Joule)Opt-no10.43 ± 0.76**8.3312.24**Opt-yes25.58 ± 14.72**MaxPE(Joule)Opt-no20.95 ± 4.722.73**3.59Opt-yes**20.94 ± 4.68MinPE(Joule)Opt-no18.50 ± 4.56**1.091.46**Opt-yes18.41 ± 4.51**RangePE(Joule)Opt-no2.45 ± 0.231.62**2.14Opt-yes**2.53 ± 0.22UKA**MaxKE(Joule)Opt-no9.08 ± 0.967.16**11.01Opt-yes**9.39 ± 0.93MinKE(Joule)Opt-no0.00 ± 0.00**0.000.00**Opt-yes0.00 ± 0.00**RangeKE(Joule)Opt-no9.08 ± 0.967.16**11.01Opt-yes**9.39 ± 0.93MaxPE(Joule)Opt-no2.78 ± 0.132.55**3.01Opt-yes2.59 ± 0.10MinPE(Joule)Opt-no1.10 ± 0.401.02**1.19Opt-yes1.03 ± 0.04RangePE(Joule)Opt-no1.67 ± 0.091.52**1.83Opt-yes**1.56 ± 0.07***Note: Opt-no: Leg without surgical operation; Opt-yes:Leg with surgical operation. KE is kinetic energy; PE is potential energy; CG is control group. *:p<0.05; **: p <0.01; ***: p <0.001.
Potential energy parameters
3.4
Control group versus TKA group
3.4.1
In the whole lower limb and its individual segments, both the operated and non-operated sides of the Control group showed significantly lower maximum and minimum values of PE compared to the TKA. In both the calf and foot, the PE ranges on the surgical side of the control group were lower than the PE ranges on both sides of the TKA group. The results are shown in Table 4, Table 5
Control group versus UKA group
3.4.2
In the whole lower limb and its individual segments, compared to the Control group, the operated side of UKA had significantly higher max and min of PE. In the foot, the range of PE of the operated side in the UKA was significantly higher than that in the Control group. Detailed results can be found in Table 4, Table 5
TKA group versus UKA group
3.4.3
There was no significant difference in PE between TKA and UKA as in Table 4, Table 5
Non-operated side versus operated side
3.4.4
Both in the whole lower limb and its individual segments, the maximum and minimum values of PE on the operated side were significantly lower than those on the non-operated side in the UKA group. Furthermore, in the foot segment, the range of PE of the non-operated side in the UKA group was significantly higher than that of the operated side as in Table 4, Table 5
Recovery coefficient of lower limbs
3.5
When comparing the lower leg segment, the Control group showed a significantly higher recovery coefficient on the operated side compared to the TKA group as in Table 4 and Fig. 7. Operated side of lower leg in TKA was significantly higher than UKA in Fig. 7.Fig. 7. Comparison of recovery coefficients of the segments among the TKA, UKA, and Control groups. Note: a Covariates appearing in the model are evaluated at the following values: Age = 62.66, BMI = 27.98.b Adjustment for multiple comparisons: Bonferroni.c RCof.1 is energy recovery coefficient of leg without surgical operation; RCof. 2 is energy recovery coefficient of leg with surgical operation. CG is control group. *:p<0.05; **: p <0.01; ***: p <0.001.Fig. 7
When comparing the lower limb, the recovery coefficient on the non-operated side of UKA was significantly higher than on the operated side (Table 6). The recovery coefficient in the foot on the UKA operated side was significantly less than non-operated side as in Fig. 8.Fig. 8. Comparison of recovery coefficients of the segments between operated side and non-operated side. Note: Opt-1: Leg without surgical operation; Opt-2: Leg with surgical operation. KE is kinetic energy; PE is potential energy; CG is control group. *:p<0.05; **: p <0.01; ***: p <0.001.Fig. 8
Energy recovery in the center of pelvis
3.6
The center of pelvis was thought as an approximate to the CoM of whole body [20]. In this study, the results showed that the recovery coefficient is higher in the control group than the TKA and UKA groups by roughly 12%–15%, while the TKA and UKA ones are not significantly different (Table 8). The energy dynamic changes at the center of pelvis are shown in Fig. 9, Fig. 10 between the control and TKA groups.Table 8. Comparison of energy changes and recovery coefficients at the center of pelvis among groups.Table 8. Dependent VariableGroupMean ± SE95% Confidence IntervalNotesLower BoundUpper BoundRangeKECG32.4 ± 1.130.134.6CG vs TKATKA25.7 ± 1.323.128.2CG vs UKAUKA25.9 ± 1.223.528.3TKA vs UKARangePECG32.8 ± 1.230.435.2CG vs TKATKA28.8 ± 1.426.131.5CG vs UKAUKA29.8 ± 1.327.232.3TKA vs UKARangeTKECG32.4 ± 1.130.134.6CG vs TKATKA25.7 ± 1.323.128.2CG vs UKAUKA25.9 ± 1.223.528.3TKA vs UKARecoveryCofCG80.1 ± 1.277.782.4CG vs TKATKA70.4 ± 1.467.773.1CG vs UKAUKA72.8 ± 1.370.375.3TKA vs UKANotes: a. Covariates appearing in the model are evaluated at the following values: BMI = 27.9927.b. CG is control group. *:p<0.05; **: p <0.01; ***: p <0.001.Fig. 9. Comparison of potential energies between TKE op- and non-op sides and control groups in the pelvis.Fig. 9. Fig. 10Comparison of kinetic energies between TKE op- and non-op sides and control groups in the pelvis.Fig. 10
Discussion
4
In this study, the difference in lower limb energy during walking between operated side and non-operated side, and among Control group, TKA and UKA were compared. In this study, we adhere to strict inclusion criteria to ensure that participants align with the research objectives. The implementation of these measures is aimed at minimizing the potential interference of participants' medical histories with the study results. Although this study found significant differences in body weight and age among the three groups, these differences did not impact the mechanical energy exchange between the groups after we accounted for BMI and age as covariates and treated group and gender as fixed factors in our statistical analysis (as shown in Table 4, Table 5, Table 6, Table 7). Regarding gender distribution, our study revealed no significant differences in gender among the three groups. We conducted statistical analyses using BMI and age as covariates and considering group and gender as fixed factors, and these analyses indicated that these factors had no effect on the mechanical energy exchange among the three groups. The study results indicate that in our research, gender's influence was effectively controlled, allowing for a comprehensive exploration of mechanical energy exchange.
Gait parameters
4.1
In this study, patients after UKA demonstrated similar gait parameters to those after TKA. However, interestingly, despite the similarity in gait parameters, the average walking speed for TKA patients was 0.94 m/s, whereas for UKA patients, it was 1.09 m/s, both of which were much slower than speeds reported in previous studies [[21], [22], [23]]. We speculate that this discrepancy may be attributed to age, as age has been associated with decreased walking speed [24,25]. In our study, the walking speeds of both UKA and TKA patients were similar to those of healthy adults in the same age range, as reported by Nishizawa et al. [26]. Regarding spatiotemporal gait parameters, our study showed no significant differences between the TKA and UKA groups (see Table 3), suggesting that their clinical impact may not be substantial.
Furthermore, we found that TKA patients had significantly slower average walking speed compared to the control group. In terms of cadence, both the operated and non-operated sides of TKA and UKA were lower than the control group, indicating that TKA and UKA patients might have had insufficient recovery time, and even the cadence of the unaffected side in both UKA and TKA patients was lower than that of the control group. This may be because postoperative patients often use their unaffected leg as a supporting leg to protect the operated side, leading to lower cadence.
Kinetic energy
4.2
Mechanical energy expenditure largely reflects an individual's functional performance and capacity [27]. Kinetic energy is closely related to mass and speed. Some studies have shown that speed affects gait parameters [28,29], but this study found no significant variability in gait parameters such as stride length, cadence and walking speed between the TKA and UKA. So in this study, there was little difference in kinetic energy between two groups, and no significant difference occurred between TKA and UKA. The differences were mainly manifested in the surgical and non-operative sides of the patients, and between the Control group and TKA.
In this study, we found that in the lower leg segment, the maximum kinetic energy and kinetic energy range of the operated side in the TKA group were higher than those in the control group. However, at the same time, the walking speed of the TKA group was significantly slower than that of the control group. This suggests that, compared to healthy individuals, TKA patients need to expend more kinetic energy to complete their gait. Wang et al.'s study [19] found that comfortable walking speed is associated with optimal mechanical performance for energy exchange and recovery. Therefore, we speculate that the reason TKA patients do not achieve better walking speed postoperatively may be because their postoperative recovery has not reached the optimal mechanical performance for energy exchange and recovery.
In this study, these findings indicate a notable increase in kinetic energy on the operated side relative to the non-operated side in patients after TKA and UKA surgeries. The reason for this may be related to the volunteer's post-operated walking pattern. One study showed that TKA patients still walked 18 percent slower than normal patients one year after surgery [30]. Another study showed that knee replacement patients' walking speed did not improve significantly between 0.5 and 5 months after surgery, but then showed high efficiency for 6–60 months, with a small decrease beginning at 13 months [29,31]. The reason for this may be related to the walking pattern of subjects.
Potential energy
4.3
Potential energy is closely related to the calculation of mass and height. In this study, we used the ground as the reference point for height. Our research findings confirmed that the center of mass height achieved during gait is lower in the control group than in post-TKA and post-UKA patients. Mechanical efficiency is defined as the energy consumed to perform a certain amount of external work. Some studies found that a comfortable walking speed is associated with higher energy exchange and recovery [10]. The higher potential energy in postoperative patients may be attributed to the need for adopting compensatory gait patterns to reduce fatigue. These findings reveal potential adaptive adjustments in gait control among postoperative patients. Levinger et al. [32] reported that after TKA, the biomechanics of the ankle joint also changed, and the torques of dorsiflexion and plantarflexion increased significantly, which was a compensation for the insufficient ability of the knee joint to provide sufficient walking power.
This study indicated that the lower limbs on the non-operated side are more active than those on the operated side when walking on the vertical plane, which may be a result of reduced maximum potential energy due to hip flexion contracture after UKA surgery. In contrast to TKA, knee flexion and extension patterns are maintained well in most UKA patients during walking cycles [33]. This is also consistent with the results obtained in our study. This may be that the knee or hip joint in TKA is more active in the vertical plane than in the UKA group, or it may be influenced by the weight difference between the two groups. Chassin et al. [34] reported that there was more knee flexion in the UKA group than in the TKA group during walking, which may be related to the results of this study.
Recovery coefficient
4.4
The concept of Recover was proposed a long time ago. Wang et al. [19] showed that among different walking modes, the way of subjective comfortable walking had the highest energy recovery efficiency and was also considered to be the walking state with the least effort. In this study, the main analysis is the conversion efficiency of kinetic energy and potential energy of lower limbs when walking.
In terms of energy exchange in the lower limb segments, our study found that in the UKA group, the non-operated side of the foot segment exhibited significantly higher energy exchange compared to the operated side. Additionally, when comparing the same operated side, the recovery coefficient of the TKA group's lower leg was significantly higher than that of the UKA and control groups. These results suggest that TKA surgery is more favorable for recovery in the lower leg, while UKA surgery is more beneficial for recovery in the thigh, possibly due to different surgical approaches.
Furthermore, based on all the statistical data, we found that the upper limbs had the highest energy conversion rate during walking (approximately 40%), followed by the feet (approximately 10%) and the lower legs (1–3%). In other words, the upper limbs were more efficient in energy conversion compared to the lower legs and feet, which aligns with the principle of a pendulum. To our knowledge, these findings are the first to be discovered in gait analysis. Therefore, these results will undoubtedly contribute to our understanding of the gait in patients after TKA or UKA surgeries and support our clinical rehabilitation practices.
Limitation
4.5
There are some limitations in this study, the most important of which is the lack of relevant preoperative walking data. However, it was observed that the gait parameters at 4 months post-surgery were better predictors of abnormal gait parameters at 1-year post-surgery than preoperative gait parameters [35]. Due to the impact of COVID-19, the data for the three groups in our study had to be directly extracted from a database. However, it's important to note that all the data in the database originate from the local region, which means we couldn't increase the sample size or achieve equal group size. Due to the small sample size, the applicability of the study's results is limited to the specific characteristics of the participants and may not necessarily represent a broader population. As a small sample size, this study was defined as a preliminary study as in the title. Therefore, we hope that future research will increase the sample size and employ more comprehensive data collection methods to gain a more comprehensive understanding and evaluation of the gait performance and recovery coefficients of postoperative patients. In addition, the ages from different groups were different, which could affect the energy changes during gait. However, the energy recovery coefficients are dimensionless and thus comparable among groups.
Clinical relevance
4.6
As there is no reseach on analyses of lower limb energy recovery coefficients in patients after UKA and TKA surgery, the results of this study can serve as a supplement to this new field. The energy recovery coefficient values have clinical potential in applications. In terms of the heavy calculations, this project made a specific computer program (using Matlab®) which could be combined into a standard clinical analysis package, e.g. Vicon Nexus®. Therefore, clinicians could run it quickly and routinely.
In practical application, all calculations on energy parameters would be carried out by software, taking a couple of seconds, and thus what clinicians need to do is to explain the results, e.g. which group is higher or lower than the control group in the parameters. This information could provide a specific aspect of gait for the patients with movement disordered.
Conclusion
5
In this study, the comparisons among the control group, TKA group, and UKA group primarily focused on potential energy. Both the TKA and UKA groups exhibited significantly higher maximum and minimum potential energy in the entire lower limb and individual segments compared to the control group. Although there were no statistically significant differences in potential energy between the TKA and UKA groups, except for the foot segment on the operated side, the TKA group showed larger potential energy variations in all other segments compared to the UKA group. Regarding the comparison of recovery coefficients, based on all the statistical data, the upper legs had the highest energy conversion rate during walking (approximately 40%), followed by the feet (approximately 10%) and the lower legs (1–3%). However, the energy recovery coefficients at the centre of pelvis were significantly higher in the control group than the TKA and UKA groups by roughly 12%–15%.
Lab inf: the Motion & Gait Analysis Laboratory at the Tayside Orthopaedics and Rehabilitation Technology Centre (TORT), School of Medicine, Ninewells Hospital, Dundee, Scotland.
Funding information
The 10.13039/100008890University of Dundee the Library's Institutional Open Access Fund.
Ethical note
A waiver of ethical approval. As this study extracted the data from the existing database without contacting participants, the school ethical committee granted the waiver of ethical application. The lab is on the base of a hospital where there is a general ethical approval for data collection and subjects had signed written consent forms when they attended the original data collection. When data was collected previously, ethical approval was granted by University of Dundee Research Ethics Committee (UREC 15183) and the Cambridge South Research Ethics Committee (16/EE/0021).
Data availability statement
Data will be made available on request.
CRediT authorship contribution statement
Haifei Zhou: Investigation, Formal analysis, Data curation. Yuying Zhang: Writing – original draft, Visualization, Investigation, Formal analysis. Archit Agarwal: Data curation. Graham Arnold: Resources, Project administration, Data curation. Weijie Wang: Writing – review & editing, Validation, Supervision, Software, Methodology, Investigation, Funding acquisition, Formal analysis, Conceptualization.
Declaration of competing interest
The authors declare that they have no known competing financial interests or personal relationships that could have appeared to influence the work reported in this paper.
The reference list from the paper itself. Each links out to its DOI / PubMed record.
- 1Woolf A.D.Pfleger B.Burden of major musculoskeletal conditions Bull. World Health Organ.819200364665614710506 PMC 2572542 · pubmed ↗
- 2Cieza A.Causey K.Kamenov K.Hanson S.W.Chatterji S.Vos T.Global estimates of the need for rehabilitation based on the Global Burden of disease study 2019: a systematic analysis for the Global Burden of disease study 2019 Lancet 3961026720212006201710.1016/S 0140-6736(20)32340-033275908 PMC 7811204 · doi ↗ · pubmed ↗
- 3Liu Y.Zhao X.D.Zou C.Lingering risk: a meta-analysis of outcomes following primary total knee arthroplasty for patients with post-traumatic arthritis Int. J. Surg.77202016317210.1016/j.ijsu.2020.03.05332247846 · doi ↗ · pubmed ↗
- 4Jansen K.Beckert M.Deckard E.R.Ziemba-Davis M.Meneghini R.M.Satisfaction and functional outcomes in unicompartmental compared with total knee arthroplasty:Radiographically Matched Cohort analysis JB JS Open Access 532020 e 20.0005110.2106/JBJS.OA.20.00051 PMC 772260033299963 · doi ↗ · pubmed ↗
- 5Schwab P.E.Lavand’homme P.Yombi J.C.Thienpont E.Lower blood loss after unicompartmental than total knee arthroplasty Knee Surg. Sports Traumatol. Arthrosc.2320153494 e 50010.1007/s 00167-014-3188-x 25063489 · doi ↗ · pubmed ↗
- 6Abbasi-Bafghi H.Fallah-Yakhdani H.R.Meijer O.G.The effects of knee arthroplasty on walking speed: a meta-analysis BMC Musculoskelet Disord 1320126610.1186/1471-2474-13-6622559793 PMC 3481434 · doi ↗ · pubmed ↗
- 7Berman A.T.Zarro V.J.Bosacco S.J.Israelite C.Quantitative gait analysis after unilateral or bilateral total knee replacement J Bone Joint Surg Am 6991987134013453440793 · pubmed ↗
- 8Mc Clelland J.A.Webster K.E.Feller J.A.Gait analysis of patients following total knee replacement: a systematic review Knee 144200725326310.1016/j.knee.2007.04.00317531493 · doi ↗ · pubmed ↗