Protocol to visualize and quantify the COPII concentration and anterograde transport of nascent G protein-coupled receptors
Xin Xu, Guangyu Wu

TL;DR
This paper provides a detailed protocol to visualize and measure how new GPCRs are transported from the endoplasmic reticulum to the cell surface using COPII vesicles.
Contribution
A novel protocol using the RUSH system to study the anterograde transport of GPCRs and other cargoes.
Findings
The protocol enables visualization of GPCR recruitment to COPII vesicles.
It allows quantification of GPCR transport from the ER through the Golgi to the cell surface.
The method is applicable to non-GPCR cargoes as well.
Abstract
Here, we present a protocol for visualization and quantification of the recruitment of newly synthesized G protein-coupled receptors (GPCRs) to coat protein complex II vesicles and GPCR transport from the endoplasmic reticulum through the Golgi to the cell surface in the retention using the selective hooks assay. We describe steps for plasmid construction, cell transfection, transport synchronization, confocal microscope imaging, and quantification. This protocol is also applicable for studying the transport of non-GPCR cargoes. For complete details on the use and execution of this protocol, please refer to Xu et al.1,2 •Application of the RUSH system in studying the forward delivery of nascent GPCRs•Steps to visualize the concentration of GPCRs in COPII vesicles•Introductions for characterizing the ER-to-Golgi transport of GPCRs•Guidance on measuring the post-Golgi traffic of GPCRs…
Genes, proteins, chemicals, diseases, species, mutations and cell lines named across the full text — each resolved to its canonical identifier and authoritative record.
Click any figure to enlarge with its caption.
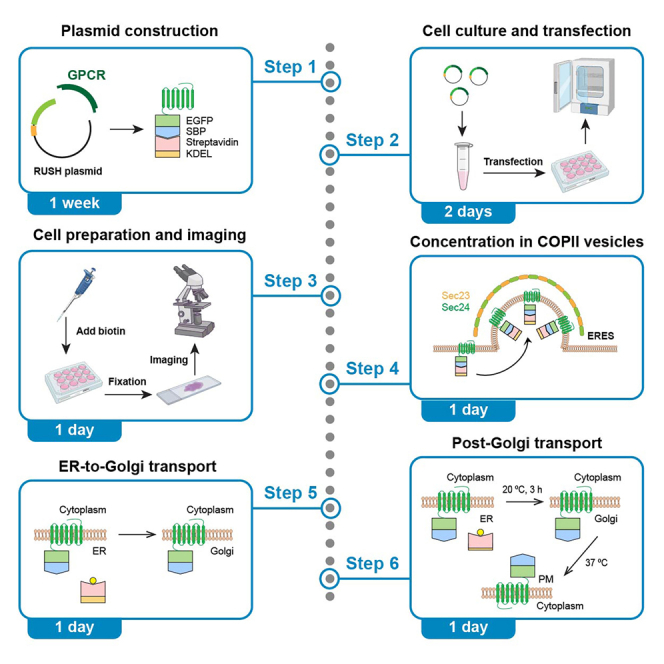 Figure 1
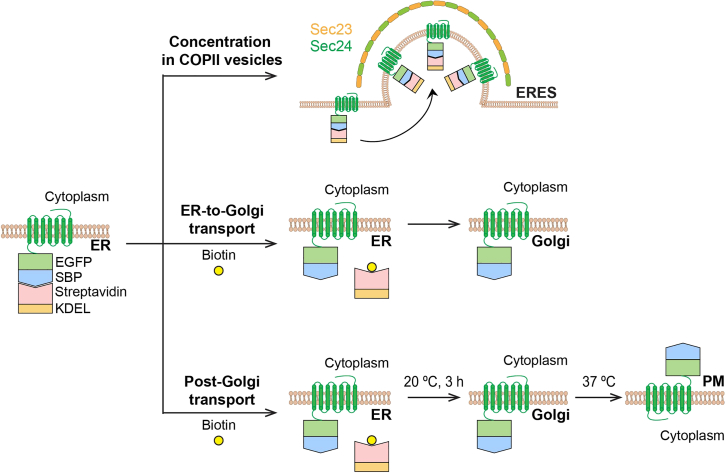 Figure 2
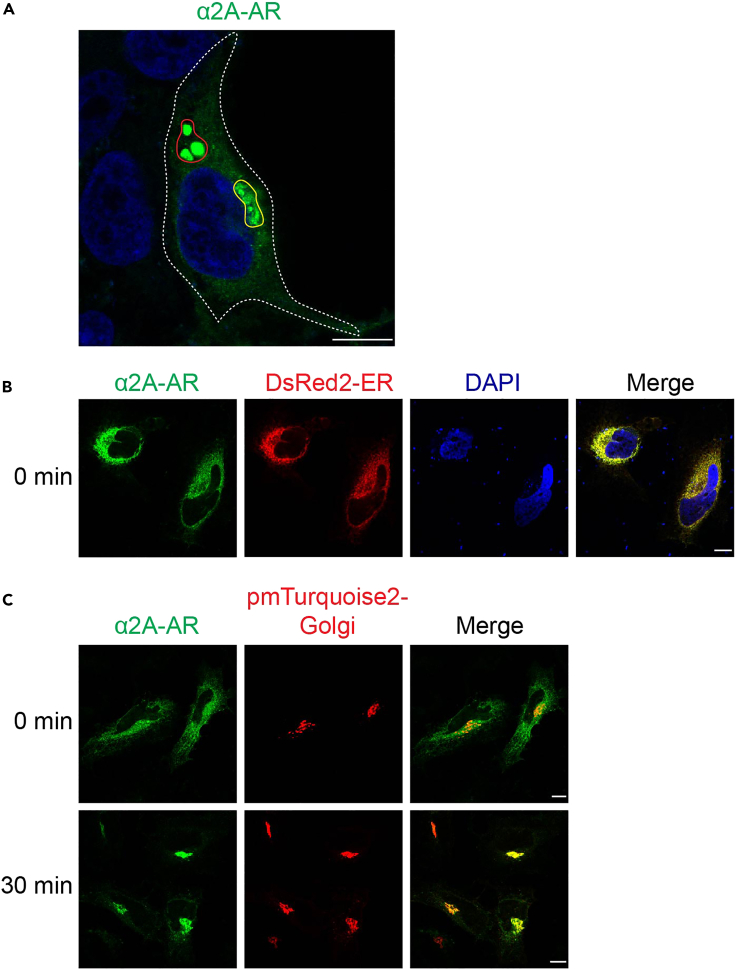 Figure 3
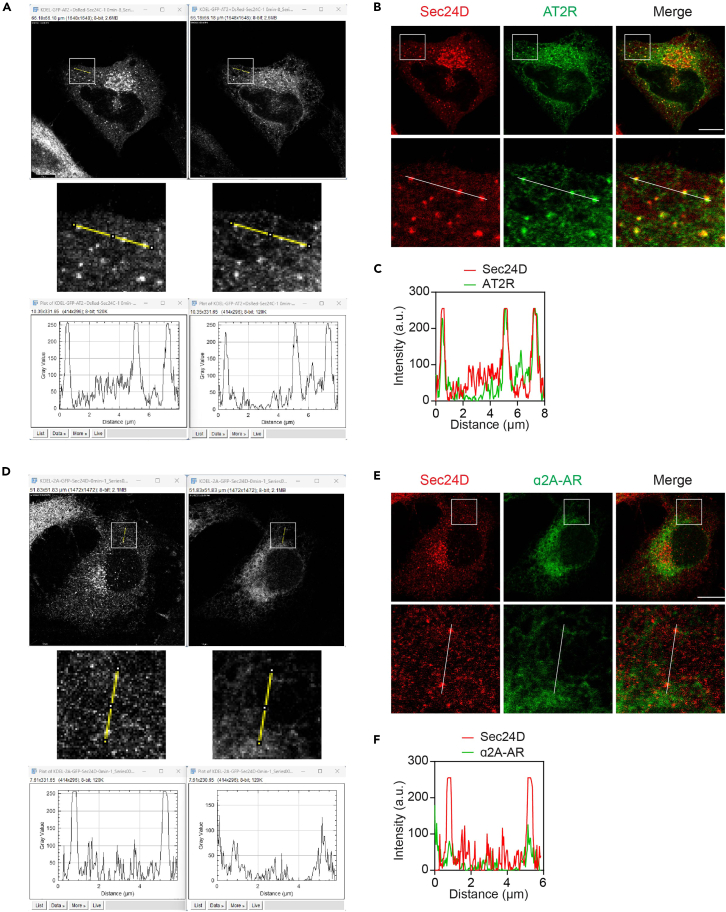 Figure 4
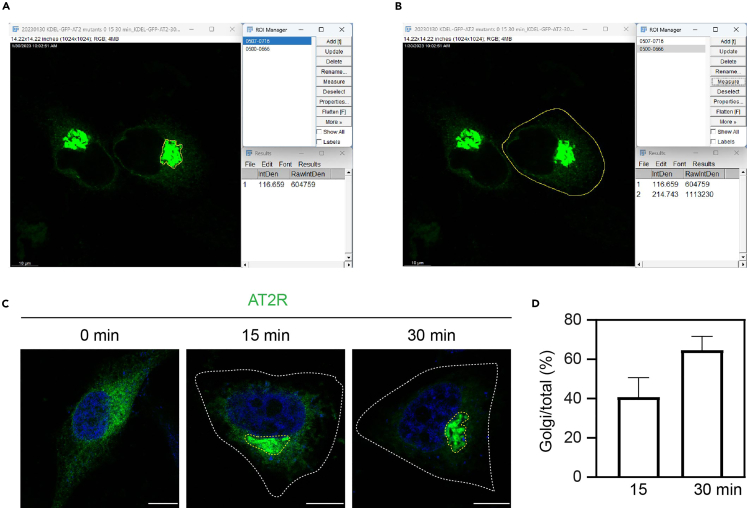 Figure 5
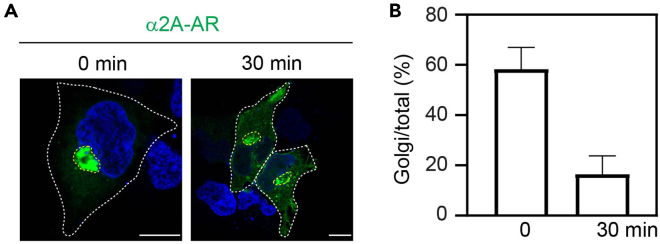 Figure 6
Peer Reviews
No public reviews on file for this paper yet. If you reviewed it on a platform where reviews are public (OpenReview, ICLR, NeurIPS, ICML), you can paste yours below so the community can read it here.
Videos
No videos yet. Explain this paper in a talk, walkthrough, or lecture? Add one.
Taxonomy
TopicsReceptor Mechanisms and Signaling · Monoclonal and Polyclonal Antibodies Research · Lipid Membrane Structure and Behavior
Before you begin
Coat protein complex II (COPII) vesicles are well characterized to exclusively mediate the export of newly synthesized proteins from the endoplasmic reticulum (ER).3 G protein-coupled receptors (GPCRs) constitute the largest superfamily of cell surface signaling proteins and are important targets of the drugs on the market.4^,^5 However, it remains largely unknown how GPCRs are recruited to COPII vesicles from the ER where they are born, and then anterogradely transported to the cell surface, the functional destination for most GPCRs, en route pass through the Golgi apparatus where they may undergo post-translational modifications.6^,^7 When compared with non-GPCR plasma membrane proteins and secretory cargoes, GPCRs may use specific motifs and directly interact with the components of transport machineries and regulatory proteins to control their forward delivery.8^,^9^,^10^,^11^,^12^,^13^,^14^,^15^,^16^,^17
Although a number of methods, such as radioligand binding and pulse chase,18^,^19^,^20 have been employed to study the regulation of GPCR biosynthesis in cell, recently established retention using the selective hooks (RUSH) assays can be used to visualize GPCR capture by COPII vesicles and study their transport dynamics between intracellular compartments.1^,^2^,^21^,^22 In this protocol, we describe steps to detect the recruitment of nascent GPCRs to COPII vesicles and their anterograde transport in RUSH assays.21 In the RUSH system, GPCR of interest is tagged with a streptavidin binding peptide (SBP) at the N-terminus and with a fluorescent protein at either terminus and the KDEL sequence used as a hook for retention in the ER is conjugated with streptavidin (Figure 1). After RUSH plasmids are delivered into cells and the receptors are synthesized in the ER, the interaction between SBP and streptavidin makes the nascent receptors retained in the ER. Once biotin is added to disrupt the interaction, the receptors can leave the ER and move forward to the Golgi (Figure 1).2^,^21^,^23Figure 1. Schematic diagram to study GPCR transport using the RUSH system
In our recent studies, we have generated a series of GPCRs in RUSH plasmids1^,^2^,^22 and found that, although all GPCRs studied are unable to leave the ER in RUSH assays in the absence of biotin, only a few GPCRs are recruited to and highly concentrated at the ER exist sites (ERES) on the ER membrane from where COPII vesicles are budded.1 We have analyzed the ER-to-Golgi transport kinetics of GPCRs in cells after incubation with biotin.1^,^2^,^22 In addition, we have studied the post-Golgi transport of GPCRs using the RUSH system in combination with temperature-induced transport control (Figure 1).2
Preparation of solutions and cell culture medium
Timing: 6 h
- 1.0.15 M NaCl: Dissolve 1.35 g of NaCl and make the final volume to 50 mL. Filter the solution with 0.22 μm filter and store at 4°C.
- 2.400 mg/mL CHX: Dissolve 83 mg of CHX into 207 μL of DMSO. Aliquot and store at −20°C.
- 3.7.5 mM PEI:
- a.Add 54 mg of PEI and 1 mg of phenol red to 80 mL of sterile water.
- b.Adjust pH to 2.0 with HCl. Stir until all particles are dissolved.
- c.Add 5 mL of 1 M HEPES and adjust pH to 7.0 with 1 M NaOH.
- d.Add sterile water to make the final volume to 100 mL.
- e.Filter the solution with 0.22 μm filter.
- f.Aliquot and store at 4°C or −20°C for long term use.
- 4.4 mM biotin:
- a.Add 50 mg of biotin into 45 mL of sterile water.
- b.Shake until biotin is completely dissolved.
- c.Make the final volume to 50 mL. Filter with 0.22 μm filter.
- d.Aliquot and store at 4°C or −20°C for long term use.
- 5.4% PFA:
- a.Add 4 g of PFA to 90 mL of PBS in a glass bottle with lid.
- b.Put the bottle at 60°C in water bath until PFA is dissolved.
- c.Make the final volume to 100 mL.
- d.Filter the solution with filter paper. Aliquot and store at −20°C.
- 6.DMEM containing 10% FBS and 1% P/S: Add 50 mL of FBS and 5 mL of P/S to 445 mL of DMEM. Mix well and store at 4°C. Pre-warm the medium at 37°C in water bath before use.
- 7.DMEM containing 10% FBS, 40 μM biotin and 400 μg/mL CHX: dilute FBS at 1:10, 4 mM biotin solution at 1:100 and 400 mg/mL CHX solution at 1:1000 with DMEM. For example, to make the final volume of 10 mL, add 1 mL of FBS, 100 μL of biotin and 10 μL of CHX to 8.89 mL of DMEM.
- 8.DMEM containing 10% FBS and 400 μg/mL CHX: dilute FBS at 1:10 and 400 mg/mL CHX solution at 1:1000 with DMEM. For example, to make the final volume of 10 mL, add 1 mL of FBS and 10 μL of CHX to 8.99 mL of DMEM.
Key resources table
REAGENT or RESOURCESOURCEIDENTIFIERChemicals, peptides, and recombinant proteinsAmpicillin sodium saltSigma-AldrichCat# A0166Cycloheximide (CHX)Thermo Fisher ScientificCat# AAJ6690103D-biotinThermo Fisher ScientificCat# AC230090010DH5α competent cellsThermo Fisher ScientificCat# 18265017Dimethyl sulfoxide (DMSO)Sigma-AldrichCat# MX1458Dulbecco’s modified Eagle’s medium (DMEM)HyCloneCat# SH30243.01HIFetal bovine serum (FBS)HyCloneCat# SH30396.03HIFseINew England BiolabsCat# R0588SHClSigma-AldrichCat# 320331HEPES (1 M)GibcoCat# 15630056NaClThermo Fisher ScientificCat# BP358NaOH (1 M)Sigma-AldrichCat# 1091371003Paraformaldehyde (PFA)J.T.BakerCat# 02-003-575Penicillin-streptomycin solution (P/S)HyCloneCat# SV30010Phenol redSigma-AldrichCat# 114529Phosphate-buffered saline (PBS, 10×)Thermo Fisher ScientificCat# BP3994Platinum Taq DNA polymeraseThermo Fisher ScientificCat# 10966018Polyethylenimine (PEI)PolysciencesCat# 23966Poly-L-lysine solutionSigma-AldrichCat# P4832ProLong gold antifade mountantThermo Fisher ScientificCat# P36930ProLong gold antifade mountant with DNA stain DAPIThermo Fisher ScientificCat# P36931QIAprep spin miniprep kitQIAGENCat# 27106QIAquick gel extraction kitQIAGENCat# 28706T4 DNA ligase (1 U/μL)Thermo Fisher ScientificCat# 15224017XbaINew England BiolabsCat# R0145SExperimental models: Cell linesHeLaATCCCat# CRM-CCL-2Human embryonic kidney (HEK) 293ATCCCat# CRL-1573Recombinant DNAα2A-ARXu et al.1N/AAT2RXu et al.1N/ADsRed2-ERDuvernay et al.24N/ADsRed-Sec24DXu et al.; Dong et al.1^,^20N/APmTurquoise2-GolgiAddgeneCat# 36205Str-KDEL_SBP-EGFP-EcadherinAddgeneCat# 65286Software and algorithmsExcelMicrosofthttps://www.microsoft.comFijiNIHhttps://imagej.net/software/fiji/Las X 4.3.0Leica Microsystemshttps://www.leica-microsystems.com/Other0.22 μm syringe-driven filter unitMilliporeCat# SLMP025SS12-well cell culture platesThermo Fisher ScientificCat# 130185Inkjet microscope slidesThermo Fisher ScientificCat# 12550100Leica Stellaris 5 confocal microscopeLeica MicrosystemsN/AMicroscope coverslips (18 mm)Thermo Fisher ScientificCat# 12545100
Step-by-step method details
Construction of RUSH plasmids of GPCRs
Timing: 1 week
This part describes the generation of RUSH plasmids of GPCRs by using angiotensin II type 2 receptor (AT2R) as an example. cDNA coding AT2R is amplified by PCR, digested with Fsel and Xbal enzymes and ligated to the backbone of the RUSH plasmid Str-KDEL_SBP-EGFP-Ecadherin after digestion with the same enzymes to release E-cadherin.
- 1.Primers for amplifying human AT2R are as below:
Forward: 5′-GATCGGCCGGCCAATGAAGGGCAACTCC-3’.
Reverse: 5′-GATCTCTAGATTAAGACACAAAGGTCTCCATTTCTC-3’.
All primers were synthesized by Integrated DNA Technologies.
- 2.Conduct PCR as follows by using Platinum Taq DNA polymerase kit. ReagentFinal concentrationAmount10× PCR buffer1×5 μL50 mM MgCl_2_1.5 mM1.5 μL10 mM dNTP mix0.1 mM0.5 μL10 μM forward primer0.2 μM1 μL10 μM reverse primer0.2 μM1 μLAT2R200 ng/reaction1 μLPlatinum Taq DNA Polymerase2 U/reaction0.2 μLSterile H_2_ON/A39.8 μLTotalN/A50 μL
- 3.Set up PCR program and run. StepsTemperatureTimeCyclesInitial denaturation94°C3 min1Denaturation94°C30 s35Annealing60°C30 sExtension72°C1.1 minFinal extension72°C10 min1Hold4°Cindefinite
- 4.Separate the PCR product (1,115 bp) by 1% agarose gel electrophoresis.
- a.Extract DNA by using the QIAquick gel extraction kit.
- b.Elute DNA with 50 μL of elution buffer.
- c.Measure the DNA concentration.
- 5.Digest the PCR product and the plasmid Str-KDEL_SBP-EGFP-Ecadherin for 30 min at 37°C as follows. ReagentFinal concentrationAmount10× rCutSmart buffer1×2.5 μLPCR product or Str-KDEL_SBP-EGFP-Ecadherin500 ng/reaction10 μLFsel2 U/reaction1 μLXbal2 U/reaction1 μLSterile H_2_ON/A10.5 μLTotalN/A25 μL
- 6.Isolate digested PCR product (1,104 bp) and Str-KDEL_SBP-EGFP (5,924 bp) following step 4.
- 7.Conduct ligation reaction for 1 h as follows. ReagentFinal concentrationAmount5× DNA ligase reaction buffer1×2 μLDigested PCR product60 ng/reaction1.5 μLStr-KDEL_SBP-EGFP100 ng/reaction1 μLT4 ligase0.2 U/reaction0.2 μLSterile H_2_ON/A5.3 μLTotalN/A10 μLNote: Use the molar ratio of the PCR product:Str-KDEL_SBP-EGFP at about 3:1 in ligation reaction.
- 8.Transform 25 μL of subcloning efficiency DH5α competent cells with 1.5 μL of ligation solution according to the manufacturer procedures (https://www.thermofisher.com/order/catalog/product/18265017?SID=srch-srp-18265017). Spread the transformation medium on LB plate containing 100 μg/mL ampicillin and incubate the plate at 37°C for 12–16 h.
- 9.Pick several single colonies (usually 3) each into 3 mL of LB medium containing 100 μg/mL ampicillin and grow them for 16–20 h at 37°C with constant shaking at 250 rpm.
- 10.Purify plasmids using the QIAprep spin miniprep kit, measure plasmid concentration and verify plasmids by nucleotide sequence analysis (Azenta Life Sciences).
Cell transfection
Timing: 2 days
This part describes the procedure of cell transfection by using PEI solution. In our studies, both HEK293 and HeLa cells are used.
- 11.Put one coverslip (with 18 mm diameter) in each well of 12-well plates and add 2 mL of poly-L-lysine solution. After incubation at 37°C for 15 min, remove poly-L-lysine solution. Wash coverslips with sterile water twice and let them dry.
- 12.Seed the cells onto 12-well plates with coated coverslips at about 30% confluence. Grow the cells in 1 mL of DMEM containing FBS and P/S for 16 h at 37°C, 5% CO_2_. Note: About 5 × 10^5^ HEK293 cells and 2 × 10^5^ HeLa cells are needed for each well.
- 13.Transfect the cells by using PEI solution. The total amount of plasmids used for each well is 500 ng (with a volume of 0.5–2 μL).
- a.For each transfection, add plasmids into 21 μL of 0.15 M NaCI solution in one Eppendorf tube for 5 min.
- b.In another tube, add 4 μL of 7.5 mM PEI into 17 μL of 0.15 M NaCI solution for 5 min.
- c.Combine two solutions and incubate the mixture for 15 min.
- d.Distribute all mixture into the cell culture medium.
- 14.Incubate the cells for 6–8 h at 37°C, 5% CO_2_.
- 15.Aspirate the medium, add 1 mL of fresh DMEM containing FBS and P/S and culture the cells for additional 20 h at 37°C, 5% CO_2_.
Characterization of RUSH plasmids of GPCRs
Timing: 3 days
In this part, the cells are transfected with the RUSH plasmid Str-KDEL_SBP-EGFP-GPCR together with ER or Golgi marker, and then treated with biotin to initiate the transport from the ER and with CHX to block the synthesis of new receptors. After cell fixation, ER expression of the receptors via the RUSH system in the absence of biotin is indicated by their colocalization with the ER marker, whereas the receptor transport to the Golgi after biotin induction is determined by receptor colocalization with the Golgi marker.
- 16.To study GPCR colocalization with the ER marker, transfect the cells with 250 ng of Str-KDEL_SBP-EGFP-GPCR together with 250 ng of an ER marker (such as DsRed2-ER) for 20 h by using PEI solution following steps 11–15. Remove the medium and wash the cells twice with 1 mL of cold PBS.
- 17.To fix the cells, add 1 mL of 4% PFA solution for 15 min. Aspirate the PFA solution and wash the cells three times each with 1 mL of cold PBS for 5 min with gentle shaking.
- 18.Add one drop of ProLong Gold Antifade Mountant with DAPI on InkJet microscope slides.
- a.Pick up the coverslips from each well with tweezers or something else and put the side with the cells on the mountant.
- b.Remove the extra mountant with paper.
- c.Put the slides in a cardboard slide tray and keep the slides at 4°C.
- 19.To study GPCR colocalization with the Golgi marker after biotin induction, the cells are transfected with 250 ng of Str-KDEL_SBP-EGFP-GPCR together with 250 ng of a Golgi marker (such as pmTurquoise2-Golgi) by using PEI solution for 20 h following step 11–15.
- 20.Remove the medium and add 1 mL of DMEM containing FBS, biotin and CHX to induce receptor export from the ER for 30 min Note: CHX is not essential at this step, but it is very important when studying the ER-Golgi-surface transport after biotin induction. As such, it is suggested to use CHX in all experiments.
- 21.Aspirate the medium and wash the cells with cold PBS. Fix the cells and mount the coverslips following steps 17–18. Note: If pmTurquoise2-Golgi is used as a Golgi marker, mount the slides using ProLong gold antifade mountant without DAPI.
- 22.Image acquisition using the Leica Stellaris 5 confocal microscope with LAS X software.
- a.Set the excitation laser power at 405 nm for DAPI or pmTurquoise2, 488 nm for GFP and 561 nm for DsRed.
- b.Focus the 63× oil objective on cells expressing GFP-tagged receptors.
- c.Adjust the gain to 20%–30%.
- d.Capture pictures using frame 1024 × 1024 and speed 600.Figure 2. Characterization of RUSH plasmids in GPCR export from the ER(A) Possible aggregation of GPCRs in cell. HeLa cells were transfected with Str-KDEL_SBP-EGFP-α_2A_-AR and treated with biotin for 30 min. The area containing the receptors that are transported to the Golgi is denoted by the yellow line, whereas the area containing the receptors that likely form aggregates is denoted by the red line.(B) Colocalization of α_2A_-AR with the ER marker DsRed2-ER before biotin induction in HeLa cells.(C) Colocalization of α_2A_-AR with the Golgi marker pmTurquoise2-Golgi before (0 min) and after biotin treatment for 30 min in HeLa cells. Scale bars, 10 μm. CRITICAL: The cells with receptor aggregation should not be chosen for imaging. It is very important to distinguish the receptors that are transported to the Golgi from those that form aggregates (Figure 2A).CRITICAL: The cells that express the receptors at extremely high levels should also be excluded.Note: At least 10 pictures should be taken from each coverslip.
- 23.Export images acquired using LAS X software with 10 μm scale bar as TIFF files. Note: α_2A_-Adrenergic receptor (α_2A_-AR) is used as an example to analyze the colocalization of GPCRs with the ER and the Golgi markers before and after biotin addition. Before biotin addition (0 min), α_2A_-AR is colocalized with DsRed2-ER, demonstrating that α_2A_-AR is hooked in the ER in the RUSH system in the absence of biotin (Figure 2B). After biotin addition for 30 min, α_2A_-AR is mainly colocalized with pmTurquoise2-Golgi, indicating that α_2A_-AR can normally transport from the ER to the Golgi in the RUSH system in the presence of biotin (Figure 2C).
Visualization of the concentration of GPCRs in COPII vesicles
Timing: 4 days
In this part, the cells are transfected with GPCR RUSH plasmids together with the COPII marker Sec24D. As compared with HEK293 cells, HeLa cells have relatively large cytoplasm and flat, thus they are better cell models for experiments to visualize COPII vesicles.
- 24.Transfect the cells with 250 ng of Str-KDEL_SBP-EGFP-GPCR plus 250 ng of DsRed-Sec24D following steps 11–15.
- 25.After 20 h transfection, remove the medium and wash the cells twice with 1 mL of cold PBS. Fix the cells and mount the coverslips following steps 17–18.
- 26.Image acquisition following steps 22–23.
- 27.Analyze GPCR recruitment to COPII vesicles using Fiji software.
- a.Open merged images.
- b.Draw a line along the scale bar.
- c.Click set scale and change the number in know distance to 10 and the unit of length to μm. The frame of this image should be then changed to μm × μm.
- d.Split the channels and the images will then turn to black and white.
- e.Draw a line crossing two or three puncta in the picture of Sec24D channel.
- f.Add this line in the ROI manager for analyzing the same position at different channels.
- g.Click plot profile to get the profile of Sec24D intensity (Figures 3A and 3D).Figure 3. Analysis of GPCR recruitment to COPII vesicles(A) Identification of COPII vesicles and measurement of the intensities of Sec24D and AT2R in HeLa cells.(B) Colocalization of Sec24D and AT2R at the ERES.(C) Profile plot of the ROI in (B).(D) Identification of COPII vesicles and measurement of the intensities of Sec24D and α_2A_-AR in HeLa cells.(E) Colocalization of Sec24D and α_2A_-AR at the ERES.(F) Profile plot of the ROI in (E). The cells were transfected with Str-KDEL_SBP-EGFP-AT2R (A–C) or Str-KDEL_SBP-EGFP-α_2A_-AR (D–F) together with DsRed-Sec24 for 20 h before cell fixation and imaging. Scale bars, 10 μm.
- h.In the GPCR channel, click the saved ROI and plot profile to obtain the profile of GPCR intensity (Figures 3A and 3D).
- i.Copy all data and save them in Excel. Note: The scale should be re-set in each image when using Fiji.
- 28.Data presentation. AT2R and α_2A_-AR are used here as examples to analyze the colocalization of GPCRs with Sec24D. AT2R is strongly colocalized with Sec24D (Figures 3B and 3C), whereas localization of α_2A_-AR and Sec24D are apparently not overlaid (Figures 3E and 3F). These data demonstrate that AT2R, but not α_2A_-AR, is concentrated in COPII vesicles.
Measuring the ER-to-Golgi transport of GPCRs
Timing: 4 days
To study the ER-to-Golgi transport of GPCRs, the cells are transfected with RUSH plasmids of GPCRs and treated with biotin for different periods of time (Figure 1). As individual GPCRs studied here are characterized by using the ER and Golgi markers as described in the section “characterization of RUSH plasmids of GPCRs”, the coexpression together with Golgi markers may not be necessary.
- 29.Transfect the cells with 500 ng of Str-KDEL_SBP-EGFP-GPCR by using PEI solution following steps 11–15.
- 30.After 20 h transfection, remove the medium and add 1 mL of DMEM containing 10% FBS, 40 μM biotin and 400 μg/mL CHX. To study the transport kinetics, the cells are treated for different time periods (for example, 10, 20, 30 and 40 min).
- 31.Remove the medium and wash the cells twice with 1 mL of cold PBS. Fix the cells and mount the coverslips following steps 17–18.
- 32.Image acquisition following steps 22–23.
- 33.Measure receptor expression in the Golgi and the whole cell.
- a.Adjust the intensity of receptor channel until the background can be seen.
- b.Export images in LAS X with receptor channel only.
- c.Open the exported images in Fiji software.
- d.Use the freehand selections to circle the area with concentrated receptors and add this area to ROI manager.
- e.Click measure to get the RawIntDen as the Golgi expression of the receptor (Figure 4A).Figure 4. Analysis of the ER-to-Golgi transport of AT2R(A) Measurement of AT2R expression at the Golgi.(B) Measurement of AT2R expression in the whole cell.(C) ER-to-Golgi transport of AT2R in HeLa cells. The cells were transfected with Str-KDEL_SBP-EGFP-AT2R for 20 h and then treated with biotin for 15 and 30 min.(D) Quantification of the Golgi/total expression ratio of AT2R at 15 and 30 min after biotin incubation. The quantitative data are expressed as mean ± SD (n = 30-37 cells from 3 experiments). Scale bars, 10 μm.
- f.Circle the whole cell with freehand selections and measure the RawIntDen as the whole cell expression of the receptor (Figure 4B).
- g.Calculate the Golgi/total expression ratios of the receptor. Note: AT2R is used as an example to analyze the ER-to-Golgi transport (Figure 4). The receptors that are highly concentrated in the perinuclear regions are considered to be transported to the Golgi (Figure 4A). The Golgi/total expression ratio of AT2R at 15 min after biotin incubation is about 40% and this ratio increases to 60%–70% after 30 min induction (Figures 4C and 4D).
Measuring the Golgi-to-plasma membrane transport of GPCRs
Timing: 4 days
To study the Golgi-to-plasma membrane transport of GPCRs, the cells are transfected with GPCR RUSH plasmids for 20 h and incubated with biotin at 20°C for 3 h. This temperature allows nascent receptors to export from the ER to the Golgi, but the receptors are unable to export from the Golgi. After 3 h biotin induction, all nascent receptors will be accumulated in the Golgi and their transport from the Golgi will be synchronized after incubating the cells at 37°C (Figure 1).
- 34.Transfect the cells with 500 ng of Str-KDEL_SBP-EGFP-GPCR for 20 h by using PEI solution following steps 11–15.
- 35.Add ice to water bath and set the temperature at 20°C. Incubate DMEM containing FBS, biotin and CHX at 20°C in water bath for at least 20 min.
- 36.Incubate the cells at 20°C in water bath for 10 min. Remove the medium and add 1 mL of DMEM with FBS, biotin and CHX. Keep the cells at 20°C for 3 h.
- 37.Incubate DMEM containing FBS and CHX at 37°C for 10 min.
- 38.For control well, wash the cells twice with 1 mL of cold PBS and fix the cells with 4% PFA solution following steps 17–18.
- 39.To initiate post-Golgi transport, add 1 mL of pre-warmed DMEM with FBS and CHX in each well. To study the transport kinetics, the cells are incubated at 37°C for different time periods (for example, 15, 30, 45 and 60 min). Note: It is recommended to use different cell culture plates for different time points.
- 40.Wash the cells twice with 1 mL of PBS, fix the cells and mount the coverslips following steps 17–18 .
- 41.Image acquisition following steps 22–23.
- 42.Measure receptor expression in the Golgi and the whole cell before (0 min) and after incubation at 37°C and calculate the Golgi/total expression ratios of the receptor following step 33.Figure 5. Analysis of the post-Golgi transport of α_2A_-AR(A) Post-Golgi transport of α_2A_-AR in HEK293 cells. The cells were transfected with Str-KDEL_SBP-EGFP-α_2A_-AR for 20 h, then treated with biotin and CHX at 20°C for 3 h (0 min) and incubated with fresh DMEM without biotin at 37°C for 30 min (30 min).(B) Quantification of the Golgi/total expression ratios of α_2A_-AR before and after incubation at 37°C for 30 min following biotin induction at 20°C for 3 h. The quantitative data are expressed as mean ± SD (n = 25-43 cells from 3 experiments). Scale bars, 10 μm. Note: α_2A_-AR is used as an example to analyze the post-Golgi transport (Figure 5A). The Golgi/total expression ratio of α_2A_-AR at 0 min is about 60% and this ratio decreases to less than 20% after incubation for 30 min at 37°C (Figure 5B).
Expected outcomes
By analyzing the colocalization of individual GPCRs with the COPII component Sec24D before biotin addition in RUSH assays, we expect that certain GPCRs are able to colocalize with Sec24D in the punctate structures in the cell periphery. If so, these receptors are concentrated at the ERES and actively captured by COPII vesicles (Figures 3A–3C). For most GPCRs, they are evenly distributed throughout the ER before biotin incubation, suggesting that these receptors are not concentrated in COPII vesicles.
Biotin incubation synchronizes ER export of nascent GPCRs. After measuring the Golgi/total expression ratios at different time points after biotin induction, the ER-to-Golgi transport kinetics can be defined. It is expected that distinct GPCRs may have different transport kinetics along the early secretory pathway.
To study the post-Golgi transport of GPCRs, the RUSH system is combined with low temperature culture of cells which blocks the receptors to export from the Golgi. Similar to the ER-to-Golgi transport, Golgi-to-cell surface transport can be quantified after releasing the receptors from the Golgi for different time. It is also expected that different GPCR members may have different post-Golgi transport kinetics.
Limitations
One limitation of the protocol described here to study the COPII concentration and forward delivery of nascent GPCRs is that GPCR expression via the RUSH system is extremely high as compared to their expression at the endogenous levels. As such, COPII concentration and export kinetics of individual GPCRs as observed in the RUSH system may not reflect the transport properties of endogenous receptors.
Another potential issue is that in the RUSH system, GPCR of interest is conjugated with a fluorescent protein and SBP which may affect the correct folding and proper assembly of the receptor, thus disrupting receptor recruitment to COPII vesicles and/or export from the ER. Therefore, the receptor to be studied in the RUSH system should be carefully characterized as described in the section “characterization of RUSH plasmids of GPCRs”.
Troubleshooting
Problem 1
GPCRs remain in the ER, unable to response to biotin induction (related to steps 16–23).
Potential solution
The position of fluorescent tag may affect GPCR correct folding and misfolded receptors are unable to pass through the ER equality control and retained in the ER. One approach to tackle this issue is to generate GPCR RUSH plasmids with the fluorescent tag at different termini and test different fluorescent tags, such as GFP, mCherry and DsRed.
Problem 2
The KDEL hook is unable to arrest nascent GPCRs in the ER (related to steps 16–23).
Potential solution
The KDEL sequence has been used in our studies as an ER hook and worked quite well to block ER export of a number of GPCRs.1^,^2^,^22 If GPCR of interest is able to transport out of the ER in the absence of biotin, other ER hooks, such as a mutant of stromal interaction molecule 1 (STIM1-NN),21 can be tested.
Problem 3
GPCRs escape from the ER before treatment with biotin (related to steps 16–23).
Potential solution
If a significant portion of nascent GPCRs leak from the ER before adding biotin to cell culture medium to induce receptor export, one potential cause is the presence of biotin in FBS. Biotin-depleted FBS can be used to reduce the leakage. Alternatively, Dynabeads MyOne streptavidin beads (Thermo Fisher Scientific) can be used to remove biotin from FBS.
Problem 4
GPCRs are visualized to be clearly concentrated in vesicles under the microscope, but the vesicles cannot be captured due to quenching (related to steps 26–27).
Potential solution
Once the cells containing COPII vesicles are identified, turn off the light and adjust the intensity and laser power quickly. Capture the image at a lower speed (400 or 600). The LIGHTNING model can be used to enhance the imaging resolution.
Problem 5
In post-Golgi transport experiments, cells die after long incubation out of incubator at low temperature (related to step 36).
Potential solution
If available, refrigerated incubator can be used for low temperature culture. In addition, the Golgi hooks, such as Golgin-84,21 can be tested to anchor the receptors in the Golgi which can be released after biotin incubation.
Resource availability
Lead contact
Further information and requests for resources and reagents should be directed to and will be fulfilled by the lead contact, Guangyu Wu ([email protected]).
Technical contact
Please direct technical questions regarding this protocol to the technical contact, Xin Xu ([email protected]).
Materials availability
Reagents generated in this study are available from the lead contact upon request.
Data and code availability
- •All data reported in this paper will be available from the lead contact upon request.
- •This paper does not report the original code.
- •Any additional information reported in this paper will be shared by the lead contact upon request.
The reference list from the paper itself. Each links out to its DOI / PubMed record.
- 1Xu X.Lambert N.A.Wu G.Sequence-directed concentration of G protein-coupled receptors in COPII vesiclesi Science 26202310796910.1016/j.isci.2023.107969 PMC 1055165237810244 · doi ↗ · pubmed ↗
- 2Xu X.Qiu L.Zhang M.Wu G.Segregation of nascent GPC Rs in the ER-to-Golgi transport by CCHCR 1 via direct interaction J. Cell Sci.1372024 jcs 26168510.1242/jcs.261685 PMC 1091281138230433 · doi ↗ · pubmed ↗
- 3Gürkan C.Stagg S.M.Lapointe P.Balch W.E.The COPII cage: unifying principles of vesicle coat assembly Nat. Rev. Mol. Cell Biol.7200672773810.1038/nrm 202516990852 · doi ↗ · pubmed ↗
- 4Hauser A.S.Attwood M.M.Rask-Andersen M.Schiöth H.B.Gloriam D.E.Trends in GPCR drug discovery: new agents, targets and indications Nat. Rev. Drug Discov.16201782984210.1038/nrd.2017.17829075003 PMC 6882681 · doi ↗ · pubmed ↗
- 5Xu X.Wu G.Non-canonical Golgi-compartmentalized Gβγ signaling: mechanisms, functions, and therapeutic targets Trends Pharmacol. Sci.4420239811110.1016/j.tips.2022.11.00336494204 PMC 9901158 · doi ↗ · pubmed ↗
- 6Zhang M.Wu G.Mechanisms of the anterograde trafficking of GPC Rs: Regulation of AT 1R transport by interacting proteins and motifs Traffic 20201911012010.1111/tra.1262430426616 PMC 6342637 · doi ↗ · pubmed ↗
- 7Wang G.Wu G.Small GT Pase regulation of GPCR anterograde trafficking Trends Pharmacol. Sci.332012283410.1016/j.tips.2011.09.00222015208 PMC 3259232 · doi ↗ · pubmed ↗
- 8Xu X.Wei Z.Wu G.Specific motifs mediate post-synaptic and surface transport of G protein-coupled receptorsi Science 25202210364310.1016/j.isci.2021.103643 PMC 872840135024582 · doi ↗ · pubmed ↗