Improving Anesthesia Start Time Documentation Through a Departmental Education Initiative at Yale New Haven Hospital, New Haven, United States
Michael H Warren, Sumarth Mehta, Lena Glowka, Octavio Goncalves, Elena Gutman, Robert B Schonberger

TL;DR
A hospital improved billing accuracy for anesthesia services by educating staff on proper start-time documentation, reducing revenue loss over a year.
Contribution
A department-wide education initiative effectively reduced underbilling of anesthesia services by improving start-time documentation.
Findings
55.1% of cases were likely underbilled initially, with an estimated $52,302 revenue loss in December 2020.
After a year of monthly education emails, underbilled cases dropped to 29.2%, with revenue loss reduced to $29,300.
Properly recorded cases had an average start-to-in-room time of 4.42 minutes, indicating better adherence to billing guidelines.
Abstract
Background Reimbursement for anesthetic services in the United States utilizes a formula that incorporates procedural and patient factors with total anesthesia time. According to the Centers for Medicare & Medicaid Services and the American Society of Anesthesiologists, the period of billable time starts when the anesthesia practitioner assumes care of the patient and may include transport to the operating room from the preoperative holding area. In this report on a quality improvement effort, we implemented a departmental education initiative aimed at improving the accuracy of anesthesia start-time documentation. Methods Utilizing de-identified, internal data on surgical procedures at Yale New Haven Hospital (YNHH), New Haven, United States, the difference between documented anesthesia start and patient in-room time was determined for all cases. Those with a difference between 0-1…
Genes, proteins, chemicals, diseases, species, mutations and cell lines named across the full text — each resolved to its canonical identifier and authoritative record.
Click any figure to enlarge with its caption.
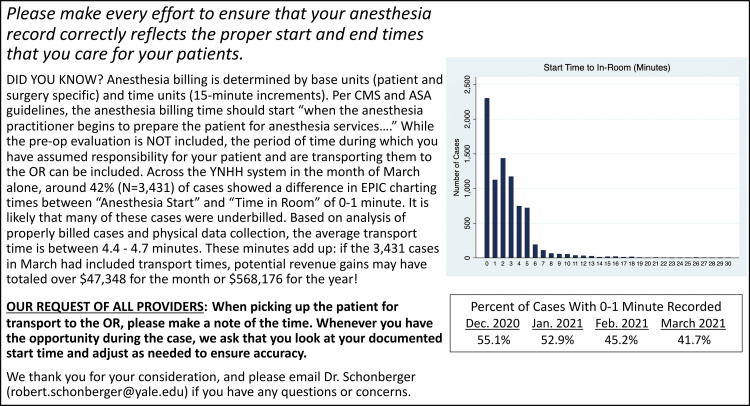 Figure 1
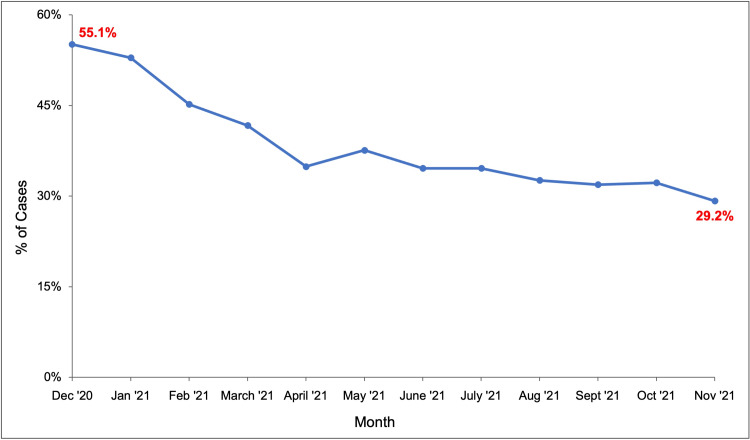 Figure 2
| Results by month (unit) | December 2020 | June 2021 | November 2021 |
| Total cases (N) | 6,967 | 8,401 | 8,199 |
| Included cases* (N) | 6,877 | 8,319 | 8,100 |
| “Likely underbilled" cases** (N) | 3,790 | 2,881 | 2,369 |
| Proportion of cases “likely underbilled" (%) | 55.1 | 34.6 | 29.2 |
| Monthly cost estimate ($) | 52,302 | 37,000 | 29,300 |
Peer Reviews
No public reviews on file for this paper yet. If you reviewed it on a platform where reviews are public (OpenReview, ICLR, NeurIPS, ICML), you can paste yours below so the community can read it here.
Videos
No videos yet. Explain this paper in a talk, walkthrough, or lecture? Add one.
Taxonomy
TopicsCardiac, Anesthesia and Surgical Outcomes · Hemodynamic Monitoring and Therapy · Healthcare Operations and Scheduling Optimization
Introduction
In the United States, reimbursement for anesthetic services utilizes a formula that includes base units and time units. Base units are standardized and depend on the type and complexity of the surgery along with patient characteristics, while time units are determined by the total length of time that anesthesia was provided. A single time unit equates to 15 minutes of anesthesia time, with fractional time units usually pro-rated for shorter periods.
Per Centers for Medicare & Medicaid Services and American Society of Anesthesiologists guidelines, anesthesia time is defined as “…the period during which an anesthesia practitioner is present with the patient. It starts when the anesthesia practitioner begins to prepare the patient for anesthesia services in the operating room or an equivalent area...” [1,2]. This period typically includes the time during which the anesthesia team has taken over principal responsibility for the patient, often commencing when the anesthesia provider picks up the patient in the preoperative area and transports the patient to the operating room. Notably, anesthesia time does not include the preoperative evaluation and examination, obtaining consent for anesthesia, nor any preoperative procedures such as nerve blocks or invasive monitoring catheter placements, some of which may be billed separately.
Modern computerized anesthesia information management systems allow for recording the beginning and end of anesthesia time within the electronic health record; however, these systems rely on the accuracy of clinician input [3,4]. While some investigations have failed to demonstrate evidence for systematic upcoding of anesthesia billing times [5], another recent study suggested that a significant proportion of cases, especially at academic centers, may have inaccurate anesthesia start times (ASTs) recorded, leading to loss of time units equivalent to hundreds of thousands of dollars in revenue each year [6]. Meanwhile, a 2011 study demonstrated that an intervention notifying clinicians of aberrantly documented ASTs with electronic charting alerts can improve the rate of adherence and therefore increase reimbursement [7].
In the present manuscript, we describe the conduct and results of a departmental quality improvement initiative in which we implemented a monthly communication informing anesthesia providers about AST documentation guidelines. As the outcome of the initiative, we observed trends in AST accuracy and estimated economic losses within the department over a one-year period.
This article was previously presented as a poster at the Yale New Haven Hospital Safety, Quality, and Experience Conference on June 2, 2022.
Materials and methods
This was an internal quality improvement project performed in the Department of Anesthesiology at Yale New Haven Hospital (YNHH), a large, academic tertiary care center. The Yale Institutional Review Board (IRB), which was consulted prior to the study's start, recommended that it qualified as a quality improvement project and was exempt from further IRB oversight.
Anesthesia providers at YNHH, including residents, attendings, and Certified Registered Nurse Anesthetists (CRNAs), are mutually responsible for documenting the AST followed by the patient in-room time on EPIC (along with incision time, case closing, and other similar case milestones). As with documentation of medication administration, providers are able to subsequently adjust the recorded times to ensure accuracy. For the present quality improvement initiative, de-identified data were queried monthly from an internal electronic health record repository for all surgical cases at YNHH. Variables extracted included the difference in minutes between AST and anesthesia in-room time (“start to in-room time,” as charted in EPIC rounded to the nearest minute). Similar to previous studies, cases with a negative difference or more than 30 minutes between “anesthesia-start” to “in-room” were excluded from analysis [6,7]. For the present quality improvement effort, cases with 0-1 minute were presumed to be “likely underbilled” cases that were suspected of being charted incorrectly. In a separate empirical investigation of actual transport times, we documented that transports from preoperative areas to operating rooms at our institution required a median of 4-5 minutes. However, differences of up to 30 minutes were included in the analysis as certain cases at YNHH may require longer travel times, such as when the anesthesia provider transports a patient from an intensive care unit to the operating room.
The project was run for a 12-month period beginning in January 2021. Data were first collected using all December 2020 surgeries for a baseline estimate of the percentage of cases that were likely to have been incorrectly charted, i.e., with a start to in-room time of 0-1 minute. Beginning in January 2021, an informational email was sent to all attendings at YNHH on the 15th of each month with an explanation of the charting rules for anesthesia and an update on the percentage of cases that were likely underbilled (please see Figure 1 for example email). Starting in April 2021, CRNAs were added as recipients, followed by residents in August 2021. At the end of each calendar month, data were queried for all cases and the subsequent email was updated with a graph showing changes over time.
Example of a monthly educational email sent to anesthesia providers at the study institutionCMS: Centers for Medicare & Medicaid Services; ASA: American Society of Anesthesiologists; YNHH: Yale New Haven Hospital; OR: Operating room
A basic cost analysis of monthly and yearly revenue lost for “likely underbilled” cases was also included in these emails using the expected start to in-room time calculated from the average of properly charted cases. A weighted average of per-unit anesthesia reimbursement from private and public insurance, specific to case volumes and the patient population at YNHH, was utilized.
Results
Baseline data
In December 2020, data for 6,967 surgical cases requiring anesthesia performed at YNHH were extracted (Table 1). Cases with a start to the in-room time of >30 minutes or <0 minutes were removed from analysis (N=90). Of the 6,877 remaining cases, 55.1% (N=3,790) had a start to the in-room time of 0-1 minute, which was considered “likely underbilled,” while 44.9% (N=3,087) had a start to the in-room time of >1 minute. Of the cases with times >1 minute, the mean start to in-room time was 4.42 minutes, with a standard deviation of 3.38 minutes.
Table 1: Comparison of monthly anesthesia start time data at the study institution Cases with a recorded start to in-room time of <0 minutes or >30 minutes were not included in the analysis.* Cases with a recorded start to the in-room time of 0-1 minute were considered “likely underbilled.”**
Baseline cost analysis
The total economic loss for likely underbilled cases was estimated by calculating the expected average number of time units lost per underbilled case using the mean start to in-room time of properly billed cases for December 2020 (4.42 minutes) with 15 minutes per time unit (rounded to nearest 0.1 unit), or 0.3 units per underbilled case. Based on 3,790 underbilled cases, the total estimate for money lost in December 2020 was $52,302.
Post-intervention trend
After starting the departmental monthly email education initiative in January 2021, the percentage of underbilled cases was tracked for each calendar month (Figure 2) along with economic loss estimates. The proportion of underbilled cases showed a downward trend over the course of the project, decreasing from 55.1% in December 2020, to 34.6% in June 2021, to 29.2% in November 2021. The economic cost estimate for underbilled cases decreased from 37,000 in June 2021, to $29,300 in November 2021 (Table 1).
Percentage of monthly anesthesia cases that were “likely underbilled,” i.e., a start to the in-room time of 0-1 minute, over a one-year period at the study institution
Discussion
In this departmental quality improvement project, we utilized a simple monthly educational email sent to all anesthesia providers within the department to improve documentation of ASTs. We observed a clear downward trend in the proportion of cases that were “likely underbilled,” i.e. had an “anesthesia start” to “in-room” time of 0-1 minute (and thus unlikely to include patient transport times from the preoperative areas), during the course of the intervention. Furthermore, there was an observed decrease in the monthly economic loss estimates.
Some prior studies aiming to improve start-time documentation have utilized more involved and personalized techniques, such as automated alerts in the electronic chart during cases [7]. To our knowledge, this is the first study to show that a simple, department-wide educational monthly email on the topic can improve start-time documentation. Unlike real-time personal alerts, our described intervention achieved excellent results without the risk of interfering with providers during their active care of patients. The described approach also has several other advantages, including ease of distribution, minimal infrastructure requirements, and lower cost. Other work using email feedback for quality improvement is ongoing and typically relies on a robust clinical informatics infrastructure [8]. Groups such as the Multicenter Perioperative Outcomes Group [9-13] quality improvement and research consortium have a widely deployed monthly email quality improvement program that has demonstrated incremental savings within the Michigan Surgical Quality Collaborative [14] as well as improvements in the process of care metrics such as train-of-four monitoring [15]. Considering that properly recording the first few minutes of anesthesia time spread over thousands of cases a month can lead to large reimbursement gains, we believe departments across the country could benefit from this simple intervention, especially at a time when reimbursement rates face ongoing downward pressures and as inflation continues to erode the value of even stable reimbursement levels.
We do wish to point out several limitations to this quality improvement initiative. Since it was purely observational, it is impossible to conclude the causality of our intervention. It is possible that other factors unknown to the investigators were simultaneously at play and influencing provider charting behaviors. Furthermore, our analysis provided overall departmental-level performance with a focus on overall trends. Monthly differences in case mix or total number of cases at different sites might have skewed the results, but we would expect such variation not to yield the steady improvements that were observed. Additionally, while our intervention was effective at a single center, further work would be needed to assess generalizability to other healthcare systems [16].
Similar to prior studies, we included cases with up to 30 minutes between anesthesia start and in-room time in our analysis [6,7]. While we found that most transport times from preoperative areas to the operating room at our institution take 4-5 minutes on average, there are several situations in which anesthesia providers take principal responsibility and travel with patients from more remote locations, such as the intensive care unit or the emergency department. We thus utilized a 30-minute cutoff while recognizing that a small number of included cases may actually be examples of overbilling.
Finally, a portion of the “likely underbilled” cases was in fact properly documented. Several situations indeed do lead to anesthesia start times immediately prior to or simultaneous with room-in times, which ideally would be documented by providers in the medical record (using a comment or quick note feature). Examples include emergency cases when the first anesthesiologist contact with the patient might occur as the patient is being transferred into the operating room. Other cases that may in fact be correctly billed could include high-volume procedural areas where preoperative waiting rooms are directly adjacent to their operating rooms. Still, our empirical analysis of actual transport times demonstrated that overall average transport times are typically greater than 0-1 minute. Thus, while we do not comment on any individual case as an example of definite underbilling, we remain confident that in the aggregate, the majority of cases with 0-1 minute transport times are consistent with incorrect charting. Moreover, the mere fact that our observed proportion of “likely underbilled” cases steadily dropped during the intervention lends further credence to the assertion that providers realized their charting inaccuracies and worked to correct them.
Conclusions
Anesthesia billing in the United States incorporates time-based units for reimbursement calculations. Thus, accurate documentation of the start and end time of anesthetic care by providers is critical to ensure proper billing compliance and maximize potential revenue. The present report demonstrates that a simple department-wide monthly email educational intervention correlated with an improvement in anesthesia start-time documentation. Furthermore, there was a reduction in estimated economic losses due to underbilling over the course of the study period. These findings could be of interest to other institutions seeking to improve their documentation accuracy with a low-cost and collective approach.
The reference list from the paper itself. Each links out to its DOI / PubMed record.
- 1Anesthesia services Current Procedural Terminology CPT codes 00000-01999 National Correct Coding Initiative Policy Manual for Medicare Services Centers for Medicare & Medicaid Services 114II 2023 https://www.cms.gov/files/document/medicare-ncci-policy-manual-2024-chapter-2.pdf
- 22019 relative value guide updates include anesthesia time and field avoidance 5 2022 2019 https://www.asahq.org/quality-and-practice-management/managing-your-practice/timely-topics-in-payment-and-practice-management/2019-relative-value-guide-updates-include-anesthesia-time-and-field-avoidance/.
- 3Anesthesia information management systems Anesth Analg Simpao AF Rehman MA 909412720182904907510.1213/ANE.0000000000002545 · doi ↗ · pubmed ↗
- 4Comparison of anesthesia times and billing patterns by anesthesia practitioners JAMA Netw Open Sun EC Dutton RP Jena AB 01201810.1001/jamanetworkopen.2018.4288 PMC 632436430646351 · doi ↗ · pubmed ↗
- 5Is there evidence for systematic upcoding of ASA physical status coincident with payer incentives? A regression discontinuity analysis of the national anesthesia clinical outcomes registry Anesth Analg Schonberger RB Dutton RP Dai F 24325012220162636096010.1213/ANE.0000000000000917 PMC 4684754 · doi ↗ · pubmed ↗
- 6Costs of inaccurate anesthesia start time documentation within a health system A A Pract Stone AB Dangerfield S Preiss DA Urman RD 015202110.1213/XAA.000000000000140433577169 · doi ↗ · pubmed ↗
- 7A randomized trial of automated electronic alerts demonstrating improved reimbursable anesthesia time documentation J Clin Anesth Freundlich RE Barnet CS Mathis MR Shanks AM Tremper KK Kheterpal S 1101142520132333378210.1016/j.jclinane.2012.06.020 · doi ↗ · pubmed ↗
- 8Anatomy of an anesthesia information management system Anesthesiol Clin Shah NJ Tremper KK Kheterpal S 3553652920112187139810.1016/j.anclin.2011.05.013 · doi ↗ · pubmed ↗