Human health risk assessment of metal-contaminated soils in Sydney estuary catchment (Australia)
Gavin Birch, Xiaoyu Wang, Enfeng Liu
TL;DR
This study assesses the health risks from metal-contaminated soils in Sydney, finding that lead from traffic poses the highest risk to children and adults.
Contribution
The study introduces a consistent methodology for evaluating metal-related health risks in urban soils and highlights overlooked pollutants.
Findings
Soil metal concentrations in Sydney are higher than in most global capitals, especially near the central business district.
Lead in soils is strongly linked to traffic density and historic petrol use, posing non-carcinogenic risks at 32% of sites for children.
Cadmium, nickel, and zinc pose no significant health risks, while copper and chromium may cause minor non-carcinogenic risks for children.
Abstract
Sydney estuary catchment supports the largest city in Australia and provides essential eco-social and environmental services; however, the region has been influenced by extensive anthropogenic modification. Soil metal concentrations in the catchment had been studied previously; however, the current investigation was designed to determine the risk posed by these contaminants to human health. Soil metal concentrations were higher than observed in most global capitals and increased substantially in the south and south-east of the catchment and close to the central business district. Road-side soils and road dust contained the highest concentration of metals in the catchment. Lead in catchment soils was closely related to traffic density and sourced from the historic use of Pb in petrol. A human health assessment indicated that soil Cd, Ni and Zn posed no non-carcinogenic risk (NCR), or…
Genes, proteins, chemicals, diseases, species, mutations and cell lines named across the full text — each resolved to its canonical identifier and authoritative record.
Click any figure to enlarge with its caption.
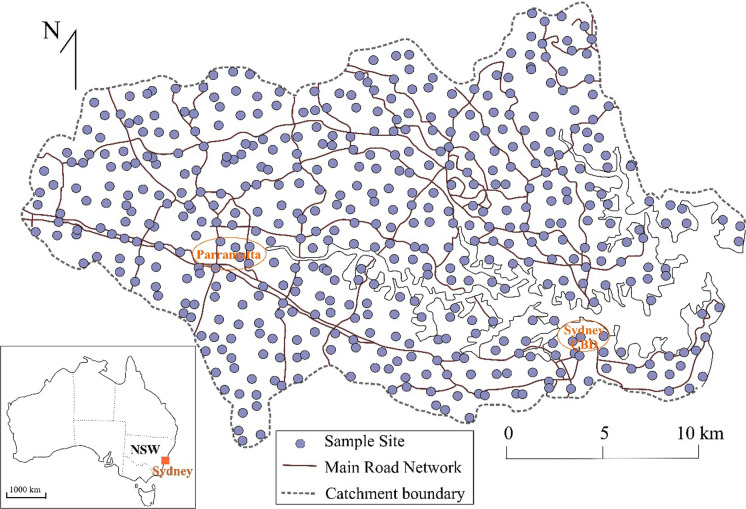 Figure 1
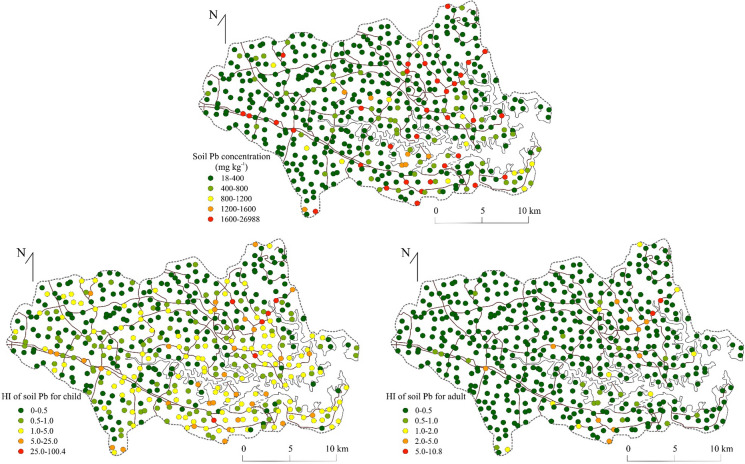 Figure 2
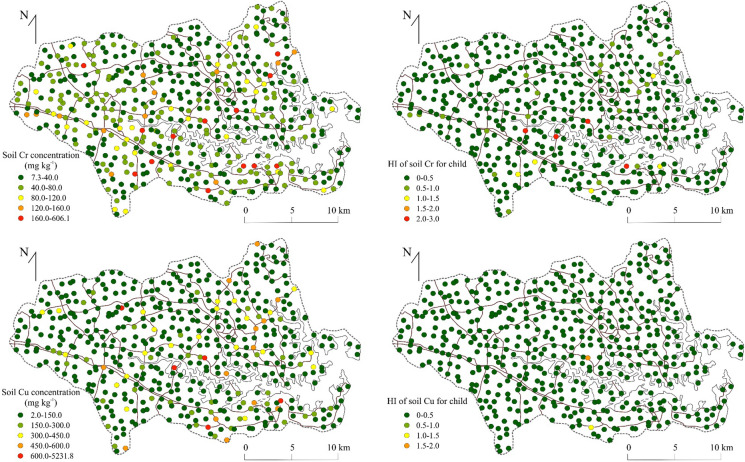 Figure 3
- —University of Sydney
Peer Reviews
No public reviews on file for this paper yet. If you reviewed it on a platform where reviews are public (OpenReview, ICLR, NeurIPS, ICML), you can paste yours below so the community can read it here.
Videos
No videos yet. Explain this paper in a talk, walkthrough, or lecture? Add one.
Taxonomy
TopicsGas Dynamics and Kinetic Theory · Laser-Plasma Interactions and Diagnostics · Combustion and Detonation Processes
Introduction
The Sydney estuary (50 km^2^) is a drowned, dendritic river valley 30 km long and 3 km wide in central New South Wales (NSW), Australia (Birch et al., 2021, 2022; Roy, 1983). The estuary is bound in the north by small sandy beaches and rocky headlands and large, shallow embayments lined by mangrove forests in the south (Liu, 1989). In the north Sydney estuary catchment is a high, eroded plateau and is low and undulating to the south (Birch & Lound, 2021, 2022). The small catchment (500 km^2^) is mostly developed (76.8%) and supports a high-density population (2000 people/km^2^) of 1.42 million (ABS, 2011; Johnson et al., 2017). The catchment is highly productive providing a large range of goods and services to the community (Birch et al., 2016a, b; Hoisington, 2015).
The distribution and concentration of metals in urban soils of Sydney estuary catchment have been established previously (Birch et al., 2011); however, the potential human carcinogenic risk (CR) and non-carcinogenic risk (NCR) to the urban population posed by soils have not been established. The highest soil metal concentrations were found in the oldest and most densely populated regions of the catchment and declined with distance from the central business district (CBD). The similarity in soil metal distribution and modelled deposition of atmospheric vehicular emissions (Lawrence, 2006) strongly suggested vehicular contributions were a major source of metals to catchment soils. The high concentrations and large range of metals in these soils may adversely impact human health, e.g. kidney, gastro-intestinal and nervous systems and reduce intelligence quotient by ingestion, inhalation and through skin contact (Young, 2005; Mazumdar, 2008; Cobbina et al., 2013; Zhang et al., 2012; NTP, 2012). The aims of the present study were to: (i) assess human CR and NCR posed by catchment soil; (ii) establish the major pathways of potential uptake; (iii) determine the relative risk to children and adults; (iv) and identify possible sources of metals in various land use types posing risk.
Previous studies of soil metals in Sydney estuary catchment
The first regional study of soil in the Sydney estuary catchment established that 50% of Cu, Pb and Zn concentrations and 2.5% of Cd concentrations were above Australian and New Zealand Environment and Conservation Council and National Health and Medical Research Council (ANZECC and NH&MRC, 1992) guidelines of 300 µg/g, 200 µg/g, 60 µg/g and 3 µg/g, respectively (Markus and McBratney, 2001) (Table 1). The distance from roads explained considerable variance in total Pb (24% of variance), Zn (15% of variance), Cu (15% of variance) and Cd (13% of variance). The greatest soil metal concentrations were in highly urbanised (> 90%) catchments and in these older urban areas near major road intersections, soil health guidelines were exceeded for Cu (34% of samples), Pb (33% of samples) and Zn (56% of samples) in areas where buildings were oldest and where major roads converged. (Snowdon & Birch, 2004). Metals in soil of other highly urbanised (48%) and industrialised (19%) sub-catchments exceeded Environmental Investigation Limits for Cu (for 8% of samples), Ni (3% of samples), Pb (5% of samples) and Zn (7% of samples). Linear mixed models determined that the main drivers of contamination in catchment soils were elevation, distance from main roads, road type, landscape, population density and land use (Johnson et al., 2017). Additional modelling indicated that had Pb diminished significantly and that As and Zn had substantially increased in some landfill sites (Pozza et al., 2019). Table 1. Total and size-normalised (< 62.5 µm) metal data for Sydney estuary catchment soilsRefCdCoCrCuNiPbZnSydney estuary catchment. Total1Mean0.46194613194187Median0.351423860108n = 491Rangebd-3.4bd-441–2651–1869Bd–1903–96534–1807Sydney estuary catchment. Fine1Mean1.1165012133559500Median0.913136021150259n = 491Rangebd–8.6bd–087–6062–5232bd–44018–698813–6156Sydney parkland soils. Total2Mean0.4414387161174n = 107Median0.4412266121133Range0.1–1.80.7–84–484–3981–226–103021–933Sydney parkland soils. Fine2Mean1.110369319388432n = 107Median1.010315616255284Range0.4–62–2911–19324–6146–8623–3520133–3060Iron cove catchment soils. Total3Mean0.85206212410343n = 374Median0.44164410205225Range1–240.5–243–2105–4202–656–920021–2400Iron cove catchment soils. Fine3Mean2.11556170341070927n = 374Median1.0114311327501558Rangebd–6615–699–77121–15005–25539–9573137–7430Glebe catchment soils. Total4Mean0.66NANA114NA854482n = 219Rangebd-14NANA2.3–4141NA10–027820–10254Homebush Bay catchment. Total5MeanNANA163315106155n = 185MedianNANA1423106791RangeNANA3–1034–4251–2024–649bd–5022Homebush Bay catchment. Fine5MeanNANA328131227281n = 185MedianNANA315521150241RangeNANA13–6016–14106–144523–130243–1460Sydney roadside soil Total n = 186MeanNA0.18366914764152Australian garden soil Total7Median2NA3531266171n = 17,256Range < 4–88NA < 2–7863 < 1–9157 < 4–657 < 3–2400 < 1–29,400NA Not available, fine ≤ 62.5 µm, n = number of samples; *bd * Below detection. References: 1. Birch et al., 2011; 2. Wang et al., 2022; 3. Snowdon & Birch, 2004; 4. Markus and McBratney, 1996; 5. Hodge, 2002; 6. Mohammed et al., 2012; 7. Taylor et al., 2021
An investigation of the whole Sydney estuary catchment (n = 491*)* showed soils in the south-eastern region contained the highest metal concentrations (Birch et al., 2011). Soil metal and road network distributions were closely related and results of vehicular emissions modelling, strongly suggested vehicular traffic was the major source of metals to catchment soils (Hodge, 2002; Lawrence, 2006). Soil metals in four Sydney estuary catchment urban parks were also closely related to traffic emissions and adversely affected soil quality and human health (Wang et al., 2022). A study of home gardens showed that Pb was the primary metal of concern and that 40% of the 203 gardens sampled contained soil that exceeded the soil Pb guideline for residential properties (NEPM, 1999) (Rouillon et al., 2017). The highest soil Pb concentrations close to the CBD declined to background levels within 30–40 km of the city centre (Rouillon et al., 2017). In a later nation-wide garden soil survey residential (HIL A; NEPC, 2013) guideline values were exceeded for Pb in 20% of soil samples, but only 4% of samples for Cr and 1% of samples for Cd (Taylor et al., 2021).
Investigations of the relationship between Pb in human blood and catchment soil (Mencel & Thorp, 1976; Garnys et al., 1979; Royal Prince Alfred Hospital and Central and Southern Sydney Area Health Service, 1988; Cooney et al., 1989; Fett et al., 1992; Skinner et al., 1993; Olszowy et al., 1995; Cowie et al., 1997; Markus and McBratney, 2001; Cattle et al., 2002; Gulson et al., 2014) have been comprehensively reviewed by Laidlaw et al. (2017).
Methods
Field methods
The metals data used in the current study were obtained from a previous survey based on samples taken where convenient in the dominant land use type in each one km^2^ gridded area of Sydney estuary catchment (Birch et al., 2011) (Fig. 1). Land uses were residential (45.9%), commercial/industrial (8.1%), road/rail (19.2%), educational/medical (3.4%) and parkland/reserves (23.2%) (Birch & Taylor, 2004; Birch et al., 2015a, b). Four sub-samples collected within 1 m^2^ were pooled to reduce small-scale spatial variability (Birch et al., 2001). Samples were sieved using a 2 mm plastic mesh on site to remove debris and organic fragments and were refrigerated at 4 °C until preparation for analysis.Fig. 1. Distribution of soil samples in Sydney estuary catchment (n = 491). One sample was taken in each 1 km^2^ in the dominant land use type in that square
Laboratory techniques
Textural variability and heterogeneity of soils was reduced by Post-Extraction Normalisation (PEN) Birch & Taylor, 2000) to identify sources and produce consistent spatial metal distributions (Birch, 2017). The veracity of the PEN method to produce high-quality normalised data was validated by comparison to grain-size (≤ 62.5 µm) and elemental (Fe and Al) normalisation techniques (Birch, 2003; Birch & Snowdon, 2004) and was confirmed by independent assessment (Clark et al., 2000).
In the original investigation (Birch et al., 2011) soils were digested using aqua regia (1:1 HNO_3_:HCl) (modified USEPA 200.8 Rev 4.4 method) and analysed by inductively coupled plasma atomic emission spectrometry (ICP-AES) for seven metals (Cd, Co, Cr, Cu, Ni, Pb and Zn).
QA/QC
Precision of the analytical method expressed as relative standard deviation (RSD) of replicates (n = 26) was < 6%. Accuracy, measured by recovery using a reference material (AGAL-10) (n = 28), was between 94 and 104% for all metals. Blanks (n = 30) used to measure potential laboratory contamination exhibited negligible metal concentrations.
Health risk assessment models
The average daily intake (ADI) of a chemical substance through each of three pathways (ingestion ADI_ing_, inhalation ADI_inh_ and dermal contact ADI_dermal_) was determined for children (aged < 2 years) using equations provided by the USEPA (2002) and Bourliva et al. (2018). The values of parameters are presented in Supplementary Table S1.
\documentclass[12pt]{minimal} \usepackage{amsmath} \usepackage{wasysym} \usepackage{amsfonts} \usepackage{amssymb} \usepackage{amsbsy} \usepackage{mathrsfs} \usepackage{upgreek} \setlength{\oddsidemargin}{-69pt} \begin{document}$${{\text{ADI}}}_{{\text{ing}}}={\text{C}}\times \frac{{{\text{R}}}_{{\text{ing}}}\times {\text{EF}}\times {\text{ED}}}{{\text{BW}}\times {\text{AT}}}\times {10}^{-6}$$\end{document} \documentclass[12pt]{minimal} \usepackage{amsmath} \usepackage{wasysym} \usepackage{amsfonts} \usepackage{amssymb} \usepackage{amsbsy} \usepackage{mathrsfs} \usepackage{upgreek} \setlength{\oddsidemargin}{-69pt} \begin{document}$${{\text{ADI}}}_{{\text{inh}}}={\text{C}}\times \frac{{{\text{R}}}_{{\text{inh}}}\times {\text{EF}}\times {\text{ED}}}{{\text{PEF}}\times {\text{BW}}\times {\text{AT}}}$$\end{document} \documentclass[12pt]{minimal} \usepackage{amsmath} \usepackage{wasysym} \usepackage{amsfonts} \usepackage{amssymb} \usepackage{amsbsy} \usepackage{mathrsfs} \usepackage{upgreek} \setlength{\oddsidemargin}{-69pt} \begin{document}$${{\text{ADI}}}_{{\text{dermal}}}={\text{C}}\times \frac{{\text{SA}}\times {\text{SAF}}\times {\text{ABS}}\times {\text{EF}}\times {\text{ED}}}{{\text{BW}}\times {\text{AT}}}\times {10}^{-6}$$\end{document}where R_ing_ = Dust intake rate; R_inh_ = Inhalation rate; EF = Exposure frequency; ED = Exposure duration; BW = Body weight; AT = Average time (year); PEF = Particle emission factor; SA = Exposure skin area; SAF = Skin adherence factor; and ABS = Dermal absorption factor.
The non-carcinogenic Hazard Quotient (HQ) of each exposure pathway and Hazard Index (HI) were calculated using:
\documentclass[12pt]{minimal} \usepackage{amsmath} \usepackage{wasysym} \usepackage{amsfonts} \usepackage{amssymb} \usepackage{amsbsy} \usepackage{mathrsfs} \usepackage{upgreek} \setlength{\oddsidemargin}{-69pt} \begin{document}$${HQ}_{i}=\frac{{ADI}_{i}}{{R}_{f}D}$$\end{document} \documentclass[12pt]{minimal} \usepackage{amsmath} \usepackage{wasysym} \usepackage{amsfonts} \usepackage{amssymb} \usepackage{amsbsy} \usepackage{mathrsfs} \usepackage{upgreek} \setlength{\oddsidemargin}{-69pt} \begin{document}$$HI=\sum {HQ}_{i}$$\end{document}HQi is the non-carcinogenic hazard quotient for each exposure pathway, RfD is the reference dose equaling the maximum dose to avoid an adverse reaction when adsorbed, i corresponds to the three pathways (Supplementary Material Table S1) and HI is the sum of HQs for the three exposure pathways. Non-carcinogenic risk occurs when HI > 1 and risk increases with the magnitude of HI (Doabi et al., 2018).
In the present study, carcinogenic risk (CR) was evaluated by the following equations:
\documentclass[12pt]{minimal} \usepackage{amsmath} \usepackage{wasysym} \usepackage{amsfonts} \usepackage{amssymb} \usepackage{amsbsy} \usepackage{mathrsfs} \usepackage{upgreek} \setlength{\oddsidemargin}{-69pt} \begin{document}$${CR}_{i}={ADI}_{i}\times SF$$\end{document} \documentclass[12pt]{minimal} \usepackage{amsmath} \usepackage{wasysym} \usepackage{amsfonts} \usepackage{amssymb} \usepackage{amsbsy} \usepackage{mathrsfs} \usepackage{upgreek} \setlength{\oddsidemargin}{-69pt} \begin{document}$${\text{CR}}=\sum {CR}_{i}$$\end{document}SF (dimensionless) is the carcinogenic slope factor (Supplementary Material Table S2). The acceptable, or tolerable risk for regulatory purposes is 10^−6^ to 10^−4^ to cover for the incremental risk of developing caner during a lifetime of exposure (Ferreira-Baptista et al., 2005).
Results and discussion
Total and fine fraction soil metal concentrations
Total soil metal concentrations exhibited considerable variation across the Sydney estuary catchment as was reflected in a wide range in minimum and maximum values for Cu, Pb and Zn. Median concentrations (minimum–maximum) for total Cu, Pb and Zn were 23 (1–1869) µg/g, 60 (3–9653) µg/g and 108 (4–1807) µg/g, respectively, and for normalised concentrations values were 60 (2–5232) µg/g, 150 (18–26,588) µg/g and 259 (13–6156) µg/g, respectively (Birch, et al., 2011) (Table 1). ANZECC/NH&MRC guidelines (ANZECC and NH&MRC, 1992) were exceeded in 17% of samples for Cu, 11% for Pb, and 5% for Zn. The Ecological Investigation Limits (EIL) National Environment Protection Council (2013) recommended values were exceeded in 9%, 6% and 25% of samples, respectively, while Cd, Co, Cr and Ni concentrations were below guidelines (Table 2).Table 2. Total and fine fraction soil metal concentrations and guideline values (µg/g)n = 491CdCoCrCuNiPbZnTotal sedimentMinimumbdbd11bd34Maximum3.444265186919096531807Mean0.4619461319418725 percentile0.2210145286250 percentile0.35142386010895 percentile1.1194413138723632ANZECC^1^3NA506060300200% Samples > ANZECC0.2NA31721125EIL^2^3NA40010060600200% Samples > EIL0.2NA092625Fine fraction (< 62.5 µm*)*Minimumbdbd72bd1813Maximum8.6108606523244026,9886156Mean1.116501213355950025 percentile0.682836147915950 percentile0.91337602115025995 percentile2.7381204089018301790NA Not available; bd Below detection^1^Environmental soil quality guidelines (ANZECC and NH&MRC, 1992)^2^Environmental investigation limits (National Environment Protection Council (2013)
Sydney catchment soil metal concentration in a global perspective
Metal concentrations in the Sydney estuary catchment soils were higher than reported in most global investigations, e.g. the Danang-Hoian region of Vietnam (Thuy et al., 2000), the city of Xuzhou, China, (Wang & Qin, 2007), Madrid, Spain (De Miguel et al., 1998) and many other global cities, including Seoul, Berlin, Oslo and Glasgow (Table 3). Sydney catchment soils also had substantially higher mean Cu, Pb, and Zn concentrations than average soils for Australia, the European Union and China (Caritat & Cooper, 2011a, b; 2016; Chen et al., 2015; Hu et al., 2020; Tóth et al., 2016) (Table 3).Table 3. Mean metal concentrations for Sydney estuary catchment soils and other global studies (µg/g)RefsCuPbZnSydney estuary catchment1121559500Fine fraction (< 62.5 µm; normalised)46194187Total (< 2 mm)6015025950th percentile, normalisedWollongong City area23432182Total (< 2 mm)Australian soil average3171138Total (< 2 mm)Australian continental crust3127.426Total (< 2 mm)Global studiesSeoul, South Korea484240271Total (< 2 mm)Danang-Hoian Area, Vietnam59084153Total (< 2 mm)Berlin Metropolitan Area64378159Total (< 2 mm)Great Britain754240260Total (< 2 mm)Oslo, Norway83256160 < 100 µm; sieveXuzhou, China93843144Total (< 500 μm)Madrid, Spain1072161210Total (< 2 mm)Glasgow, Scotland1197216207Total (< 2 mm)Average European Union soils121315naTotal (< 2 mm)Average Chinese soils13273179Total (< 2 mm)References: 1. Birch et al., 2011; 2. Beavington, 1973; 3. Caritat & Cooper, 2011a, b, 2016; 4. Chon et al., 1995; 5. Thuy et al., 2000; 6. Birke and Rauch, 1997; 7. Culbard et al., 1988; 8. Tijhuis et al., 2002; 9. Wang & Qin, 2007; 10. De Miguel et al., 1998; 11. Gibson and Farmer, 1985; 12. Tóth et al., 2016; 13. Chen et al., 2015
Sydney catchment soil metal concentrations and land use
The range of median soil metal concentrations for land use types in Sydney catchment from highest to lowest was: road verge–industrial–commercial–residential–special use–parkland (Table 4). Soil from road verges has frequently been identified with high metal concentrations (Bourliva et al., 2018; Siddiqui et al., 2020; Snowdon & Birch, 2004) with levels declining exponentially with distance from vehicular corridors (Birch & Scollen, 2003; Wang et al., 2022).Table 4. Normalised metal concentrations for land use typesResidentialParkland/open spaceRoad vergeIndustrialCommercialSpecial usen2169861404035CopperMinimum92328197Maximum33217856152324338131Mean72392732912495225th percentile382213464543050th percentile5832270901034495th percentile17088534551616102LeadMinimum291870433825Maximum556976826,98817951577547Mean298124280330425612625th percentile865740999936150th percentile1578310272171618295th percentile9252867900893567362ZincMinimum601371768939Maximum56791162615635562747927Mean364185137378064022825th percentile1728578527128512650th percentile238144118355349518295th percentile922404263023471974475Concentrations in µg/g; n = number of samples
A closer examination of NCR posed by Pb in soils from different land uses indicated that 87% of samples recovered from road verges exceeded the guideline for safe exposure (HI > 1) (Table 5). Similarly, 48% of industrial, 33% of residential, and 30% commercial samples exceeded safe Pb levels of exposure for children, but not for adults. In an alternative to using land use type to assess exposure, Garcia-Rico et al. (2016) identified specific areas in Mexico City with the most sensitive populations to exposure (density of children) to produce a ‘sector-based’ assessment called ‘marginality index maps’. In Sydney, Taylor et al., (2021) aggregated risk into ‘significant urban areas’ demarked by Statistical Area Level Boundaries so that risk data could be related to socio-economic indices.Table 5. Number and percentage of samples greater than unity (H > 1) for non-carcinogenic risk for Pb per land use typeResidentialParkland/open spaceRoad vergeIndustrialCommercialSpecial useNumber of samples20011661404035Number of samples greater than unity6555219123Percentage of samples greater than unity3348748309
Human health CR and NCR assessment
No soil samples exceeded an HI of unity for Cd, Ni, or Zn and these elements posed no NCR, or CR for children, or adults in Sydney estuary catchment (Table 6). By far the greatest human health risk raised by catchment soils was for Pb, which may pose NCR for children (HI > 1) at 156 sites (32% of samples) and at 21 locations (4.3% of samples) for adults (Fig. 2). Copper at only two sites (0.4% of samples) and Cr at nine locations (1.6% of samples) exceeded unity and may pose minor NCR for children (HI > 1) (Fig. 3). The HQ (individual pathways) and HI (combined pathways) of the remaining studied metals (Cd, Cu, Ni and Zn) were considerably lower than unity, i.e. mean HQ values were < 0.002 and for HI values were < 0.01 (Table 6). Slope factors were only available to calculate CR for Cd, Cr, Pb and Zn (Table 3). No samples exceeded a value of 10^–4^ for Cd indicating no CR and only two samples (0.5%) and one sample exceeded this value for Pb in children and adults, respectively, while only 9 (2%) and 4 (1%) samples exceeded this value for children and adults for Cr, respectively.Table 6. Carcinogenic and non-carcinogenic human health risk for mean and maximum concentrations of Cd, Cr, Cu, Ni, Pb and ZnNon-carcinogenic risk (NCR)MetalConcentration (µg/g)HQ ADIing (child)HQ ADIing (adult)HQ ADIinh (child)HQ ADIinh (adult)HQ ADIdermal (child)HQ ADIdermal (adult)HI childHI adultCdMean1.11.41E−021.51E−033.93E−072.21E−073.94E−036.01E−041.80E−022.11E−03Max8.61.10E−011.18E−023.08E−061.74E−063.09E−024.72E−031.41E−011.65E−02CrMean502.13E−012.28E−026.24E−043.52E−042.98E−024.55E−032.43E−012.77E−02Max6062.58E+002.77E−017.57E−034.27E−033.62E−015.52E−022.95E+003.36E−01CuMean1223.91E−024.19E−031.09E−066.13E−073.65E−045.58E−053.95E−024.25E−03Max52321.67E+001.79E−014.65E−052.62E−051.56E−022.38E−031.69E+001.82E−01NiMean332.11E−022.26E−035.72E−073.22E−072.19E−043.34E−052.13E−022.29E−03Max4402.81E−013.02E−027.63E−064.31E−062.92E−034.46E−042.84E−013.06E−02PbMean5792.12E+002.27E−015.88E−053.32E−053.95E−026.03E−032.16E+002.33E−01Max26,9889.86E+011.06E+012.74E−031.54E−031.84E+002.81E−011.00E+02**1.08E+01ZnMean5082.17E−022.32E−036.05E−073.41E−073.03E−044.63E−052.20E−022.37E−03Max61562.62E−012.81E−027.33E−064.13E−063.67E−035.61E−042.66E−012.87E−02Carcinogenic risk (CR)MetalConcentration (µg/g)CRing (child)CRing (adult)CRinh (child)CRinh (adult)CRdermal (child)CRdermal (adult)CR childCR adultCdMean1.17.40E−063.17E−062.13E−104.81E−102.07E−081.26E−087.42E−063.18E−06Max8.65.77E−052.47E−051.67E−093.76E−091.62E−079.87E−085.79E−052.48E−05CrMean502.74E−051.18E−056.42E−081.45E−073.07E−061.87E−063.06E−051.38E−05Max6063.33E−041.43E−047.79E−071.76E−063.72E−052.27E−053.71E−04****1.67E−04CuMean122NANANANANANANANAMax5232NANANANANANANANANiMean33NANA8.49E−101.92E−09NANA8.49E−101.92E−09Max440NANA1.13E−082.55E−08NANA1.13E−082.55E−08PbMean5795.21E−062.23E−067.19E−101.62E−092.92E−081.78E−085.24E−062.25E−06Max26,9882.51E−041.08E−043.47E−087.83E−081.41E−068.60E−072.53E−04****1.09E−04ZnMean508NANANANANANANANAMax6156NANANANANANANANAHQ Hazard quotient; ADI Average daily intake; ing Ingestion; inh Inhalation; HI Hazard indexNA Not available; Italics indicates HI > 1; Bold indicates CR > 10^–4^Fig. 2. The Pb concentration in catchment soils and the corresponding non-carcinogenic human health risk (HI) for adults and childrenFig. 3The concentration of Cr and Cu in catchment soils and the corresponding non-carcinogenic human health risk (HI) for children
NCR was more prevalent than CR in most global studies. In China, although CR and NCR was low for soils in most areas (Wang et al., 2019), Hu et al. (2020) identified a potential CR and NCR threat for children in some provinces, but not for adults. Human activities considerably contributed toxic elements to agricultural soils in the Frydek Mistek district of Czech Republic and some CR hotspots were recommended for immediate remediation (Agyeman et al., 2021). CR was only evident for Cr in urban dust in commercial land use areas in Tehran (Mihankhan et al., 2020), while in Mexico City Pb in road dust posed a NCR and As and Cr presented a CR (Garcia-Rico et al., 2016). NCR was highest for Cr and Pb in road dust from Thessaloniki city, Greece, while CR was not a threat for Cd, Cr, or Ni (Bourliva et al., 2018).
Exposure for adults and children
In the current study, NCR and CR were consistently more likely for children than for adults, which was typical for other countries, e.g. in China (Chen et al., 2015; Hou et al., 2019; Hu et al., 2020) and Delhi (Roy et al., 2019; Siddiqui et al., 2020). Approximately 6.1% of the Frydek Mistek district of Czech Republic posed a potential NCR to children rather than to adults and 13.05% of the sampled locations were carcinogenic to children (Agyeman et al., 2921). Children were also more at risk of carcinogenic disease in Thessaloniki city, Greece (Bourliva et al., 2018) and in Angola Ferreita-Baptista and De Miguel (2005). The combined Hazard Index (HI) for children through different routes of exposure was 8.9 times greater than for adults in Karachi city and CR from Pb due to oral ingestion of soil exceeded a value of 1 × 10^−6^ in some areas of the city for children (Karim & Qureshi, 2014). Children are more suseptable to CR and NCR due to oral hand and finger activities with exposure through ingestion.
Metals associated with human health risk
In the current investigation, six metals (Cd, Cr, Cu, Ni, Pb and Zn) were assessed for CR and NCR; however, only Cr and Pb posed minor CR, and NCR was only prevalent for Pb with Cr and Cu raising minor NCR risk. Soil metals assessed for human health risk in global studies were highly variable and included As, Cd, Co, Cr, Cu, Fe, Hg, Mn, Ni, Pb and Zn. However, only a small number of these elements have been proved to pose a health risk and these varied greatly between investigations. In China, Cd and Hg were most likely to pose NCR (Hu et al., 2020) with As, Pb, Cr and Ni exerting a lower risk (Chen et al., 2015). Metals in urban soils in Shenyang City (NE China) posed low health risk, while As showed the highest CR and Cr and Pb raised a significant NCR (Wang et al., 2019). Chrome also had a strong CR risk for adults through inhalation in soil from potato-producing areas in Guizhou Province, China.
Studies of road dust, a common secondary source of metals to road-side soils, also revealed variable metals associated with a health risk. A nation-wide study (n = 3877) of road dust in China, found Pb posed the highest health risk (Hou et al., 2019), while road dust from areas not affected by exhaust traffic emissions (trunk roads) were within safe limits for all assessed metals (Liu et al., 2014). Chromium and Pb in road dust from Thessaloniki city, Greece were rated with the highest NCR (Bourliva et al., 2018), whereas Co, Cu, Fe, Mn, and Zn were safe in road dust and soils in Delhi (Roy et al., 2019), but not for Ni, which may pose a CR in urban areas (Siddiqui et al., 2020).
Exposure pathways for NCR and CR
In the present study, the main exposure pathway driving NCR for all metals was ingestion, which accounted for most of the risk (> 95%), while dermal (< 5%) and inhalation (< 1%) were of minor risk. Uptake for CR was almost equally distributed between the three exposure pathways and exposure was considerably greater (approximately 10 times for all metals) for children than adults for all metals analysed.
Ingestion was the most important pathway in most global studies with either dermal, or inhalation pathways being next important, e.g. in NE China (Hou et al., 2019; Wang et al., 2019). Ingestion was also the main risk for NCR for children in Mexico City (Garcia-Rico et al., 2016) and CR was high for all possible pathways in Delhi, especially for Ni in roadside soils and road dust (Siddiqui et al., 2020). The importance of pathways ranked ingestion > dermal > inhalation in road dust from 10 districts in Thessaloniki city, Greece (Bourliva et al., 2018). Although ingestion was most prevelent pathway noted in the literature, soil Cr and As from potato-producing areas in Guizhou Province, China, were predicted to produce CR through dermal contact.
Source of soil metals posing a human health risk
A detailed study of soil in four recreational parks in Sydney showed Cu, Pb and Zn were related to traffic emissions and traffic volumes (Wang et al., 2022). Metal concentrations in park soils were highly elevated and concentrations decreased exponentially with distance from arterial roads. Traffic emission accounted for 72–84% of metal contamination in soils of parks surrounded by high traffic volumes, whereas emission values were 25–70% for park soil with no surrounding arterial road network. Copper and Zn in soils of the four parks contributed no NCR for children, or adults and Pb had negligible health risk for adults, however Pb in soil in parks near arterial roads, may raise NCR for children due to traffic emissions (Wang et al., 2022).
Roadside soil and street dust are frequently identified as media associated with high metal concentrations (Birch & Scollen, 2003; Ferreita-Baptista and De Miguel, 2005; Birch et al., 2011; Bourliva et al., 2018; Mihankhan et al., 2020). An early study reported 40% of the total 17,000 t of particulates emitted to the Sydney atmosphere annually were from motor vehicles (Forrest, 1991) and an atmospheric deposition model of vehicular emissions showed a close relationship between road density and atmospheric metal concentration for the catchment (Lawrence, 2006). Atmospheric deposition of pollutants in metropolitan Sydney accounted for approximately 50% of the total Cu, Pb and Zn deposition in the vicinity of minor roads (Davis & Birch, 2011). Leaded petrol emitted approximately 68,000 t of Pb into the atmosphere in New South Wales (NSW) between 1958 and 2002 (Kristensen, 2015) and leaded gasoline contributed approximately 90% of Pb to Sydney air between 1980 and 2001 (Chiaradia et al., 1997).
A detailed study of road surfaces in Sydney showed the mass of material accumulating on roads was substantial and closely related to vehicle density (Birch & Scollen, 2003). Road-derived material is highly resuspendable with 34%, 43% and 33% of the Cu, Pb and Zn being in the < 63 µm fraction and 90%, 91% and 89% being < 200 µm, respectively. This observation is similar to results obtained from a London street where 62% of total Pb and similar proportions of Cu and Zn were associated with the 100–500 µm fraction (Ellis & Revitt, 1982; Revitt et al., 1990). The fine-grained nature of this material renders it susceptible to resuspension and uptake by inhalation and ingestion increasing CR and NCR, High-density sampling showed consistently elevated Cu, Pb and Zn concentrations for roadside soils and road dust across Sydney catchment (Hodge, 2002; Snowden and Birch, 2004; Birch & McCready, 2009; Birch, 2011) and of the 138 road-related samples available, 38% posed a NCR by Pb for children.
Global investigations of road-derived materials also revealed variable metals associated with a health risk. A nation-wide study (n = 3877) of road dust in China, showed Pb posed the highest health risk and was the only metal with an HQ > 1 (Hou et al., 2019). The source of the Pb was mainly traffic and industrial activities (Hou et al., 2019). In Thessaloniki city, Greece, Cr and Pb rated the highest NCR in road dust (Bourliva et al., 2018), whereas in Mexico City, street dust posed the highest health risk for all metals (Garcia-Rico et al., 2016).
These studies emphasise the considerable influence traffic emissions have on metal concentrations of urban soil, which can confidently be predicted to have implications for human health (Wang et al., 2022).
Limitations of CR and NCR assessments and recommendations
Biometric exposure parameters for different populations vary greatly by race, region and habitat and existing parameters, e.g. weight, height and breathing volumes/adsorption rate may not represent exposure for the community being assessed (Ferreita-Baptista and De Miguel, 2005; Hou et al., 2019). Soil screening guides (US EPA, 1996a, b) and exposure models (US EPA, 2002) are two decades old and may require revision to service a wider population. Metals and organic pollutants in urban soil for which data are unavailable may affect human health, but are not considered in assessments and therefore risk may well be higher than typically calculated (Drage et al., 2015).
Fine-grain sizes are commonly used in soil health assessments on the assumption that smaller particles have greater adsorption, resuspension and aeolian transport potential. However, the size of the material being analysed for metals is also critical in determining element concentrations (Forstner, 1982; Forstner & Wittmann, 1979). For example, the concentrations of metals in > 200 µm road-side material from Sydney catchment were 87 µg Cu/g, 202 µg Pb/g and 259 µg Zn/g, respectively, compared to 187 µg Cu/g, 723 µg Pb/g and 1240 µg Zn/g for the < 62.5 µm fraction (Birch & Scollen, 2003). The size of material being used for human health assessment globally varies substantially, e. g. the size of material analysed from playgrounds, roofs and roads in Mexico City was < 44 µm (Garcia-Rico et al., 2016) and < 63 µm-sized particles were analysed in Delhi for soils and road dust (Siddiqui et al., 2020). Bourliva et al. (2018) analysed 500 µm material in Thessaloniki city, Greece and street dust between 63 and 500 µm was analysed in an assessment of human health risk in dust from 53 cities (n = 3877) across China (Hou et al., 2019). Soil was simply ‘sieved’ in China (Chen et al. 2016), while Wang et al., (2019) sieved urban topsoil at 2 mm in Shenyangn City, China. Ferreita-Baptista and De Miguel (2005) quoted analysed material sizes between 2000 and 63 µm for 15 studies, including one investigation using < 595 µm-sized particles. Not only will analyses of these materials produce highly varied metal concentrations due to particle size alone, different sized particles will have varied transport and adsorption potential and will produce incomparable results.
Sedimentary metals are present in the mineral matrix and as the absorbed phase of fine-grained particles (Ackermann et al., 1983; Forstner, 1982). Only chemicals available through the three exposure pathways should be included in analysis of soils and road-derived material used for human health studies. Metals incorporated tightly within the mineral matrix, some of which are present in high concentrations, should be excluded from the assessment. Analytical methods that assess both the matrix and absorbed phases will confound interpretation of human health risk and thus the digestion method used to analyse metals in soils is of fundamental importance in assessment of NCR and CR (Birch et al., 2020). Strong acid digestions, e.g. HF break down minerals and release both matrix and adsorbed components resulting in a 4- to ninefold elevation of metal concentrations compared to weaker acids (e.g. frequently used aqua regia), whereas more diluted acid solutions recover < 60% of metals relative to aqua regia (Katz & Kaplan, 1981). Digestion procedures used in assessment of human health reported in the literature were highly varied and included a large number of acids from weak to strong, e.g. HNO_3_; HCl + HNO_3_; HNO_3_ + HClO_4_; HNO_3_ + HClO_4_ + HF; HF + HClO_4_. This large range of acids used in digestion will result in a mixed proportion of matrix and adsorbed metals being analysed, resulting in highly varied risk profiles and reduced comparability between studies.
The use of inconsistent soil size, metal species and digestion techniques will result in incomparable CR and NCR assessment. The < 63 µm fraction is easily fractionated from the total soil, is readily resuspendable, has high adsorption potential, is the most frequently used size in environmental procedures and should be considered as the routine size fraction for human health risk assessment. Acids and acid mixtures, which remove only the adsorbed phase, should be used for digesting soils for CR and NCR assessment, e.g., HCl and HCl:HNO_3_.
Conclusions
Soil metal concentrations in Sydney estuary catchment were generally higher than observed in most global capital cities and soil guidelines were exceeded for Cu, Pb and Zn. The greatest concentration of metals in the catchment was for gully pots and road dust and roadside soil metals decreased exponentially with distance from vehicular corridors. This evidence strongly suggested that the source of metals was related to traffic density and historical use of Pb additives in petrol.
Soil Cd, Ni and Zn posed no NCR, or CR for children, or adults in Sydney estuary catchment, while Cu and Cr may pose minor NCR for children. The greatest human health risk raised by catchment soils was from Pb, which may pose NCR for children and adults. For CR and NCR determinations to be comparable, chemical and physical techniques used in assessment need to be consistent and standardised.
Supplementary Information
Below is the link to the electronic supplementary material.Supplementary file1 (DOCX 19 kb)
The reference list from the paper itself. Each links out to its DOI / PubMed record.
- 1ABS. (2011). Australian population grid, Australian Bureau of statistics, (ABS) www.abs.gov.au
- 2Ackermann F Bergmann M Schleichert U Monitoring heavy metals in coastal and estuarine sediments- a question of grain size <20 µm versus 60 µm Environmental Technical Letters 1983431732810.1080/09593338309384212 · doi ↗
- 3Agyeman PC Kingsley J Ndiye MK LubošB Radim V Ondřej D Karel N Human health risk exposure and ecological risk assessment of potentially toxic element pollution in agricultural soils in the district of Frydek Mistek, Czech Republic: A sample location approach Environmental Sciences Europe 20213313710.1186/s 12302-021-00577-w · doi ↗
- 4ANZECC & NH&MRC. (1992). Australian and New Zealand Guidelines for the Assessment and Management of Contaminated Sites. Canberra: Australia and New Zealand Environment and Conservation Council and National Health and Medical Research Council
- 5Beavington F Contamination of soil with zinc, copper, lead, and cadmium in the Wollongong city area Australian Journal of Soil Research 197311273110.1071/SR 9730027 · doi ↗
- 6Birch GFA test of normalisation methods for marine sediments, including a new post-extraction normalisation (PEN) technique Hydrobiologia 200349251310.1023/A:1024844629087 · doi ↗
- 7Birch GF Assessment of human-induced change and biological risk posed by contaminants in estuarine/harbour sediments: Sydney Harbour/estuary (Australia)Marine Pollution Bulletin 201711623424810.1016/j.scitotenv.2016.12.02828088369 · doi ↗ · pubmed ↗
- 8Birch GF Gunns T Chapman D Harrison D Development of an estuarine assessment scheme for the management of a highly urbanised catchment/estuary system, Sydney estuary, Australia Environmental Monitoring and Assessment 201618829410.1007/s 10661-016-5272-927085716 · doi ↗ · pubmed ↗