Association between childhood maltreatment and adult cortisol concentrations mediated through subjective health complaints
Johanna Klinger-König, Anke Hannemann, Nele Friedrich, Matthias Nauck, Henry Völzke, Hans J. Grabe

TL;DR
Childhood maltreatment is linked to lower adult cortisol levels, partly explained by health complaints and depressive symptoms.
Contribution
This study identifies subjective health complaints and depressive symptoms as key mediators linking childhood maltreatment to adult cortisol levels.
Findings
Childhood maltreatment's effect on cortisol is partially mediated by depressive symptoms and somatic complaints.
Combined mediation models show significant overlap between health complaints and depressive symptoms as mediators.
Health risk behaviors and physical measures did not mediate the relationship between maltreatment and cortisol.
Abstract
Lower cortisol concentrations in adulthood were repeatedly associated with more severe childhood maltreatment. Additionally, childhood maltreatment was reported to promote health risk behavior, such as smoking or alcohol consumption, and to increase the risk of mental and somatic diseases during adulthood, such as major depressive disorders or obesity. The present study investigated if health risk behavior and disease symptoms in adults mediate the associations between past childhood maltreatment and present basal serum cortisol concentrations. Data from two independent adult cohorts of the general population-based Study of Health in Pomerania (SHIP-TREND-0: N = 3,517; SHIP-START-2: N = 1,640) was used. Childhood maltreatment was assessed via the Childhood Trauma Questionnaire (CTQ). Cortisol concentrations were measured in single-point serum samples. Health risk behavior and mental…
Genes, proteins, chemicals, diseases, species, mutations and cell lines named across the full text — each resolved to its canonical identifier and authoritative record.
Click any figure to enlarge with its caption.
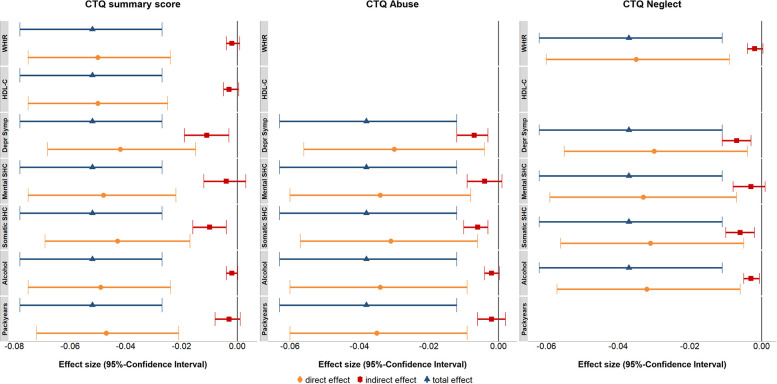 Figure 1
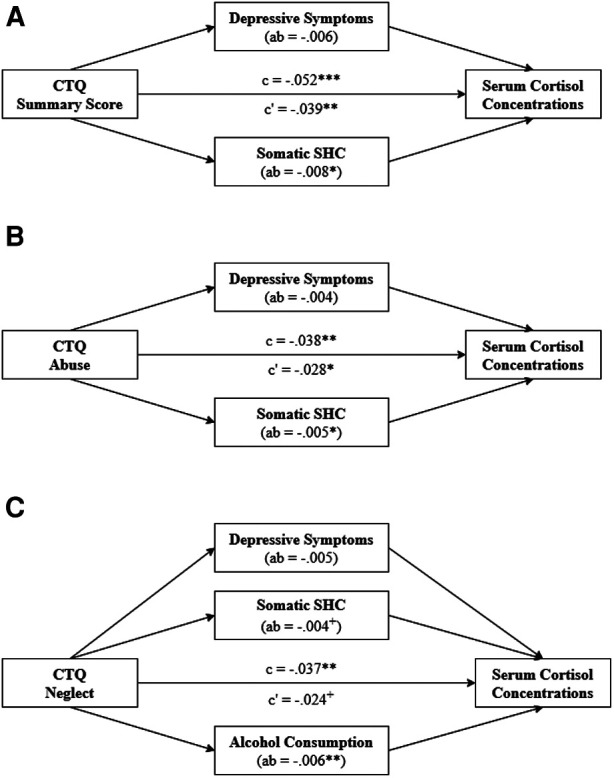 Figure 2
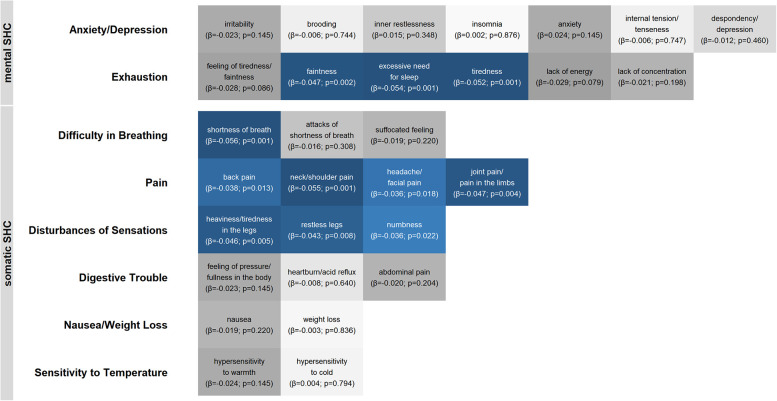 Figure 3
| SHIP-TREND-0 | SHIP-START-2 | ||||
|---|---|---|---|---|---|
|
| M (SD) |
| M (SD) | ||
| COVARIATES | |||||
| Age (Years) | 3,517 | 52.86 (14.76) | 1,640 | 58.00 (13.05) | 1.31e−27 |
| Sex (% Female) | 3,517 | 46.83 | 1,640 | 48.90 | 0.169 |
| Fasting time (%) | 3,517 | 1,640 | 1.55e−29 | ||
| <10:00 | 41.03 | 94.39 | |||
| 10:00–12:00 | 16.38 | 1.22 | |||
| >12:00 | 42.59 | 4.39 | |||
| Time of Blood Sampling (h:min) | 3,517 | 9:14 (1:04) | 1,640 | 9:33 (1:01) | 3.08e−31 |
| HbA1c (%) | 3,517 | 5.38 (0.74) | 1,640 | 5.51 (0.77) | 1.20e−11 |
| WBC (Gpt/l) | 3,517 | 6.02 (1.69) | 1,640 | 6.02 (1.66) | 0.831 |
| OUTCOME AND PREDICTORS | |||||
| Cortisol (nmol/l) | 3,517 | 322.66 (116.08) | 1,640 | 302.14 (110.83) | 3.43e−10 |
| CTQ Summary Score | 3,517 | 33.51 (9.66) | 1,640 | 34.08 (9.82) | 0.002 |
| CTQ Abuse (% Yes) | 3,517 | 7.08 | 1,640 | 8.90 | 0.024 |
| CTQ Neglect (% Yes) | 3,517 | 12.45 | 1,640 | 13.60 | 0.264 |
| MEDIATORS | |||||
| Systolic BP (mmHG) | 3,507 | 128.26 (1.19) | 1,635 | 133.00 (1.40) | <2.23e−31 |
| Hypertension (% Yes) | 3,511 | 41.04 | 1,639 | 49.60 | 9.83e−09 |
| WHtR | 3,505 | 0.54 (0.08) | 1,637 | 0.55 (0.08) | 8.62e−05 |
| Obesity (% Yes) | 3,512 | 32.06 | 1,638 | 32.84 | 0.587 |
| Triglycerides (mmol/l) | 3,501 | 1.63 (0.98) | 1,631 | 1.86 (1.12) | 7.63e−15 |
| HDL-C (mmol/l) | 3,517 | 1.41 (0.37) | 1,639 | 1.41 (0.37) | 0.465 |
| Depressive Symptoms | 3,472 | 3.87 (3.58) | 1,640 | 6.18 (7.13) | 6.75e−12 |
| Mental SHC | 3,387 | 23.05 (7.50) | 1,574 | 23.03 (7.53) | 0.900 |
| Somatic SHC | 3,375 | 27.77 (7.09) | 1,572 | 27.94 (7.31) | 0.572 |
| Alcohol Consumption (g/d) | 3,483 | 8.95 (13.82) | 1,530 | 10.55 (14.37) | 1.73e−09 |
| Risky Alcohol Consumption (% Yes) | 3,483 | 7.72 | 1,530 | 10.78 | 4.76e−04 |
| Pack Years | 1,568 | 20.05 (16.67) | 751 | 26.06 (64.05) | 5.05e−04 |
| Ever-smoker (% Yes) | 3,504 | 63.27 | 1,636 | 61.61 | 0.252 |
| CTQ Summary Score | CTQ Abuse | CTQ Neglect | |||||||||||||
|---|---|---|---|---|---|---|---|---|---|---|---|---|---|---|---|
| T0 | S2 | Meta-analysis | T0 | S2 | Meta-analysis | T0 | S2 | Meta-analysis | |||||||
|
| SE |
|
| SE |
|
| SE |
| |||||||
| Systolic BP | 3,507 | 1,635 | 0.034 | 0.028 | 0.217 | 3,507 | 1,635 | −0.043 | 0.034 | 0.261 | 3,507 | 1,635 | 0.129 | 0.096 | 0.201 |
| Hypertension | 3,511 | 1,639 | 1.028 | 0.742 | 0.180 | 3,511 | 1,639 | 1.071 | 0.846 | 0.261 | 3,511 | 1,639 | 1.073 | 0.816 | 0.201 |
| WHtR | 3,505 | 1,637 | 0.035 | 0.013 | 0.022 | 3,505 | 1,637 | 0.073 | 0.052 | 0.256 | 3,505 | 1,637 | 0.094 | 0.040 | 0.045 |
| Obesity (Yes) | 3,512 | 1,638 | 1.056 | 0.740 | 0.180 | 3,512 | 1,638 | 1.178 | 0.833 | 0.256 | 3,512 | 1,638 | 1.272 | 0.805 | 0.165 |
| Triglycerides | 3,501 | 1,631 | 0.028 | 0.013 | 0.063 | 3,501 | 1,631 | 0.026 | 0.050 | 0.605 | 3,501 | 1,631 | 0.057 | 0.041 | 0.201 |
| HDL-C | 3,517 | 1,639 | −0.030 | 0.013 | 0.038 | 3,517 | 1,639 | −0.036 | 0.048 | 0.491 | 3,517 | 1,639 | −0.079 | 0.038 | 0.081 |
| Depressive Symptoms | 3,472 | 1,640 | 0.260 | 0.013 | 2.51e−87 | 3,472 | 1,640 | 0.611 | 0.051 | 4.37e−32 | 3,472 | 1,640 | 0.437 | 0.042 | 1.50e−24 |
| Mental SHC | 3,387 | 1,574 | 0.254 | 0.016 | 5.45e−57 | 3,387 | 1,574 | 0.650 | 0.064 | 8.69e−24 | 3,387 | 1,574 | 0.439 | 0.048 | 3.82e−19 |
| Somatic SHC | 3,375 | 1,572 | 0.191 | 0.015 | 1.01e−35 | 3,375 | 1,572 | 0.432 | 0.058 | 5.51e−13 | 3,375 | 1,572 | 0.329 | 0.046 | 4.98e−12 |
| Alcohol Consumption | 3,483 | 1,530 | −0.037 | 0.013 | 0.015 | 3,483 | 1,530 | −0.125 | 0.051 | 0.037 | 3,483 | 1,530 | −0.153 | 0.041 | 5.91e−04 |
| Risky Alcohol Consumption (Yes) | 3,483 | 1,530 | 1.103 | 0.761 | 0.180 | 3,483 | 1,530 | 1.153 | 0.941 | 0.261 | 3,483 | 1,530 | 1.125 | 0.879 | 0.201 |
| Pack Years | 1,568 | 751 | 0.080 | 0.018 | 1.99e−05 | 1,568 | 751 | 0.195 | 0.067 | 0.012 | 1,568 | 751 | 0.112 | 0.056 | 0.087 |
| Ever-smoker (Yes) | 3,504 | 1,636 | 1.204 | 0.740 | 0.150 | 3,504 | 1,636 | 1.690 | 0.843 | 0.097 | 3,504 | 1,636 | 1.498 | 0.811 | 0.105 |
| T0 | S2 | Meta-analysis | |||
|---|---|---|---|---|---|
|
|
| SE |
| ||
|
| |||||
| CTQ Summary Score | 3,517 | 1,640 | −0.052 | 0.012 | 7.25e−05 |
| CTQ Abuse | 3,517 | 1,640 | −0.140 | 0.046 | 0.003 |
| CTQ Neglect | 3,517 | 1,640 | −0.111 | 0.037 | 0.003 |
|
| |||||
| Systolic BP | 3,507 | 1,635 | −0.002 | 0.004 | 0.509 |
| Hypertension | 3,511 | 1,639 | 0.103 | 0.031 | 0.001 |
| WHtR | 3,505 | 1,637 | −0.087 | 0.016 | 8.95e−08 |
| Obesity | 3,512 | 1,638 | −0.180 | 0.029 | 5.66e−09 |
| Triglycerides | 3,501 | 1,631 | 0.061 | 0.015 | 8.69e−05 |
| HDL-C | 3,517 | 1,639 | 0.108 | 0.015 | 4.02e−12 |
| Depressive Symptoms | 3,472 | 1,640 | −0.051 | 0.013 | 2.56e−04 |
| Mental SHC | 3,387 | 1,574 | −0.028 | 0.014 | 0.044 |
| Somatic SHC | 3,375 | 1,572 | −0.059 | 0.014 | 8.69e−05 |
| Alcohol Consumption | 3,483 | 1,530 | 0.089 | 0.015 | 1.23e−08 |
| Risky Alcohol Consumption | 3,483 | 1,530 | 0.273 | 0.049 | 1.01e−07 |
| Pack Years | 1,568 | 751 | −0.066 | 0.022 | 0.003 |
| Ever-smoker | 3,504 | 1,636 | −0.108 | 0.028 | 2.06e−04 |
| Total Effect | Direct Effect | Indirect Effect | ||||||||
|---|---|---|---|---|---|---|---|---|---|---|
|
| SE |
| SE |
|
| SE |
| Proportion Mediated | ||
| CTQ Summary Score | −0.052 | 0.013 | 5.70e−05 | |||||||
| WHtR | −0.050 | 0.013 | 3.11e−04 | −0.002 | 0.001 | 0.229 | 3.14 | |||
| HDL-C | −0.050 | 0.013 | 3.11e−04 | −0.003 | 0.002 | 0.171 | 4.79 | |||
| Depressive Symptoms | −0.042 | 0.013 | 0.002 | −0.011 | 0.004 | 0.019 | 21.04 | |||
| Mental SHC | −0.048 | 0.013 | 4.58e−04 | −0.004 | 0.004 | 0.281 | 7.84 | |||
| Somatic SHC | −0.043 | 0.013 | 0.001 | −0.010 | 0.003 | 0.007 | 19.24 | |||
| Alcohol Consumption | −0.049 | 0.013 | 3.11e−04 | −0.002 | 0.001 | 0.146 | 4.04 | |||
| Pack Years | −0.047 | 0.013 | 4.58e−04 | −0.003 | 0.002 | 0.225 | 5.99 | |||
| CTQ Abuse | −0.038 | 0.013 | 0.004 | |||||||
| Depressive Symptoms | −0.030 | 0.013 | 0.023 | −0.007 | 0.002 | 0.004 | 19.72 | |||
| Mental SHC | −0.034 | 0.013 | 0.018 | −0.004 | 0.003 | 0.146 | 10.71 | |||
| Somatic SHC | −0.031 | 0.013 | 0.021 | −0.006 | 0.002 | 0.004 | 17.22 | |||
| Alcohol Consumption | −0.034 | 0.013 | 0.018 | −0.002 | 0.001 | 0.146 | 5.00 | |||
| Pack Years | −0.035 | 0.013 | 0.018 | −0.002 | 0.002 | 0.322 | 5.24 | |||
| CTQ Neglect | −0.037 | 0.013 | 0.005 | |||||||
| WHtR | −0.035 | 0.013 | 0.023 | −0.002 | 0.001 | 0.118 | 5.54 | |||
| Depressive Symptoms | −0.030 | 0.013 | 0.023 | −0.007 | 0.002 | 0.005 | 19.07 | |||
| Mental SHC | −0.033 | 0.013 | 0.023 | −0.003 | 0.002 | 0.126 | 9.05 | |||
| Somatic SHC | −0.031 | 0.013 | 0.023 | −0.006 | 0.002 | 0.005 | 16.87 | |||
| Alcohol Consumption | −0.032 | 0.013 | 0.023 | −0.003 | 0.001 | 0.023 | 8.29 | |||
| Total Effect | Direct Effect | Indirect Effect | ||||||||
|---|---|---|---|---|---|---|---|---|---|---|
|
| SE |
| SE |
| SE | Proportion Mediated | ||||
| CTQ Summary Score | −0.052 | 0.013 | 5.70e−05 | −0.039 | 0.013 | 0.004 | −0.014 | 0.004 | 0.002 | 27.68 |
| Depressive Symptoms | −0.006 | 0.004 | 0.146 | 11.91 | ||||||
| Somatic SHC | −0.008 | 0.003 | 0.018 | 15.46 | ||||||
| CTQ Abuse | −0.038 | 0.013 | 0.004 | −0.028 | 0.013 | 0.033 | −0.009 | 0.003 | 7.77e−04 | 25.27 |
| Depressive Symptoms | −0.004 | 0.003 | 0.107 | 11.00 | ||||||
| Somatic SHC | −0.005 | 0.002 | 0.021 | 13.48 | ||||||
| CTQ Neglect | −0.037 | 0.013 | 0.005 | −0.024 | 0.013 | 0.067 | −0.013 | 0.002 | 7.53e−08 | 35.47 |
| Depressive Symptoms | −0.005 | 0.003 | 0.100 | 13.48 | ||||||
| Somatic SHC | −0.004 | 0.002 | 0.088 | 12.02 | ||||||
| Alcohol Consumption | −0.006 | 0.002 | 0.005 | 16.43 | ||||||
- —Community Medicine Research net of the University of Greifswald
- —Federal Ministry of Education and Research10.13039/501100002347
- —Ministry of Cultural Affairs
Peer Reviews
No public reviews on file for this paper yet. If you reviewed it on a platform where reviews are public (OpenReview, ICLR, NeurIPS, ICML), you can paste yours below so the community can read it here.
Videos
No videos yet. Explain this paper in a talk, walkthrough, or lecture? Add one.
Taxonomy
TopicsChild Abuse and Trauma · Stress Responses and Cortisol · Child and Adolescent Psychosocial and Emotional Development
Introduction
The World Health Organization (WHO) describes childhood maltreatment (CM) as the “abuse and neglect of children” (1). About 30% of the German adult population report CM (2, 3). Based on data from women enrolled in a US health maintenance organization, Walker et al. (4) reported a CM prevalence of 43%. These women reporting any CM also reported a worse subjective health status, more symptoms of somatic disorders or mental diseases as well as more health risk behaviors (4). As health risk factors, health risk behaviors subsume behavioral patterns or habits that increase the risk of somatic disorders or mental diseases.
CM is a well-described risk factor for somatic diseases and mental disorders in adulthood (5–7). A meta-analysis by Hughes et al. (5) found associations between CM and health risk behaviors, mental disorders as well as somatic diseases. Besides an increase in health risk behaviors, such as smoking and problematic alcohol use, CM was repeatedly associated with various substance abuse disorders (5, 7, 8). Further mental disorders often associated with CM are mood disorders including major depressive disorder (MDD) and anxiety disorders including post-traumatic stress disorder (PTSD) (5–7, 9, 10). For most of these mental disorders, CM was found to lower the age of onset, worsen the course of symptoms, increase the treatment resistance and thus increase the risk of chronicity (6, 7, 10, 11).
Regarding somatic diseases, cardiovascular diseases as well as their risk factors were frequently described to be related to CM (12–15). Thus, on the one hand, CM was associated with myocardial infarction, stroke, and cardiovascular symptoms (13–15). On the other hand, associations with smoking, hypertension and obesity were observed (12–14, 16–18). Similar to mental symptoms, a dose-dependent increase in somatic symptoms after CM was reported (14, 15). Interestingly, the associations between CM and health risk factors for cardiovascular diseases such as physical symptoms including obesity or hypertension and health risk behaviors including smoking were found to be largely independent of each other (16, 18).
In a regulatory manner, extreme or chronic stress may lead to an enhanced sensitivity of the hypothalamus-pituitary-adrenal (HPA) axis. The HPA axis is the major endocrine stress response system regulating the secretion of glucocorticoids such as cortisol by the adrenal gland. In the absence of stress, cortisol is secreted in a circadian rhythm. Under stress conditions, the cortisol secretion is stimulated. An enhanced sensitivity of the HPA axis might prevent the body from chronically increased cortisol concentrations and prepare for faster stress responses in the light of future stress (19). Teicher and Samson (7) discussed the wide-ranging multifaceted impact of CM as a consequence of neurobiological changes. In rats, the neurotoxic effects of glucocorticoids on the forebrain were reported (20). In humans, glucocorticoids were observed to suppress neurogenesis in the hippocampus (7). Accordingly, chronic stress was associated with morphological and synaptic changes, particularly in the prefrontal cortex and subcortical regions such as the hippocampus, the amygdala and the hypothalamus (7, 21–24). These structures are also known as regulators of the HPA axis (7, 25). As an early stressor, CM was reported to have such prolonged effects on the HPA axis (26–28). Accordingly, CM was associated with lower basal blood and saliva cortisol concentrations (18, 26, 29–31).
Altered basal cortisol concentrations were also reported for multiple CM-associated somatic diseases and mental disorders. After burnout and exhaustion, alterations of the HPA axis were described that are similar to CM-associated changes (32, 33). Thus, lower basal blood cortisol concentrations were associated with more severe depressive symptoms, primarily in the absence of psychotic symptoms and in the comorbid presence of PTSD symptoms (19, 30, 34). Especially for cases with comorbid PTSD symptoms, it was discussed if these lower basal cortisol concentrations might rely on neurobiological changes due to the traumatic exposition (19). In MDD patients, however, higher blood cortisol concentrations predicted worse treatment outcomes (35). In contrast to CM and depressive symptoms, positive associations were reported between basal cortisol concentrations and health risk behaviors. Thus, smoking and high alcohol consumption were associated with higher basal cortisol concentrations (36–39). Moreover, Badrick et al. (36) did not observe any differences between current and ex-smokers suggesting long-term effects of smoking on the HPA axis.
Higher basal cortisol concentrations were also correlated with increased central obesity, particularly if obesity was reported as stress-induced (40–43). Accordingly, higher cortisol concentrations were associated with higher triglyceride concentrations and higher concentrations of high-density lipoproteins cholesterol (HDL-C), although results for the latter are more ambiguous (43). In a review, van Rossum (41) summarized that higher cortisol concentrations in obesity matched a higher risk for cardiovascular comorbidities. Indeed, as previously reported, higher systolic blood pressure was associated with both higher cortisol concentrations and obesity (40, 43). Whitworth et al. (43) even widened the hypothesis and reported an increased risk of cardiovascular factors facing elevated basal cortisol concentrations.
Although, the effects of CM on health risk behavior, mental and somatic diseases as well as associations between these factors and cortisol concentrations are well described, investigating the triangle of CM, health factors and cortisol concentrations is just about to start. Thus, lower basal cortisol concentrations after CM were mainly found to be independent of depressive symptoms (30, 31, 34). Prior studies demonstrated no additive effects of CM and depressive symptoms on basal cortisol concentrations and stress-dependent higher cortisol concentrations in obesity (30, 31, 34, 41, 42). Another study reported higher cortisol concentrations and higher systolic blood pressure to be associated with lower PTSD symptomatology in middle-aged and elderly patients (44).
Thus, on the one hand, basal cortisol concentrations are inversely associated with mental disorders but positively associated with somatic diseases on the other hand. These different effect directions for mental and somatic diseases need to be addressed. Accordingly, Meewisse et al. (45) reported lower cortisol concentrations in PTSD patients only if compared to non-exposed controls suggesting altered cortisol concentrations due to the exposure rather than the PTSD symptoms. As most diseases are researched in adulthood, mediation analyses with CM as exposure are advisable. As one of the first studies, Ju et al. (35) observed that the effects of CM on depressive symptoms in MDD patients were partly mediated through blood cortisol concentrations.
Analogous to Ju et al. (35), some studies used basal serum cortisol concentrations to longitudinally predict mental symptom severity or treatment outcomes (46, 47). Other studies, in contrast, provided evidence for the opposite effect direction: positive affect as well as mental symptoms longitudinally predicted basal cortisol changes (32, 33, 48, 49). In a recent review, Klimes-Dougan et al. (50) summarized the transgenerational effects of maternal depressive and bipolar disorders on the cortisol concentrations of the offspring. Due to circadian and ultra-circadian rhythms as well as interactions with other endogenous hormones, cortisol concentrations are likely more changeable than physical and mental symptoms. The present study integrated this assumption and the previous results while investigating the tringle of CM, basal blood cortisol concentrations and health issues via mediation analyses. Precisely, we assumed that the inverse association between CM and basal blood cortisol concentrations in adults of the general population is mediated by health risk behavior as well as physical and mental symptoms. Besides separate mediation analyses for each health issue, combined mediation analyses were calculated to account for the comorbidities of health risk behaviors, physical and mental symptoms. The analyses were based on two large independent samples of the general adult population of the northeast of Germany.
Materials and methods
Study population
2.1.
Data from two independent cohorts of the Study of Health in Pomerania (SHIP) was used (51). SHIP comprises adult, general population-based samples which are drawn from local registries in the northeast of Germany. The assessments and examinations of the SHIP studies were approved by the institutional ethics review board of the University Greifswald. The data collection of the SHIP studies and all analyses of the present manuscript were performed according to the declaration of Helsinki including written informed consent of all participants.
The first SHIP cohort (SHIP-START-0: N = 4,308) was recruited between 1997 and 2001. Interview and medical examination data as well as laboratory measurements in blood samples of the 10-years-follow-up (SHIP-START-2: 2008–2012; N = 2,333) are included in the present analyses. All participants of SHIP-START-0 still alive in 2006 were re-invited to participate in the Study of Life Events and Gene-Environment-Interaction in Depression (SHIP-LEGEND: 2007–2010; N = 2,400). SHIP-LEGEND was used to assess life events and multiple psychiatric phenotypes in the SHIP-START sample with 1,944 participants assessed in both SHIP-START-2 and SHIP-LEGEND. Psychometric data of SHIP-LEGEND are used in the present analyses. Psychometric data (SHIP-LEGEND) was assessed about 19 months (SD = 14.3 months) before the interviews, medical examinations and blood samples (SHIP-START-2).
A second, independent cohort (SHIP-TREND-0; N = 4,420) was recruited between 2008 and 2012 in the same local area as SHIP-START. Participants of SHIP-START and SHIP-TREND are not overlapping. Interview, medical examination and questionnaire data of SHIP-TREND-0 were used in the present analyses as a second, independent sample.
Interview data
2.2.
During a computer-assisted face-to-face interview, sociodemographic variables were assessed including sex and age. Cigarette smoking was assessed as either non-smoker, ex-smoker or current smoker; current and ex-smokers were summarized as ever-smokers for the present analyses. For ever-smokers, pack years were calculated according to Baumeister et al. (52). Alcohol consumption was quantified by the mean intake of ethanol in grams per day, averaged over the past 30 days (53). According to Baumeister et al. (53), risky alcohol consumption was defined as alcohol consumption of >20 g/d for women and >30 g/d for men. Participants were asked to bring their drug prescription sheet or medication containers and to report all medication used during the past week. Compounds were classified according to the Anatomical Therapeutic Chemical (ATC) classification (54).
Medical examination
2.3.
Body height was measured to the nearest 1 cm. Body weight was measured in light close to the nearest 100 g. Waist circumference was measured to the nearest 1 mm with an inelastic tape midway between the lower rib margin and the iliac crest while the participant was standing plain on both feet. As a proxy for central body fat, the waist-height ratio was calculated (55). The body mass index (BMI) was used to define obesity with a BMI ≥30 classified as obese. Blood pressure (BP) was measured three times via a BP cuff on the upper arm. While the participant was sitting calmly, the first measurement was conducted after a five-minute rest; the second and third measurement was each conducted with a three-minute delay. The mean of the second and third BP measurements was used for statistical purposes. Hypertension was defined if the participant reported the intake of antihypertensive medication (ATC C02, ATC C03, ATC C07, ATC C08, ATC C09 or self-report) or if a systolic BP ≥140 mmHg or a diastolic BP ≥90 mmHg was measured.
Laboratory measurements
2.4.
Single-point blood samples were taken from the cubital vein and stored at −80°C in the Integrated Research Biobank of the University Medicine Greifswald (56). The exact time of blood sampling was recorded. Participants of SHIP-TREND-0 but not participants of SHIP-START-2 were asked to fast before blood sampling. Fasting time was calculated in both cohorts by quantifying the time difference between the time of blood sampling and the time of the last reported caloric intake.
Processing of the serum samples to measure the cortisol concentrations is described elsewhere (57). Briefly, serum samples were prepared and frozen at −80°C directly after blood sampling. Samples were thawed and processed before the measurements. To quantify the serum cortisol concentrations, an immunoassay with low-cross reactivity was used on the AVIDA Centaur XP System (Siemens Healthcare Diagnostics, Eschborn, Germany). The coefficients of variation observed during the course of the measurements were low for both analyzed cohorts (30, 57).
White blood cell count (WBC) was measured either on the XT2000, XE 5000 or SE9000 analyzers from Sysmex (Sysmex Deutschland GmbH, Norderstedt, Germany) or on the Advia 2120i (Siemens Healthcare Diagnostics, Eschborn, Germany). Glycated hemoglobin (HbA1c) concentrations were quantified by high-performance liquid chromatography (Bio-Rad Diamat, Munich, Germany). Triglycerides were determined enzymatically (Dimension VISTA, Siemens Healthcare Diagnostics GmbH, Eschborn, Germany). High-density lipoprotein cholesterol (HDL-C) was measured enzymatically after the preparation with phosphotungstic acid/MgCl2.
All assays were performed by skilled personnel according to the manufacturer's instructions.
Psychometric data
2.5.
CM was assessed via the Childhood Trauma Questionnaire (CTQ) (58). Based on 28 items, five subscales are assessed: emotional, physical and sexual abuse as well as emotional and physical neglect. Each item is answered on a five-point scale ranging from “never true” to “very often true”. A summary score operationalizes the severity of CM overall (range: 25–125) with higher values indicating more severe CM. Summary scores of the subscales can be categorized into “none”, “mild”, “moderate” or “severe”, often used to compare “none/mild” vs. “moderate/severe” CM (58, 59). Accordingly, dichotomous abuse and neglect scores were calculated as indicators of the absence or presence of CM for the present manuscript. The dichotomous scores thus extend the severity information given by the CTQ summary score.
To assess subjective health complaints, the Subjective Health Complaints (SHC) questionnaire was used (60). All symptoms are rated on a four-point scale. Based on the results of a factor analysis, 30 symptoms are assigned to eight clusters (60). According to Klinger-König et al. (61), the clusters anxiety/depression and exhaustion were subsumed as mental complaints and the remaining six clusters were subsumed as somatic complaints. For both categories the mental (range: 13–52) and the somatic SHC (range: 17–68) a summary score was calculated. For both scores, higher values indicate more severe health complaints.
Depressive symptoms were differently assessed in SHIP-TREND-0 and SHIP-START-2. Both questionnaires assessed the severity of depressive symptoms during the past two weeks. In SHIP-TREND-0, the depression module of the Patient Health Questionnaire was used (PHQ-9) (62). The PHQ-9 uses nine items that mimic the symptoms used as MDD diagnostic criteria in the Diagnostic and Statistical Manual of Mental Disorder - 4th Version (DSM-IV) (63). The experience of each symptom is rated on a four-point scale from “not at all” to “almost every day”. A summary score is calculated (range: 0–27) with higher values indicating more severe depressive symptoms. In SHIP-START-2, the Beck Depression Inventory-II (BDI-II) was used (64). The BDI-II uses 21 items to assess depressive symptoms. Each item is rated on a four-point scale formulated individually for each item. A summary score is calculated (range: 0–63) with higher values indicating more severe depressive symptoms.
Analytic sample
2.6.
The selection of the analytic sample is presented in Supplementary Figure S1. Participants were excluded from analyses if data sets were incomplete for serum cortisol concentrations, the CTQ summary score, abuse and neglect, age, sex, fasting time, time of blood sampling, HbA1c and WBC (SHIP-TREND-0: N = 326; SHIP-START-2: N = 469). Further, participants were excluded if reporting the intake of corticosteroid medication (ATC H01, ATC H02, ATC R03; SHIP-TREND-0: N = 211; SHIP-START-2: N = 115) or sexual hormones or hormonal contraception (ATC G03, ATC G02B; SHIP-TREND-0: N = 366; SHIP-START-2: N = 109). Thus, the analytic sample comprised 3,517 participants for SHIP-TREND-0 and 1,640 participants for SHIP-START-2. Descriptive statistics of these analytic samples are provided in Table 1 and the results section. Descriptive statistics of covariates comparing the initial study samples with the analytic samples of both cohorts are presented in Supplementary Table S1.
Statistical analyses
2.7.
Statistical analyses were calculated with R 4.2.1 (65). For descriptive purposes, continuous variables are reported in mean (M) and standard deviation (SD); dichotomous variables are reported in percentage (%). All analyses were calculated separately for both cohorts in the first step and afterwards integrated via meta-analyses. Only meta-analytic results were interpreted.
In mediation analyses, serum cortisol concentrations were used as the outcome variable and the CTQ summary score, abuse and neglect were used as predictors. As potential mediators, the following variables were used: systolic BP, hypertension, WHtR, obesity, triglycerides, HDL-C, depressive symptoms, mental and somatic SHC, alcohol consumption, risky alcohol consumption, pack years and ever smoking. Association matrices of the mediators in SHIP-TREND-0 and SHIP-START-2 are presented in Supplementary Table S2. Associations between CM and serum cortisol concentrations, between CM and the potential mediator as well as between the potential mediators and serum cortisol concentrations are preconditioned to analyze statistical mediation effects. Hence, these associations were checked before calculating the mediation models. Highly skewed variables (skewness >|1|: CTQ summary score, systolic BP, triglycerides, depressive symptoms, alcohol consumption, pack years) were log-transformed (66). Log-transformation resulted in a distribution closer to normal. Specific sets of covariates were considered for each analysis as described below.
Main effects
2.7.1.
The main effects of CM and all mediators on serum cortisol concentrations were calculated using multiple linear regression models with robust standard errors. Separate analyses were conducted for each CM and mediator variable, respectively. To adjust for multiple testing, the false discovery rate (FDR) according to Benjamini and Hochberg (67) was used. All linear regression models were adjusted for age, sex, fasting time, time of blood sampling, HbA1c and WBC. Restricted cubic splines (RCS) with four knots (5th, 35th, 65th and 95th percentiles) were used to model non-linear associations between serum cortisol concentrations and age, fasting time as well as the time of blood sampling.
Associations between the CTQ summary score and all mediator variables were calculated via multiple linear regression models for continuous mediators and multiple logistic regression models for dichotomous mediators. Mediators were used as outcome variables. Robust standard errors were used. All analyses were adjusted for age (RCS) and sex. FDR (67) was used to adjust for multiple testing.
Mediation models
2.7.2.
Mediation models were calculated using the mediate function of the psych package (68). Standard errors were bootstrapped with 2,000 repetitions. Separate models for the three CM predictors were conducted. Firstly, separate mediation models were calculated for each suitable mediator. The analyses were adjusted for age (RCS), sex, fasting time (RCS), time of blood sampling (RCS), HbA1c and WBC. To adjust for multiple testing, the indirect effects were FDR-adjusted (67). Secondly, all mediators significant in the separate mediation models were integrated simultaneously into a full mediation model. Thus, the combined mediation effect of the mediators was calculated and the contribution of each mediator to this complete mediation effect was estimated. The covariates of the full mediation models equaled the separate mediation models.
Sensitivity analyses
2.7.3.
As the mental and somatic SHC scores are summarizing a large number of symptoms, sensitivity analyses on the impact of the 30 symptoms were conducted, Thus, the association between each item and CM and serum cortisol concentrations, respectively, was analyzed. Afterwards, symptoms significantly associated with both CM and serum cortisol concentrations entered separate mediation models. All sensitivity analyses were adjusted for age (RCS), sex, fasting time (RCS), time of blood sampling (RCS), HbA1c and WBC. P-values of both single linear regression models as well as indirect effects were FDR-adjusted to adjust for multiple testing (67).
Results
Descriptive statistics for SHIP-TREND-0 and SHIP-START-2 are provided in Table 1. The mean age of SHIP-TREND-0 participants was 53 years, while participants of SHIP-START-2 were 58 years old. The representation of men and women was similar in both samples (SHIP-TREND-0: 47% women; SHIP-START-2: 49% women). Participants of SHIP-TREND-0 had higher cortisol concentrations (SHIP-TREND-0: M = 322.7, SD = 116.1; SHIP-START-2: M = 302.1, SD = 110.8). Participants of SHIP-START-2 reported more severe CM. The mean differed by about half a point (SHIP-TREND-0: M = 33.5, SD = 9.7; SHIP-START-2: M = 34.1, SD = 9.8). Further, 2% more participants reported childhood abuse in SHIP-START-2 (SHIP-TREND-0: 7% abused; SHIP-START-2: 9% abused). Participants of both samples differed on most of the covariates and multiple mediators (Table 1).
Main effects
3.1.
Associations between the CM variables and all potential mediators are provided in Table 2. Significant associations with the CTQ summary score were observed for WHtR, HDL-C, depressive symptoms, both SHC scores, alcohol consumption and pack years (β = −.037 – .260, all p_FDR _< .05). All associations were positive, except for HDL-C and alcohol consumption. For both abuse and neglect, associations were observed with depressive symptoms, both SHC scores and alcohol consumption (abuse: β = −.125 – .650, all p_FDR _< .05; neglect: β = −.153 – .439, all p_FDR _< .001). A positive association was observed between abuse and pack years (β = .195, p_FDR _= .012). For neglect, a positive association was found with WHtR (β = .094, p_FDR _= .045).
All potential mediators were significantly associated with serum cortisol concentrations (β = −.180 – .273, all pFDR < .05), except for systolic BP. For test statistics and FDR-adjusted p-values see Table 3. Positive associations were observed with hypertension, triglycerides, HDL-C and both alcohol consumption variables. Inverse associations were observed with all CM variables, WHtR, obesity, depressive symptoms, both SHC scores, pack years and ever smoking.
Accordingly, the following variables were included as potential mediators of the associations between CM and serum cortisol concentrations: (1) depressive symptoms, mental SHC, somatic SHC and alcohol consumption were tested for all CM variables, (2) WHtR for the CTQ summary score and neglect, (3) pack years for the CTQ summary score and abuse and (4) HDL-C for the CTQ summary score.
Mediation models
3.2.
Separate mediation models
3.2.1.
An overview of the results of the separate mediation models is presented in Figure 1 and Table 4.
Forest plot of the effects of the separate mediation models for the CTQ summary score, abuse and neglect as predictors and serum cortisol concentrations as the outcome. The indirect effect describes the mediation effect through the mediator variable. The direct effect describes the effect of the predictor on serum cortisol concentrations adjusted for the mediator. The total effect describes the sum of the direct and indirect effects. All analyses were adjusted for age (non-linear), sex, fasting time (non-linear), time of blood sampling (non-linear), glycated hemoglobin and white blood cell count. CTQ, Childhood Trauma Questionnaire; WHtR, waist-height ratio; HDL-C, high-density lipoprotein cholesterol; Depr Symp. Depressive Symptoms; SHC, Subjective Health Complaints; Alcohol, Alcohol Consumption.
The impact of the CTQ summary score on serum cortisol concentrations was partly mediated by depressive symptoms (21.0% mediated, p_FDR _= .019) and the somatic SHC (19.2% mediated, p_FDR _= .007). The same structure of results was observed for the impact of abuse on serum cortisol concentrations. Again, depressive symptoms (19.7% mediated, p_FDR _= .004) and the somatic SHC (17.2% mediated, p_FDR _= .004) partly mediated the association. Similarly, the impact of neglect on serum cortisol concentrations was partly mediated by depressive symptoms (19.1% mediated, p_FDR _= .005) and the somatic SHC (16.9% mediated, p_FDR _= .005). The association between neglect and serum cortisol concentrations was partly mediated by alcohol consumption (8.3% mediated, p_FDR _= .023). Neither pack years nor alcohol consumption had a significant indirect effect on the CTQ summary score or abuse models. No mediation effects were observed for the mental SHC, WHtR or HDL-C.
Full mediation models
3.2.2
An overview of the results of the full mediation models is presented in Figure 2 and Table 5.
*Full mediation models of the impact of the CTQ summary score (A), abuse (B) and neglect (C) on serum cortisol concentrations through depressive symptoms, the somatic SHC and alcohol consumption. The total effect (c) is the sum of the direct effect (c') and the indirect effects (ab) of both mediators. The direct effect describes the effect of the respective predictor on serum cortisol concentrations adjusted for all mediators. The indirect effects describes the mediation effects contributed by the respective mediator. All analyses were adjusted for age (non-linear), sex, fasting time (non-linear), time of blood sampling (non-linear), glycated hemoglobin and white blood cell count. CTQ, Childhood Trauma Questionnaire; SHC, Subjective Health Complaints; c, total effect; c′, direct effect; ab, indirect effect; +p < .1; *p < .05; **p < .01; **p < .001.
For all three predictors, a mediation model including depressive symptoms and the somatic SHC as simultaneous mediators was calculated. Only for neglect, alcohol consumption was entered as the third mediator. A partial mediation of the impact of the predictor on serum cortisol concentrations through the combined mediators was observed in all models, i.e., for the CTQ summary score (27.7% mediated, p_ = .002), abuse (25.3% mediated, p = 7.77e-04) as well as neglect (35.5% mediated, p = 7.53e-08). Focusing on the contribution of the single mediators, similar results were observed for the CTQ summary score and abuse: Whereas the partial mediation by the somatic SHC reached the significance level (CTQ summary score: 15.5% mediated, p = .018; abuse: 13.5% mediated, p = .021), the single mediation impact of depressive symptoms did not. In the neglect model, alcohol consumption had the largest contribution to the total mediation effect (16.4% mediated, p = .005). The somatic SHC (12.0% mediated, p _= .088) was marginally significant (p < .1). The indirect effect of depressive symptoms did not reach the significance level.
Sensitivity analyses
3.3.
All 30 symptoms of the SHC were associated with the CTQ summary score (β = .065 – .219, all p_FDR _< .001) and abuse (β = .130 – .590, all p_FDR _< .05). For neglect, a significant association was observed for all symptoms (β = .092 – .419, all p_FDR _< .05), except for suffocated feeling (β = .088, p_FDR _= .066). Nevertheless, only eleven symptoms were associated with serum cortisol concentrations. These items covered four symptom clusters: exhaustion, difficulty breathing, pain and disturbances of sensations. The results of the associations between the SHC symptoms and serum cortisol concentrations are presented in Figure 3. As suffocated feeling was not associated with serum cortisol concentrations, all eleven symptoms significantly associated with serum cortisol concentrations were tested as potential mediators of the associations with the CTQ summary score, abuse and neglect, respectively.
Heat map for the associations between serum cortisol concentrations and the symptoms of the subjective health complaints questionnaire. The symptoms are assigned to eight symptom clusters named at the y axis. Anxiety/depression and exhaustion were summarized as mental complaints; the remaining six clusters were summarized as somatic complaints. Blue tiles represent significant associations; gray tiles represent insignificant associations. Darker colors represent smaller p-values. All presented p-values are FDR-adjusted. All analyses were adjusted for age (non-linear), sex, fasting time (non-linear), time of blood sampling (non-linear), glycated hemoglobin and white blood cell count. SHC, Subjective Health Complaints.
The results of the separate mediation analyses are presented in Supplementary Table S3. The impact of the CTQ summary score on serum cortisol concentrations was partly mediated by all symptoms (5.86–13.72% mediated, all p_FDR _< .05). The impact of abuse on serum cortisol concentrations was partly mediated by the three symptoms of exhaustion (13.49–14.69% mediated, all p_FDR _= .012) and shortness of breath (8.65% mediated, p_FDR _= .028). However, no indirect effect was observed for headache/facial pain, joint pain/pain in the limbs and numbness. A similar structure of the results was found for neglect: The association between neglect and serum cortisol concentrations was partly mediated by the three symptoms of exhaustion (8.65%–11.01% mediated, all p_FDR _= .038) and shortness of breath (6.53% mediated, p_FDR _= .049). No indirect effect was observed for neck/shoulder pain, headache/facial pain, joint pain/pain in the limbs, heaviness/tiredness in the legs and numbness.
Discussion
The association between CM and lowered basal cortisol concentrations is well described and was replicated in our data (18, 26, 29–31). In addition, the present study investigated if this association was mediated by health risk behaviors, mental or physical symptoms. The variety of potential mediators tested was based on previous research. However, mandatory associations with both CM as the predictor and serum cortisol concentrations as the outcome were only observed for a few disease symptoms. Among those, depressive symptoms and somatic SHC were the most robust mediators.
The triangle of CM, depressive symptoms and the HPA axis is well described (30, 31, 34, 35). Analog to previous results, our data demonstrated that CM and more severe depressive symptoms were both associated with lower basal cortisol concentrations, accomplished by a strong positive association between CM and depressive symptoms themselves. According to the sensitization theory of Heim et al. (19), a biological adaptation to CM might induce a long-term reduction of basal cortisol concentrations to prevent chronically enhanced cortisol concentrations. Simultaneously, the HPA axis is sensitized to new stressors resulting in a potentiated stress reaction (19). Similar alterations of the HPA axis were observed after burnout and exhaustion (32, 33). In line, CM increases the risk of mental symptoms and mental disorders including MDD (6, 9, 10). In MDD patients, more severe CM and higher basal cortisol concentrations were associated with worse courses of symptoms and worse treatment outcomes (6, 11, 35).
However, using adjusted linear regression models, the association between CM and cortisol concentrations was found to be independent of depressive symptoms (30, 31, 34). On the other hand, Ju et al. (35) observed a mediation of the association between CM and MDD severity by cortisol concentrations and dysfunctional attitudes in MDD patients. The present analyses were based on a general population sample with low CM severity and low severity of depressive symptoms. Our results supported both postulated relations: We observed a partial mediation of the association between CM and cortisol concentrations by depressive symptoms. Hence, lowered basal serum cortisol concentrations after CM were partly explained by more severe depressive symptoms. At the same time, a weaker, though depression-independent association between CM and cortisol concentrations was observed.
The mediation effect of depressive symptoms was lowered by simultaneously including somatic SHC as a second mediator. Interestingly, depressive symptoms did not diminish the indirect effect of somatic SHC. The somatic SHC comprised nausea and weight loss. In earlier studies, nausea and weight loss were associated with a worse subjective mental health status (60). Further, changes in appetite and weight are rated as depressive symptoms (62, 64). A moderate association between more somatic SHC and more severe depressive symptoms was previously also reported from SHIP (61). Accordingly, in parallel to the partial mediation effect by depressive symptoms, we observed a partial mediation of the association between CM and serum cortisol concentrations by somatic SHC.
Mental SHC, on the other hand, had no mediating effect in our analyses, although moderate associations between mental SHC, somatic SHC and depressive symptoms were reported in previous studies (60, 61). Our main effect analyses revealed a much smaller association between mental SHC and basal serum cortisol concentrations compared to associations between basal serum cortisol concentrations and depressive symptoms or somatic SHC. From a statistical point of view, this lowers the probability of a large mediation effect (69). From a theoretical point of view, mental SHC in our analyses combined depressive symptoms, anxiety and exhaustion. Sensitivity analyses revealed that some of the symptoms subsumed as exhaustion were associated with serum cortisol concentrations and showed a robust partial mediation of the association between CM and serum cortisol concentrations. In contrast, no association with serum cortisol concentrations were observed for the symptoms subsumed as anxiety/depression. Whereas more depressive symptoms and exhaustion were associated with lower basal cortisol concentrations (30–32, 34), the evidence of altered basal cortisol concentrations associated with anxiety is more ambiguous.
Regarding anxiety, Keefe et al. (70) reported associations between lower basal saliva cortisol concentrations with more severe generalized anxiety symptoms. In contrast, Mantella et al. (71) reported higher basal saliva cortisol concentrations together with more severe generalized anxiety symptoms in elderly patients. Meta-analysis investigating the associations between cortisol concentrations and PTSD did not reveal any overall effect (44, 45). However, subgroup analyses demonstrated an age shift at 30 years: PTSD was associated with higher cortisol concentrations in adolescents and young adults but lower cortisol concentrations in middle-aged and elderly adults (44). Additionally, analyses by Meewisse et al. (45) demonstrated that effects on cortisol concentrations might be caused by the exposure rather than the effect of PTSD.
In sum, mental symptoms as well as SHC rely on the subjective evaluation of perceived symptoms and well-being, while biomarkers and somatic disorders used as somatic mediators in our study, like systolic BP, obesity or HDL-C, are more objective. Although previously reported associations between these physical symptoms and serum cortisol concentrations were replicated (40, 41, 43), only a few associations with CM were observed. According to a review and meta-analysis by Norman et al. (72), associations between CM and somatic diseases are smaller than associations between CM and mental disorders. Additionally, Fukuda and Morimoto (37) summarized in a review that not obesity itself but weight change was associated with altered basal cortisol concentrations. Similar to weight change, the length of depressive episodes is rather short, mostly lasting for weeks or a few months (73, 74).
Importantly, mental and physical symptoms are interacting with each other. Thus, mentally diseased patients are more likely obese and have a higher risk of cardiovascular diseases and even mortality (75–78). Both mental and physical symptoms were previously associated with health risk behaviors such as smoking and alcohol consumption (78–81). Smoking and alcohol consumption were also associated with CM and basal cortisol concentrations before (5, 7, 8, 36, 37, 39). Accordingly, health risk behaviors were integrated as potential mediators in the present analyses with the expectancy of great effects.
However, alcohol consumption was the only health risk behavior assessed that partially mediated the effect between childhood neglect and basal serum cortisol concentrations. Interestingly, the indirect effect of alcohol consumption was low in single mediation analyses but increased when integrated into the model simultaneously with depressive symptoms and somatic SHC. This might hint at an upstream mediation effect with more severe CM encouraging health risk behaviors, which in turn promote depressive symptoms and subjective health complaints. Nevertheless, future research is needed to test this hypothesis. For smoking, pack years rather than smoking status was associated with CM. Yet, no mediation effect was observed for either variable.
Strengths and limitations
Conclusively, our analyses were based on a general population sample with a rather low CM and symptom severity. We used two large and independent cohorts and integrated the results via meta-analysis which makes the overall results statistically more robust. The meta-analytic approach also enabled us to overcome differences between the samples, e.g., different fasting times. Nevertheless, the tested associations might be more prone in patient samples. Additionally, future studies should aim at longitudinal instead of cross-sectional data to support the mediation direction not only by theory but also via data structure.
Our analyses used basal serum cortisol concentrations as the outcome. Thus, the results are focused rather on the basic functioning of the HPA axis than on stress reactivity. Moreover, we used single-point cortisol measurements. Repeated individual cortisol measurements would allow to assess diurnal slopes or calculate the area under the curve and thus enable the use of a more robust outcomes. Nevertheless, the measured serum cortisol concentrations were validated in a multi-omics study including cortisol-associated transcriptome concentrations (82). Here, the exact time of blood sampling was included as a covariate and modeled non-linear to adjust for the circadian rhythm of cortisol secretion. Further, we excluded participants with drug use potentially inferring with the cortisol secretion.
The mediators included in the present analyses interact with each other. Thus, a more complex mediation model might be needed to display the pathways. We aimed to fit a wide range of behaviors, disease symptoms and diseases potentially mediating the association between CM and basal cortisol concentrations. We focused on previously well-described variables and our analyses provide a first overview integrating these potential mediators in one study. Although the selection of potential mediators was theory driven, the description of suitable mediators was based on p-values and rather exploratory. This approach enabled to extend previous research by integrating and comparing a wide set of potential mediators as well as to narrow this set down. However, focusing on a narrower set would ease the integration of multiple mediators in more complex models.
Mental symptoms were represented by mental SHC and depressive symptoms. Anxiety symptoms or anxiety disorders were not included in the present study as these were insufficiently assessed. Besides, depressive symptoms and SHC were assessed by self-report questionnaires. Interviews and, validated diagnoses particularly for mental disorders, could improve the data validity. Further, similar mediation effects should be addressed with other mental symptoms and disorders in future studies. As Ju et al. (35) reported a mediation by dysfunctional attitudes, integrating personality traits as a mediator might also be promising.
Finally, although the used questionnaire limits CM to childhood and adolescents, no exact time of CM was assessed. Thus, a potential difference between early or late CM could not be evaluated. However, including CM-related timing information in future studies and differentiating between types of CM could extend our presented results.
Conclusion
The present study investigated a wide range of potential mediators for the association between CM and basal cortisol concentrations. Our analyses assessed several mediators described in multiple studies before, but followed a more integrative approach. In our two large general population-based samples, associations between the potential mediators and CM were largely absent. Thus, CM seem to add up to the effects of both physical and mental symptoms and should be addressed in both psychiatric and somatic medicine. Yet, mediation effects of depressive symptoms and somatic SHC were robust. Hence, especially in psychiatric medicine, the physiological impact of mental diseases should be addressed in the light of childhood maltreatment. Finally, our results are a first step towards more complex models representing the nuanced structure between the tested mediators.
The reference list from the paper itself. Each links out to its DOI / PubMed record.
- 1World Health Organization. Global status report on preventing violence against children. Geneva: World Health Organization (2020).
- 2Witt A Brown RC Plener PL Brähler E Fegert JM. Child maltreatment in Germany: prevalence rates in the general population. Child Adolesc Psychiatry Ment Health. (2017) 11:47. 10.1186/s 13034-017-0185-028974983 PMC 5621113 · doi ↗ · pubmed ↗
- 3Klinger-König J Streit F Erhardt A Kleineidam L Schmiedek F Schmidt B The assessment of childhood maltreatment and its associations with affective symptoms in adulthood: results of the German National Cohort (NAKO). World J Biol Psychiatry. (2022):1–12. 10.1080/15622975.2021.201140635302904 · doi ↗ · pubmed ↗
- 4Walker EA Gelfand A Katon WJ Koss M Pvon Korff M Bernstein D Adult health status of women with histories of childhood abuse and neglect. Am J Med. (1999) 107:332–9. 10.1016/S 0002-9343(99)00235-110527034 · doi ↗ · pubmed ↗
- 5Hughes K Bellis MA Hardcastle KA Sethi D Butchart A Mikton C The effect of multiple adverse childhood experiences on health: a systematic review and meta-analysis. Lancet Public Health. (2017) 2:e 356–66. 10.1016/S 2468-2667(17)30118-429253477 · doi ↗ · pubmed ↗
- 6Nelson J Klumparendt A Doebler P Ehring T. Childhood maltreatment and characteristics of adult depression: meta-analysis. Br J Psychiatry. (2017) 210:96–104. 10.1192/bjp.bp.115.18075227908895 · doi ↗ · pubmed ↗
- 7Teicher MH Samson JA. Childhood maltreatment and psychopathology: a case for ecophenotypic variants as clinically and neurobiologically distinct subtypes. Am J Psychiatry. (2013) 170:1114–33. 10.1176/appi.ajp.2013.1207095723982148 PMC 3928064 · doi ↗ · pubmed ↗
- 8Tonmyr L Thornton T Draca J Wekerle C. A review of childhood maltreatment and adolescent substance use relationship. CPSR. (2010) 6:223–34. 10.2174/157340010791792581 · doi ↗