Correction: Versatile and automated workflow for the analysis of oligodendroglial calcium signals
Dorien A. Maas, Blandine Manot-Saillet, Philippe Bun, Chloé Habermacher, Corinne Poilbout, Filippo Rusconi, Maria Cecilia Angulo

Abstract
Genes, proteins, chemicals, diseases, species, mutations and cell lines named across the full text — each resolved to its canonical identifier and authoritative record.
Click any figure to enlarge with its caption.
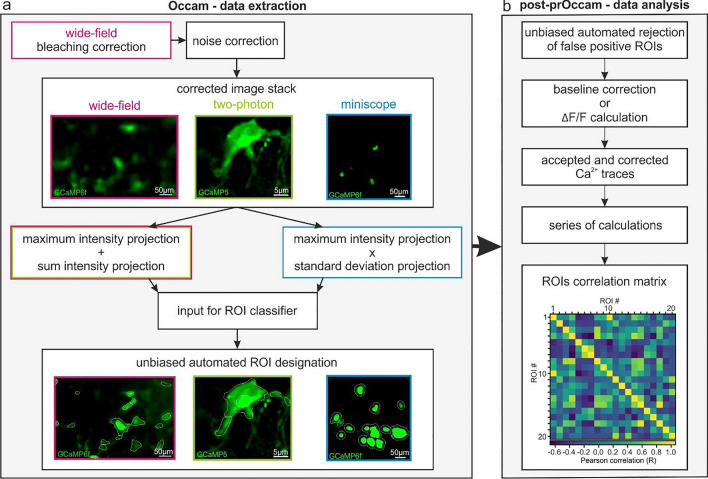 Figure 1
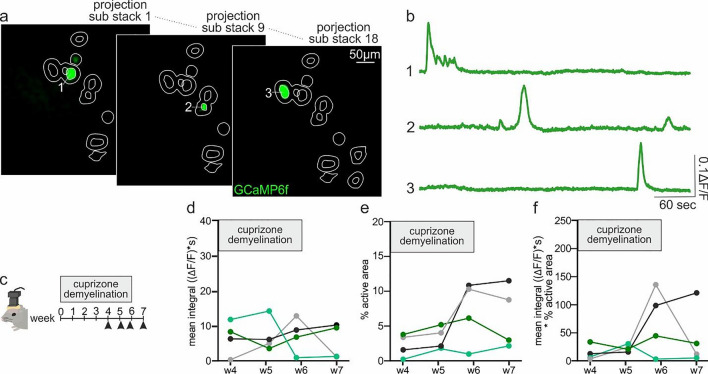 Figure 3
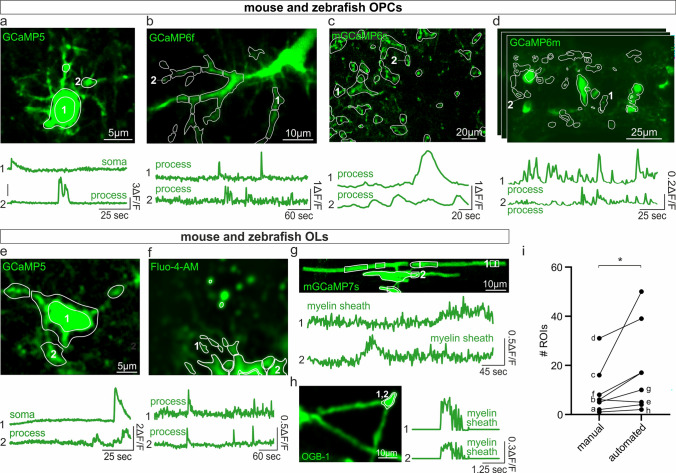 Figure 6
Peer Reviews
No public reviews on file for this paper yet. If you reviewed it on a platform where reviews are public (OpenReview, ICLR, NeurIPS, ICML), you can paste yours below so the community can read it here.
Videos
No videos yet. Explain this paper in a talk, walkthrough, or lecture? Add one.
Taxonomy
TopicsS100 Proteins and Annexins
Correction: Cellular and Molecular Life Sciences (2024) 81:15 10.1007/s00018-023-05065-3
In this article Figs. 1, 3 and 6 were corrupted in the article PDF; the figures should have appeared as shown below.Fig. 1. Occam and post-prOccam: an automated analysis software solution for oligodendroglia Ca^2+^ imaging of different preparations. a The Occam software is available as a Fiji/ImageJ2 plugin and configurable for the analysis of wide-field, two-photon and miniscope Ca^2+^ imaging. Occam performs bleaching correction only on wide-field image stacks and does noise correction according to the imaging condition (Supplementary manual). Then, it uses the maximum and sum intensity projections for wide-field and two-photon image stacks and the maximum and standard deviation projections for miniscope image stacks to build a projection image used as input for the WEKA-based ROI classifier. b Output from Occam is fed to the post-prOccam Python-based software that (1) rejects any ROI that does not show significant Ca^2+^ fluctuations; (2) performs either baseline subtraction or the conventional ΔF/F correction; (3) performs statistical calculations for each accepted ROI; and (4) computes a ROIs Pearson correlation matrix. Occam and post-prOccam are multiplatform, free and open source programs, freely available at: https://gitlab.com/d5674/occam (detailed procedures and software inner workings are described in the Supplementary manual)Fig. 3. Analysis of miniscope Ca^2+^ signals of oligodendroglia in freely moving mice. a Representative images of an in vivo microendoscopy Ca^2+^ imaging stack collected from a demyelinated corpus callosum of a freely moving mouse. The image displays detected active ROIs (white) in several sub-stacks as obtained with the in vivo analysis option of Occam and b their corresponding corrected Ca^2+^ traces obtained with post-prOccam. c Longitudinal experiments that can be analyzed with Occam and post-prOccam over weeks. Four mice were fed with the cuprizone diet to induce demyelination (see Supplementary Material and Methods) and Ca^2+^ imaging was performed for four consecutive weeks. d Mean integral, e % of active area and f mean integral multiplied by percentage of active area are calculated with post-prOccam over the four consecutive weeks for all miceFig. 6Occam and post-prOccam analyze Ca^2+^ signals from OPCs, OLs and myelin sheaths in different species and imaging conditions. Representative images with ROIs (white) and Ca^2+^ traces obtained with Occam and post-prOccam for (a) a putative OPC from mouse demyelinated corpus callosum in acute slices recorded in a two-photon microscope (see “Materials and methods”), (b) an OPC from the in vivo mouse somatosensory cortex recorded with a two-photon microscope (Supplementary Video 1 from [11], (c) OPC processes from the in vivo mouse visual cortex recorded with a two-photon microscope (Supplementary Video 3 from [18], (d) OPC somata and processes from the in vivo zebrafish spinal cord recorded with a light sheet microscope (from Tim Czopka & Patricia Bishop, Unpublished data), (e) a putative OL from mouse demyelinated corpus callosum in acute slices recorded with a two-photon microscope (see “Materials and methods”), (f) a primary mouse OL in culture recorded with an Opterra II Multipoint Swept Field Confocal microscope (Supplementary Video 1 from [14], (g) an OL process from the in vivo zebrafish spinal cord recorded with a Confocal Zeiss LSM880 Airyscan (from Philipp Braaker and David Lyons, unpublished data) and (h) an OL process recorded in an acute brain slice from a mouse with an Olympus BX61WI microscope and a NeuroCCD camera at 40 Hz (Supplementary Video 1 from [6]. The image stacks were recorded at different acquisition rates and analyzed with Occam using either two-photon (a, b, c, f, g) or miniscope configuration (d). i Comparison of the number of ROIs identified by visual inspection with that of ROIs automatically detected in the different analyzed stacks. *p < 0.05; Wilcoxon rank test. Dot plots are presented as mean ± s.e.m
The original article has been corrected.