Health of unpaid carers in Wales, UK: a population data linkage study
Fangzhou Huang, Jiao Song, Alisha R Davies

TL;DR
This study creates a database of unpaid carers in Wales and finds they face higher health risks than non-carers, especially younger and deprived groups.
Contribution
The study introduces the first electronic cohort of unpaid carers in Wales using linked health data to assess their health risks.
Findings
Unpaid carers in Wales were found to have a higher risk of 35 out of 37 long-term health conditions compared to non-carers.
Multimorbidity was more prevalent among unpaid carers, particularly in younger age groups and deprived communities.
The creation of an e-cohort allows for future rapid analysis of unpaid carers' health needs and evaluation of support initiatives.
Abstract
The population of unpaid carers in Wales increased to record. There is no systematic approach to record unpaid caring status, resulting in limited quantitative evidence on unpaid carers’ health. The aim of this study is to: (i) create an e-cohort of unpaid carers by linking routinely collected health and administrative datasets in Wales, UK. (ii) investigate whether long-term health conditions and multimorbidity are more prevalent amongst unpaid carers than non-carers. Unpaid carers were identified by linking primary care dataset, National Survey for Wales data with demographic characteristics in the Secure Anonymise Information Linkage Databank. The clinical codes identified in Cambridge Multimorbidity Score were used to explore the prevalence of long-term health conditions. A total of 91 220 unpaid carers in Wales were identified between 1 January 2010 and 1 March 2022. Unpaid…
Genes, proteins, chemicals, diseases, species, mutations and cell lines named across the full text — each resolved to its canonical identifier and authoritative record.
Click any figure to enlarge with its caption.
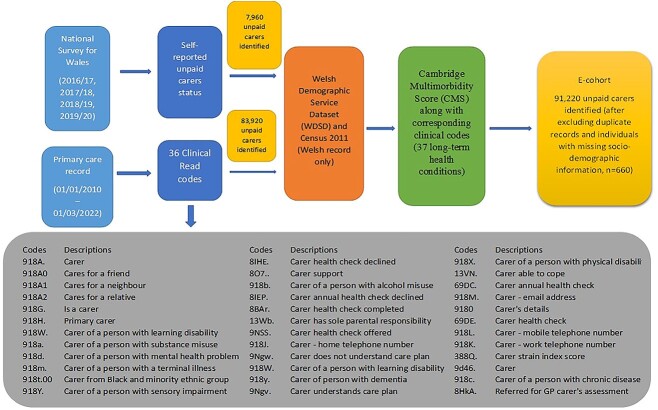 Fig. 1
| Carer | Non-carer | Carer versus Non-carer | ||||||||||
|---|---|---|---|---|---|---|---|---|---|---|---|---|
| Whole sample | Crude rate | Adjusted rate | CI low | CI high | Crude rate | Adjusted rate | CI low | CI high | Rate ratio | CI low | CI high |
|
| Anxiety and/or depression | 276.1 | 243.9 | 240.0 | 247.7 | 180.6 | 142.7 | 139.9 | 145.6 | 1.7 | 1.7 | 1.8 | <0.001 |
| Hypertension | 129.7 | 89.2 | 87.5 | 90.8 | 108.4 | 72.1 | 70.7 | 73.5 | 1.2 | 1.2 | 1.3 | <0.001 |
| Hearing loss | 91.4 | 79.4 | 77.0 | 81.9 | 67.1 | 52.7 | 50.9 | 54.5 | 1.5 | 1.4 | 1.6 | <0.001 |
| Chronic kidney disease | 111.0 | 72.6 | 71.1 | 74.0 | 99.3 | 64.2 | 62.8 | 65.5 | 1.1 | 1.1 | 1.2 | <0.001 |
| Asthma | 58.5 | 60.2 | 57.8 | 62.7 | 50.4 | 46.1 | 44.1 | 48.1 | 1.3 | 1.2 | 1.4 | <0.001 |
| Diabetes | 74.9 | 55.4 | 53.9 | 56.8 | 67.5 | 47.2 | 45.9 | 48.4 | 1.2 | 1.1 | 1.2 | <0.001 |
| Musculoskeletal disorders | 67.5 | 54.1 | 52.2 | 56.0 | 48.2 | 35.8 | 34.3 | 37.2 | 1.5 | 1.4 | 1.6 | <0.001 |
| Irritable bowel syndrome | 60.5 | 49.5 | 47.8 | 51.3 | 41.2 | 32.7 | 31.2 | 34.1 | 1.5 | 1.4 | 1.6 | <0.001 |
| Constipation | 57.0 | 41.1 | 39.6 | 42.6 | 36.8 | 23.8 | 22.9 | 24.7 | 1.7 | 1.6 | 1.8 | <0.001 |
| Cancer (diagnosis in last 5 years) | 50.8 | 36.2 | 35.0 | 37.4 | 22.2 | 14.3 | 13.6 | 15.0 | 2.5 | 2.4 | 2.7 | <0.001 |
|
| ||||||||||||
| Anxiety and/or depression | 189.9 | 177.6 | 167.0 | 188.2 | 87.1 | 78.1 | 70.9 | 85.4 | 2.3 | 2.0 | 2.6 | <0.001 |
| Asthma | 67.7 | 68.2 | 60.9 | 75.4 | 41.8 | 41.2 | 35.5 | 46.9 | 1.7 | 1.4 | 2.0 | <0.001 |
| Hearing loss | 58.0 | 58.6 | 51.8 | 65.4 | 27.7 | 28.3 | 23.5 | 33.1 | 2.1 | 1.7 | 2.6 | <0.001 |
| Learning disability | 46.3 | 53.5 | 46.7 | 60.3 | 5.3 | 5.8 | 3.6 | 8.1 | 9.2 | 6.1 | 14.5 | <0.001 |
| Musculoskeletal disorders | 32.5 | 32.0 | 27.0 | 37.0 | 13.5 | 14.4 | 10.9 | 17.9 | 2.2 | 1.6 | 3.0 | <0.001 |
| Irritable bowel syndrome | 33.5 | 28.6 | 24.2 | 33.0 | 21.4 | 19.2 | 15.5 | 22.9 | 1.5 | 1.2 | 1.9 | <0.001 |
| Epilepsy | 23.4 | 25.7 | 20.9 | 30.4 | 5.7 | 5.5 | 3.4 | 7.6 | 4.6 | 3.0 | 7.4 | <0.001 |
| Schizophrenia or bipolar disorder | 15.8 | 18.2 | 14.1 | 22.2 | 3.0 | 3.0 | 1.4 | 4.6 | 6.0 | 3.4 | 11.6 | <0.001 |
| Psychoactive substance misuse (not alcohol) | 16.4 | 16.7 | 13.0 | 20.4 | 6.9 | 7.4 | 4.9 | 10.0 | 2.3 | 1.5 | 3.5 | <0.001 |
| Constipation | 14.3 | 15.5 | 11.8 | 19.2 | 4.0 | 3.7 | 2.0 | 5.3 | 4.2 | 2.5 | 7.5 | <0.001 |
|
| ||||||||||||
| Anxiety and/or depression | 286.4 | 271.1 | 260.5 | 281.7 | 155.5 | 138.9 | 130.9 | 146.8 | 2.0 | 1.8 | 2.1 | <0.001 |
| Irritable bowel syndrome | 77.5 | 66.1 | 60.6 | 71.6 | 51.3 | 40.4 | 36.3 | 44.5 | 1.6 | 1.4 | 1.9 | <0.001 |
| Asthma | 59.6 | 55.7 | 50.3 | 61.1 | 45.1 | 40.3 | 35.8 | 44.8 | 1.4 | 1.2 | 1.6 | <0.001 |
| Hearing loss | 46.8 | 46.5 | 41.4 | 51.6 | 25.7 | 25.0 | 21.2 | 28.7 | 1.9 | 1.5 | 2.3 | <0.001 |
| Learning disability | 31.0 | 40.8 | 35.5 | 46.1 | 3.8 | 3.8 | 2.3 | 5.3 | 10.8 | 7.0 | 17.1 | <0.001 |
| Musculoskeletal disorders | 36.4 | 36.4 | 31.8 | 40.9 | 20.9 | 20.7 | 17.2 | 24.2 | 1.8 | 1.4 | 2.2 | <0.001 |
| Psychoactive substance misuse (not alcohol) | 27.1 | 33.1 | 28.4 | 37.9 | 19.0 | 22.8 | 18.9 | 26.7 | 1.5 | 1.2 | 1.8 | <0.001 |
| Schizophrenia or bipolar disorder | 24.1 | 27.9 | 23.6 | 32.2 | 8.6 | 8.2 | 6.0 | 10.4 | 3.4 | 2.5 | 4.7 | <0.001 |
| Epilepsy | 20.1 | 23.2 | 19.3 | 27.1 | 7.8 | 7.5 | 5.4 | 9.6 | 3.1 | 2.2 | 4.3 | <0.001 |
| Alcohol problems | 20.1 | 23.2 | 19.3 | 27.1 | 16.2 | 17.3 | 14.0 | 20.5 | 1.3 | 1.0 | 1.7 | 0.070 |
|
| ||||||||||||
| Anxiety and/or depression | 306.6 | 289.4 | 280.5 | 298.3 | 182.7 | 168.3 | 161.1 | 175.5 | 1.7 | 1.6 | 1.8 | <0.001 |
| Irritable bowel syndrome | 82.8 | 73.0 | 68.1 | 77.8 | 46.7 | 40.3 | 36.7 | 43.9 | 1.8 | 1.6 | 2.0 | <0.001 |
| Asthma | 65.0 | 61.8 | 57.1 | 66.5 | 50.7 | 48.7 | 44.4 | 52.9 | 1.3 | 1.1 | 1.4 | <0.001 |
| Hearing loss | 50.1 | 51.5 | 47.0 | 56.0 | 29.7 | 29.4 | 26.0 | 32.8 | 1.8 | 1.5 | 2.0 | <0.001 |
| Hypertension | 46.0 | 50.3 | 45.7 | 54.8 | 28.0 | 28.0 | 24.7 | 31.3 | 1.8 | 1.5 | 2.1 | <0.001 |
| Musculoskeletal disorders | 49.8 | 48.2 | 44.0 | 52.4 | 28.3 | 26.4 | 23.3 | 29.5 | 1.8 | 1.6 | 2.1 | <0.001 |
| Diabetes | 30.3 | 31.7 | 28.1 | 35.3 | 19.6 | 19.7 | 16.9 | 22.5 | 1.6 | 1.3 | 1.9 | <0.001 |
| Thyroid disorders | 38.8 | 31.4 | 28.4 | 34.5 | 29.0 | 23.2 | 20.6 | 25.8 | 1.4 | 1.2 | 1.6 | <0.001 |
| Schizophrenia or bipolar disorder | 25.8 | 29.8 | 26.2 | 33.4 | 10.5 | 11.0 | 8.8 | 13.1 | 2.7 | 2.1 | 3.5 | <0.001 |
| Alcohol problems | 22.9 | 27.0 | 23.5 | 30.4 | 18.5 | 21.6 | 18.5 | 24.7 | 1.2 | 1.0 | 1.5 | 0.022 |
|
| ||||||||||||
| Anxiety and/or depression | 306.6 | 289.5 | 282.6 | 296.3 | 207.6 | 188.1 | 182.4 | 193.9 | 1.5 | 1.5 | 1.6 | <0.001 |
| Hypertension | 114.1 | 120.0 | 114.8 | 125.1 | 86.6 | 88.9 | 84.5 | 93.4 | 1.3 | 1.3 | 1.4 | <0.001 |
| Irritable bowel syndrome | 71.8 | 63.8 | 60.2 | 67.3 | 47.2 | 41.6 | 38.7 | 44.4 | 1.5 | 1.4 | 1.7 | <0.001 |
| Musculoskeletal disorders | 65.2 | 61.4 | 57.8 | 65.0 | 43.0 | 40.9 | 37.9 | 43.8 | 1.5 | 1.4 | 1.7 | <0.001 |
| Hearing loss | 58.4 | 59.7 | 56.0 | 63.4 | 38.5 | 37.8 | 34.9 | 40.7 | 1.6 | 1.4 | 1.8 | <0.001 |
| Asthma | 60.8 | 58.1 | 54.6 | 61.7 | 53.2 | 50.8 | 47.4 | 54.1 | 1.1 | 1.0 | 1.3 | 0.002 |
| Diabetes | 48.9 | 53.5 | 49.8 | 57.1 | 46.7 | 49.6 | 46.1 | 53.0 | 1.1 | 1.0 | 1.2 | 0.335 |
| Thyroid disorders | 50.8 | 43.5 | 40.6 | 46.4 | 36.0 | 29.9 | 27.5 | 32.2 | 1.5 | 1.3 | 1.6 | <0.001 |
| Chronic kidney disease | 36.4 | 34.3 | 31.6 | 37.1 | 35.3 | 33.5 | 30.8 | 36.2 | 1.0 | 0.9 | 1.2 | 0.609 |
| Constipation | 36.4 | 33.9 | 31.2 | 36.7 | 20.6 | 18.4 | 16.4 | 20.3 | 1.8 | 1.6 | 2.1 | <0.001 |
|
| ||||||||||||
| Anxiety and/or depression | 264.5 | 251.4 | 245.5 | 257.3 | 195.1 | 179.9 | 174.8 | 185.0 | 1.4 | 1.3 | 1.5 | <0.001 |
| Hypertension | 163.0 | 170.7 | 165.4 | 176.0 | 138.7 | 144.6 | 139.7 | 149.5 | 1.2 | 1.1 | 1.2 | <0.001 |
| Hearing loss | 77.6 | 82.6 | 78.7 | 86.5 | 56.1 | 56.6 | 53.4 | 59.8 | 1.5 | 1.4 | 1.6 | <0.001 |
| Musculoskeletal disorders | 76.1 | 72.7 | 69.2 | 76.2 | 56.5 | 53.7 | 50.7 | 56.7 | 1.4 | 1.3 | 1.5 | <0.001 |
| Diabetes | 65.0 | 72.5 | 68.8 | 76.3 | 75.0 | 81.8 | 77.9 | 85.7 | 0.9 | 0.8 | 1.0 | <0.001 |
| Chronic kidney disease | 66.1 | 63.5 | 60.2 | 66.8 | 64.9 | 61.5 | 58.3 | 64.8 | 1.0 | 1.0 | 1.1 | 0.594 |
| Irritable bowel syndrome | 59.3 | 53.1 | 50.1 | 56.0 | 42.1 | 37.0 | 34.6 | 39.5 | 1.4 | 1.3 | 1.6 | <0.001 |
| Asthma | 49.5 | 47.5 | 44.6 | 50.4 | 52.5 | 49.0 | 46.2 | 51.9 | 1.0 | 0.9 | 1.1 | 0.151 |
| Thyroid disorders | 54.6 | 46.8 | 44.2 | 49.5 | 44.5 | 37.2 | 34.9 | 39.6 | 1.3 | 1.2 | 1.4 | <0.001 |
| Cancer (diagnosis in last 5 years) | 41.4 | 44.3 | 41.4 | 47.3 | 24.1 | 22.9 | 20.9 | 24.9 | 1.9 | 1.7 | 2.2 | <0.001 |
|
| ||||||||||||
| Anxiety and/or depression | 259.2 | 251.5 | 243.8 | 259.2 | 169.8 | 161.1 | 154.7 | 167.6 | 1.6 | 1.5 | 1.7 | <0.001 |
| Hypertension | 206.6 | 210.0 | 202.5 | 217.4 | 178.1 | 179.5 | 172.5 | 186.5 | 1.2 | 1.1 | 1.2 | <0.001 |
| Chronic kidney disease | 161.3 | 159.9 | 153.3 | 166.5 | 142.9 | 141.5 | 135.2 | 147.7 | 1.1 | 1.1 | 1.2 | <0.001 |
| Diabetes | 141.9 | 149.6 | 143.1 | 156.2 | 116.2 | 119.9 | 113.9 | 125.8 | 1.2 | 1.2 | 1.3 | <0.001 |
| Hearing loss | 118.0 | 122.4 | 116.3 | 128.4 | 93.4 | 95.1 | 89.8 | 100.5 | 1.3 | 1.2 | 1.4 | <0.001 |
| Cancer (diagnosis in last 5 years) | 102.7 | 108.1 | 102.4 | 113.8 | 38.7 | 39.6 | 36.0 | 43.1 | 2.7 | 2.4 | 3.0 | <0.001 |
| COPD | 81.0 | 83.9 | 78.8 | 89.0 | 61.9 | 62.5 | 58.1 | 66.9 | 1.3 | 1.2 | 1.5 | <0.001 |
| Musculoskeletal disorders | 85.4 | 81.8 | 76.9 | 86.6 | 65.4 | 62.9 | 58.6 | 67.2 | 1.3 | 1.2 | 1.4 | <0.001 |
| Coronary heart disease | 68.6 | 74.2 | 69.3 | 79.1 | 53.8 | 57.8 | 53.5 | 62.2 | 1.3 | 1.2 | 1.4 | <0.001 |
| Diverticular disease of intestine | 73.4 | 71.7 | 67.1 | 76.3 | 61.4 | 60.2 | 55.9 | 64.5 | 1.2 | 1.1 | 1.3 | <0.001 |
|
| ||||||||||||
| Chronic kidney disease | 377.3 | 377.3 | 369.5 | 385.0 | 328.1 | 328.0 | 320.5 | 335.5 | 1.2 | 1.1 | 1.2 | <0.001 |
| Anxiety and/or depression | 272.1 | 272.0 | 264.9 | 279.0 | 177.9 | 177.8 | 171.7 | 183.9 | 1.5 | 1.5 | 1.6 | <0.001 |
| Hypertension | 199.5 | 199.5 | 193.1 | 205.9 | 179.2 | 179.2 | 173.1 | 185.3 | 1.1 | 1.1 | 1.2 | <0.001 |
| Hearing loss | 194.3 | 194.3 | 188.0 | 200.6 | 158.4 | 158.5 | 152.6 | 164.3 | 1.2 | 1.2 | 1.3 | <0.001 |
| Dementia | 185.0 | 184.9 | 178.7 | 191.1 | 54.7 | 54.7 | 51.0 | 58.3 | 3.4 | 3.1 | 3.7 | <0.001 |
| Constipation | 155.6 | 155.6 | 149.8 | 161.3 | 106.5 | 106.5 | 101.5 | 111.4 | 1.5 | 1.4 | 1.6 | <0.001 |
| Diabetes | 153.6 | 153.6 | 147.9 | 159.4 | 126.9 | 127.0 | 121.6 | 132.3 | 1.2 | 1.1 | 1.3 | <0.001 |
| Cancer (diagnosis in last 5 years) | 122.5 | 122.5 | 117.3 | 127.8 | 49.0 | 49.1 | 45.6 | 52.5 | 2.5 | 2.3 | 2.7 | <0.001 |
| Atrial fibrillation | 119.2 | 119.2 | 114.1 | 124.4 | 102.5 | 102.6 | 97.7 | 107.4 | 1.2 | 1.1 | 1.2 | <0.001 |
| Coronary heart disease | 116.7 | 116.7 | 111.6 | 121.8 | 86.9 | 87.0 | 82.5 | 91.5 | 1.3 | 1.2 | 1.4 | <0.001 |
|
| ||||||||||||
| Anxiety and/or depression | 338.0 | 287.6 | 279.1 | 296.0 | 237.6 | 184.2 | 177.7 | 190.8 | 1.6 | 1.5 | 1.6 | <0.001 |
| Hypertension | 131.7 | 88.1 | 84.5 | 91.6 | 107.4 | 70.9 | 67.8 | 74.0 | 1.2 | 1.2 | 1.3 | <0.001 |
| Hearing loss | 85.4 | 74.1 | 69.2 | 79.1 | 63.2 | 48.7 | 45.0 | 52.4 | 1.5 | 1.4 | 1.7 | <0.001 |
| Asthma | 70.6 | 71.0 | 65.5 | 76.4 | 63.8 | 55.0 | 50.6 | 59.5 | 1.3 | 1.1 | 1.4 | 0.010 |
| Chronic kidney disease | 96.5 | 62.1 | 59.1 | 65.1 | 88.1 | 56.2 | 53.4 | 58.9 | 1.1 | 1.0 | 1.2 | 0.007 |
| Diabetes | 87.1 | 60.3 | 57.2 | 63.4 | 80.3 | 53.9 | 51.1 | 56.7 | 1.1 | 1.0 | 1.2 | 0.020 |
| Irritable bowel syndrome | 68.2 | 54.7 | 50.8 | 58.5 | 44.3 | 33.2 | 30.4 | 36.1 | 1.6 | 1.5 | 1.8 | <0.001 |
| Musculoskeletal disorders | 66.9 | 53.5 | 49.5 | 57.5 | 49.5 | 35.6 | 32.6 | 38.6 | 1.5 | 1.3 | 1.7 | <0.001 |
| Constipation | 63.3 | 42.7 | 39.8 | 45.6 | 40.6 | 26.2 | 24.0 | 28.3 | 1.6 | 1.5 | 1.8 | <0.001 |
| Cancer (diagnosis in last 5 years) | 50.5 | 34.1 | 31.7 | 36.5 | 20.9 | 13.3 | 11.8 | 14.8 | 2.6 | 2.2 | 3.0 | <0.001 |
|
| ||||||||||||
| Anxiety and/or depression | 234.3 | 209.3 | 200.3 | 218.3 | 145.5 | 111.7 | 105.7 | 117.7 | 1.9 | 1.7 | 2.0 | <0.001 |
| Hypertension | 127.1 | 87.1 | 83.3 | 90.9 | 110.4 | 71.5 | 68.3 | 74.7 | 1.2 | 1.1 | 1.3 | <0.001 |
| Hearing loss | 97.2 | 79.9 | 74.2 | 85.6 | 75.8 | 56.7 | 52.4 | 61.1 | 1.4 | 1.3 | 1.6 | <0.001 |
| Chronic kidney disease | 112.5 | 68.7 | 65.3 | 72.0 | 102.3 | 61.0 | 58.2 | 63.7 | 1.1 | 1.0 | 1.2 | 0.002 |
| Asthma | 50.4 | 54.8 | 48.9 | 60.7 | 43.1 | 40.8 | 36.3 | 45.3 | 1.3 | 1.1 | 1.6 | 0.001 |
| Irritable bowel syndrome | 57.1 | 52.0 | 47.2 | 56.8 | 37.8 | 31.0 | 27.7 | 34.4 | 1.7 | 1.4 | 1.9 | <0.001 |
| Musculoskeletal disorders | 62.3 | 48.9 | 44.4 | 53.4 | 48.2 | 35.3 | 32.1 | 38.6 | 1.4 | 1.2 | 1.6 | <0.001 |
| Diabetes | 63.5 | 46.1 | 42.8 | 49.4 | 60.1 | 41.2 | 38.5 | 43.9 | 1.1 | 1.0 | 1.2 | 0.180 |
| Constipation | 53.3 | 39.3 | 35.4 | 43.1 | 38.3 | 23.8 | 21.6 | 26.0 | 1.7 | 1.4 | 1.9 | <0.001 |
| Cancer (diagnosis in last 5 years) | 53.8 | 38.1 | 35.1 | 41.1 | 26.8 | 16.9 | 15.3 | 18.5 | 2.3 | 2.0 | 2.6 | <0.001 |
- —Public Health Wales10.13039/100014609
Peer Reviews
No public reviews on file for this paper yet. If you reviewed it on a platform where reviews are public (OpenReview, ICLR, NeurIPS, ICML), you can paste yours below so the community can read it here.
Videos
No videos yet. Explain this paper in a talk, walkthrough, or lecture? Add one.
Taxonomy
TopicsChronic Disease Management Strategies · Health disparities and outcomes · Geriatric Care and Nursing Homes
Introduction
With an ageing population and increasing proportion managing complex health needs, unpaid carers play a significant role in providing care. Unpaid carer is ‘a person looks after, or give any help or support to family members, friends, neighbours or others’.1 It was estimated that there were over 400 000 unpaid carers in 2019 in Wales, UK and approximately 700 000 during the COVID-19 pandemic with the number expected to keep increasing in a foreseeable future.2^,^3
Providing care can be rewarding whilst having negative impact on unpaid carers’ own health but often overlooked.4^,^5 Studies found that high caring intensity had negative impact on unpaid carers mental wellbeing, and unpaid carers were more likely to suffer from anxiety, depression and other physical health conditions than non-carers.4^,^6–10 However, there is limited quantitative studies investigating the health needs of unpaid carers. Particularly, there is a lack of systematic data collection on unpaid carers in Wales, therefore conducting large scale data analysis to understand the inequalities and unpaid carers’ health condition becomes extremely difficult.11
This study aims to generate a reproducible e-cohort of unpaid carers in Wales utilizing routinely collected health and administrative data, and understand the health needs of this population group.
Methods
E-cohort of unpaid carers
Working with general practitioners, a list of Read codes was validated to identify unpaid carers.12 National Survey for Wales (NSW) 2016/17, 2017/18, 2018/19 and 2019/20 data and primary care dataset (from 1 January 2010 to 1 March 2022) were used to identify unpaid carers (Fig. 1). Anonymous Linking Field code was utilized to eliminate duplication. Demographic Service Database and Census 2011 were linked to obtain socio-demographic information.
Flow diagram of the creation of the e-cohort of unpaid carers in Wales.
A matched comparison group
Welsh residents who had not been identified as unpaid carers were randomly selected to form a comparison group matched with unpaid carers on sex, age and deprivation.13
Long-term health conditions and multimorbidity
Clinical codes used to identify 37 long-term health conditions in Cambridge Multimorbidity Score were used to scan primary care records14–16 (full list of 37 long-term health conditions can be accessed from CPRD@Cambardge—Codes List16). Presenting with two or more conditions was defined as multimorbidity. We retrospectively tracked the primary care records of unpaid carers and flagged up cases with long-term health conditions and multimorbidity.
Statistical analysis
In this study, all data were stored in the Secure Anonymised Information Linkage (SAIL) Databank where data linkage and analysis were conducted.17 Crude prevalence rate, adjusted prevalence rate, rate ratio of long-term health conditions and multimorbidity were produced. P < 0.05 was considered as statistically significant.
Results
E-cohort characteristics
Amongst 91 220 unpaid carers, approximately two-thirds were female (65.0% versus 50.7% in the general population) and a quarter were between 55 and 64 years old (24.7% versus 12.8%). In total, 5.5% of them were under the age of 25 and 16.5% were over 75. Distribution across deprivation quintiles was similar with mid-2018 Welsh population estimate.18
Prevalence of long-term health conditions and multimorbidity
Overall prevalence of long-term health conditions
Overall, the prevalence of all 37 long-term health conditions was significantly higher amongst unpaid carers than non-carers, except for peripheral vascular disease (P = 0.14) and multiple sclerosis (P = 0.64). The five most common conditions amongst unpaid carers were anxiety and/or depression (age-sex standardized rate18: 243.9 per 1000 population), hypertension (89.2), hearing loss (79.4), chronic kidney disease (72.6) and asthma (60.2) (Table 1). The conditions amongst non-carers were consistent with unpaid carers but at a lower prevalence. Amongst the 10 most prevalent conditions, the greatest difference between unpaid carers and non-carers were cancer (rate ratio 2.5, 95% CI 2.4–2.7), anxiety and/or depression (1.7, 1.7–1.8), constipation (1.7, 1.6–1.8) and musculoskeletal disorders (1.5, 1.4–1.6), see Table 1.
By age groups and deprivation
Anxiety and/or depression were the most prevalent condition in all age groups amongst unpaid carers except 75+ years group, with higher prevalence than non-carers. The difference between unpaid carers and non-carers decreased with increasing age. Rate ratio for anxiety and/or depression between unpaid carers and non-carers was 2.3 (95% CI 2.0–2.6) for under 25 years old and reduced to 1.5 (1.5–1.6) for 45–54 and over 75 year olds (Table 1). The prevalence of 8 conditions (amongst the top 10) was higher for unpaid carers living in the most deprived areas than the least except for hearing loss and cancer, e.g. anxiety and/or depression (287.6 per 1000 population versus 209.3 per 1000 population) and hypertension (88.1 versus 87.1). The difference between unpaid carers and non-carers was marginally higher in the most deprived areas except for anxiety and/or depression (rate ratios, the most: the least deprived quintile 1.6: 1.9) (Table 1).
Multimorbidity
Prevalence of multimorbidity was higher in unpaid carers compared to non-carers at all ages and deprivation quintiles. Over half of unpaid carers between the age of 64 and 75 live with multimorbidity (533.3 per 1000 population versus 391.9 amongst non-carers). The difference in multimorbidity was greatest amongst the younger population and declined with increasing age. Amongst the most deprived communities, unpaid carers under 25 had 3.5 times (CI 2.6–4.6) the rate of multimorbidity compared to non-carers and the rate ratio reduced to 1.3 (CI 1.2–1.4) for over 75. Within least deprived communities, rate ratio was 6.1 (CI 3.7–10.6) for under 25 and reduced to 1.3 (CI 1.2–1.4) for over 75 age group.
Conclusion/discussion
Main finding of this study
This study created a unique and reproducible e-cohort of unpaid carers in Wales with 91 220 identified. Findings suggested that unpaid carers experience poorer health comparing to non-carers and the gap exacerbated amongst younger groups and in deprived communities. The health needs of unpaid carers are usually overlooked due to the focus on the health of the carees and juggling with other responsibilities.
What is already know to this topic
Previous studies found providing care have detrimental impact on unpaid carers’ own health and wellbeing, whilst with limited quantitative evidence.
What this study adds
The e-cohort can be used for rapid analysis in research and evaluation towards tailor-made support for unpaid carers in future. From policy making perspective, health services and policy should take flexible approaches for unpaid carers to access healthcare and focus on early identification and prevention for highlighted groups and conditions.
Limitations of this study
There are certain limitations with this study. The identification of unpaid carers in routine data relies on the caring status to be recognized and recorded in surveys and clinical records. There are systematic differences in recording non-health patient information across healthcare settings. These barriers contribute to underestimating population size and bias in quantifying health needs, but highlighting the vital need of standardized approaches in recognizing and recording unpaid caring status.
The reference list from the paper itself. Each links out to its DOI / PubMed record.
- 1National Survey for Wales. Welsh Government.
- 2Carers Week 2020 Research Report: The Rise in the Number of Unpaid Carers During the Coronavirus (COVID-19) Outbreak. London: Carers UK, 2020.
- 3Unpaid Carers in Wales Feel Demoralised and Disillusioned. Cardiff: Carers Wales, 2019.
- 4Cottagiri SA, Sykes P. Key health impacts and support systems for informal carers in the UK: a thematic review. J Health Soc Sci 2019;4:173–98.
- 5State of Caring: A Snapshot of Unpaid Care in the UK. London: Carers UK, 2019.
- 6A Forgotten Army: Coping as a Carer. London: Future Care Capital, 2019.
- 7Kaddour L, Kishita N. Anxiety in informal dementia Carers: a Meta-analysis of prevalence. J Geriatr Psychiatry Neurol 2020;33(3):161–72.31409196 10.1177/0891988719868313 · doi ↗ · pubmed ↗
- 8Huang F, Bentley L, Cai Y et al. Unpaid carers in Wales: the determinants of mental wellbeing. Cardiff: Public Health Wales NHS Trust, 2021.