Correction: Reduction of NgR in perforant path decreases amyloid-β peptide production and ameliorates synaptic and cognitive deficits in APP/PS1 mice
Rong Jiang, Xue-Fei Wu, Bin Wang, Rong-Xiao Guan, Lang-Man Lv, Ai-Ping Li, Lei Lei, Ye Ma, Na Li, Qi-Fa Li, Quan-Hong Ma, Jie Zhao, Shao Li

Abstract
Genes, proteins, chemicals, diseases, species, mutations and cell lines named across the full text — each resolved to its canonical identifier and authoritative record.
Click any figure to enlarge with its caption.
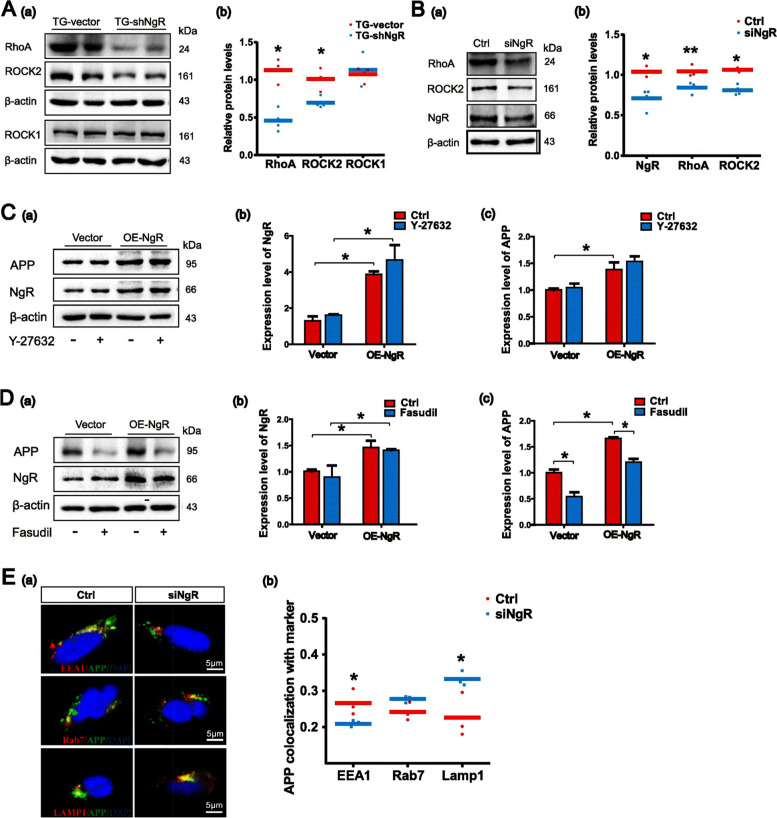 Figure 1
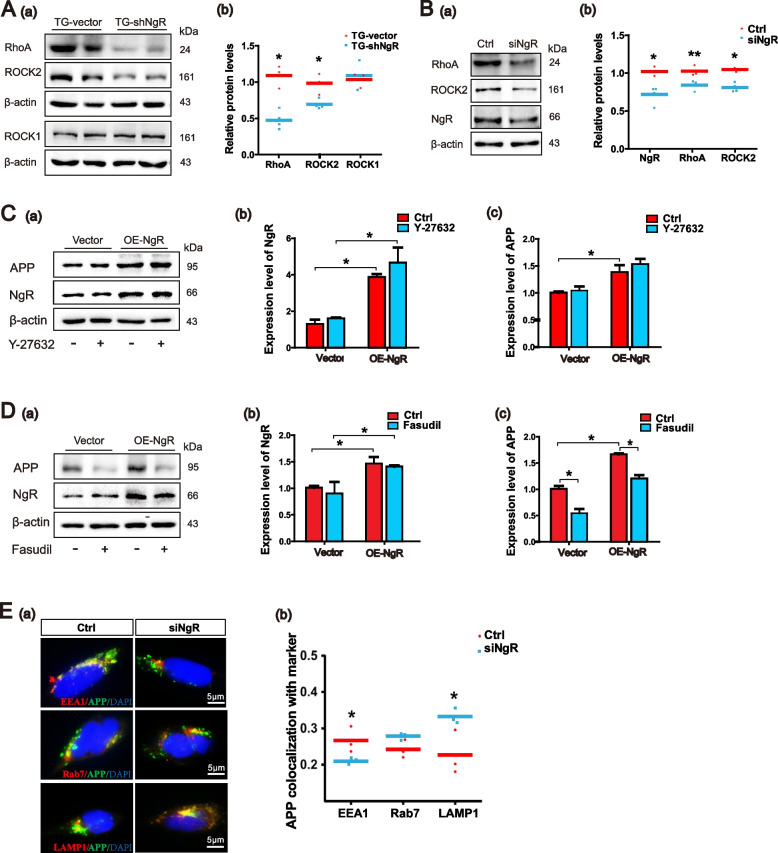 Figure 2
Peer Reviews
No public reviews on file for this paper yet. If you reviewed it on a platform where reviews are public (OpenReview, ICLR, NeurIPS, ICML), you can paste yours below so the community can read it here.
Videos
No videos yet. Explain this paper in a talk, walkthrough, or lecture? Add one.
Taxonomy
TopicsNerve injury and regeneration · Genetics and Neurodevelopmental Disorders · Neuroscience and Neuropharmacology Research
Correction: Alz Res Therapy 12, 47 (2020)
https://doi.org/10.1186/s13195-020-00616-3
Following publication of the original article [1], the authors identified an error in Fig. 6C (a).
The corrected Fig. 6C(a) with the correct band and original data is given hereafter.
The incorrect Fig. 6:Fig. 6. NgR reduction promotes APP trafficking to lysosomes by Rho/ROCK2 pathway. A (a, b) Representative bands of the Western blot and densitometry analysis of RhoA, ROCK1, and ROCK2 levels in APP/PS1 transgenic mice. n = 3–4 male mice/group. B (a, b) Western blot analysis showing the expression levels of RhoA and ROCK2 following siRNA-induced downregulation of NgR in APPswe/HEK293 cells. C, D APPswe/HEK293 cells were transduced with plasmid to overexpress NgR and exposed to Y-27632 (50 μM) and Fasudil (50 μM) for 10 h. C (a–c) Representative bands of the Western blot and densitometry analysis of NgR and APP levels by incubating Y-27632. D (a–c) Representative bands of the Western blot and densitometry analysis of NgR and APP levels by incubating Fasudil. E (a) APP colocalization with the following organelle markers: EEA1, Rab7, and LAMP1 were evaluated after knocking down NgR in APPswe/HEK293 cells. Representative images of APP (green) and organelle markers (red), with colocalization (yellow), are shown in the merged and zoom-in image. E (b) Quantitative analyses of APP and organelle marker staining. Scale bars 5 μm. Data are presented as mean ± SEM. n = 3–4. The statistical analysis was performed by Student’s t test and 2-way ANOVA. *P < 0.05; **P < 0.01
The correct Fig. 6:Fig. 6. NgR reduction promotes APP trafficking to lysosomes by Rho/ROCK2 pathway. A (a, b) Representative bands of the Western blot and densitometry analysis of RhoA, ROCK1, and ROCK2 levels in APP/PS1 transgenic mice. n = 3–4 male mice/group. B (a, b) Western blot analysis showing the expression levels of RhoA and ROCK2 following siRNA-induced downregulation of NgR in APPswe/HEK293 cells. C, D APPswe/HEK293 cells were transduced with plasmid to overexpress NgR and exposed to Y-27632 (50 μM) and Fasudil (50 μM) for 10 h. C (a–c) Representative bands of the Western blot and densitometry analysis of NgR and APP levels by incubating Y-27632. D (a–c) Representative bands of the Western blot and densitometry analysis of NgR and APP levels by incubating Fasudil. E (a) APP colocalization with the following organelle markers: EEA1, Rab7, and LAMP1 were evaluated after knocking down NgR in APPswe/HEK293 cells. Representative images of APP (green) and organelle markers (red), with colocalization (yellow), are shown in the merged and zoom-in image. E (b) Quantitative analyses of APP and organelle marker staining. Scale bars 5 μm. Data are presented as mean ± SEM. n = 3–4. The statistical analysis was performed by Student’s t test and 2-way ANOVA. *P < 0.05; **P < 0.01
Figure 6C(a) has been updated above and the original article [1] has been corrected.
The reference list from the paper itself. Each links out to its DOI / PubMed record.