Early experience with robotic pancreatoduodenectomy versus open pancreatoduodenectomy: nationwide propensity-score-matched analysis
Nine de Graaf, Maurice J W Zwart, Jony van Hilst, Bram van den Broek, Bert A Bonsing, Olivier R Busch, Peter-Paul L O Coene, Freek Daams, Susan van Dieren, Casper H J van Eijck, Sebastiaan Festen, Ignace H J T de Hingh, Daan J Lips, Misha D P Luyer, J Sven D Mieog

TL;DR
A nationwide study in the Netherlands found that robotic pancreatoduodenectomy is as safe as the traditional open method, with benefits like less blood loss and shorter hospital stays.
Contribution
This study provides the first nationwide propensity-score-matched analysis of robotic versus open pancreatoduodenectomy outcomes.
Findings
Robotic surgery had less blood loss and shorter hospital stays but longer operating times.
There were no significant differences in major complications or mortality between the two methods.
Centers performing at least 20 robotic procedures annually had better outcomes.
Abstract
Although robotic pancreatoduodenectomy has shown promising outcomes in experienced high-volume centres, it is unclear whether implementation on a nationwide scale is safe and beneficial. The aim of this study was to compare the outcomes of the early experience with robotic pancreatoduodenectomy versus open pancreatoduodenectomy in the Netherlands. This was a nationwide retrospective cohort study of all consecutive patients who underwent robotic pancreatoduodenectomy or open pancreatoduodenectomy who were registered in the mandatory Dutch Pancreatic Cancer Audit (18 centres, 2014–2021), starting from the first robotic pancreatoduodenectomy procedure per centre. The main endpoints were major complications (Clavien–Dindo grade greater than or equal to III) and in-hospital/30-day mortality. Propensity-score matching (1 : 1) was used to minimize selection bias. Overall, 701 patients who…
Genes, proteins, chemicals, diseases, species, mutations and cell lines named across the full text — each resolved to its canonical identifier and authoritative record.
Click any figure to enlarge with its caption.
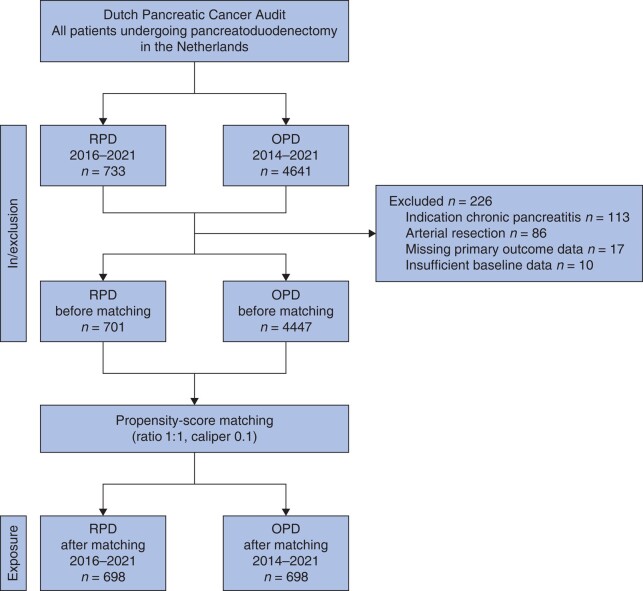 Fig. 1
| Full cohort, before propensity-score matching | Study cohort, after propensity-score matching | |||||||
|---|---|---|---|---|---|---|---|---|
| RPD ( | OPD ( | SMD | Variance ratio | RPD ( | OPD ( | SMD | Variance ratio | |
|
| ||||||||
| Age (years), median (i.q.r.) | 69 (62–75) | 69 (61–74) | 0.09 | 0.97 | 69 (62–75) | 69 (61–75) | 0.01 | 1.08 |
| Mean(s.d.) | 67.9(10.1) | 67.0(10.3) | 67.8(10.6) | 67.9(10.0) | ||||
| Female | 316 (45.1) | 2000 (45.0) | −0.01 | 315 (45.1) | 319 (45.7) | −0.02 | ||
| BMI (kg/m2), median (i.q.r.) | 25.1 (22.7–27.8) | 24.7 (22.3–27.5) | 0.08 | 0.84 | 25.1 (22.7–27.7) | 25.2 (22.7–27.9) | 0.01 | 0.81 |
| BMI >30 kg/m2 | 91 (13.0) | 552 (12.8) | 91 (13.0) | 105 (15.0) | ||||
| BMI >35 kg/m2 | 19 (2.7) | 135 (3.0) | 28 (3.6) | 19 (2.7) | ||||
| ASA grade | ||||||||
| I | 44 (6.3) | 437 (9.8) | −0.12 | 45 (6.4) | 46 (6.6) | −0.03 | ||
| II | 406 (57.9) | 2628 (59.1) | 422 (60.4) | 413 (59.2) | ||||
| III | 219 (31.2) | 1200 (27.0) | 228 (32.7) | 232 (33.2) | ||||
| IV | 2 (0.3) | 32 (0.7) | 3 (0.4) | 9 (1.3) | ||||
| Unknown | 30 (4.3) | 150 (.3.4) | – | – | ||||
| ECOG performance status | ||||||||
| 0–1 | 524 (74.8) | 3374 (75.9) | −0.13 | 521 (74.6) | 483 (69.2) | −0.06 | ||
| 2 | 19 (2.7) | 294 (6.6) | 19 (2.7) | 40 (5.7) | ||||
| 3 | 3 (0.4) | 50 (1.1) | 3 (0.4) | 5 (0.7) | ||||
| 4 | - | 2 (0.01) | - | - | ||||
| Unknown | 155 (21.8) | 727 (16.3) | 154 (20.5) | 169 (24.2) | ||||
| Updated adjusted Fistula Risk Score, median (i.q.r.) | 34 (20–49) | 25 (14–42) | 0.25 | 1.00 | 33 (18–48) | 30 (17–47) | 0.02 | 1.00 |
| Fistula risk categories | ||||||||
| Low risk ≤5% | 5 (0.7) | 77 (1.7) | −0.32 | 5 (0.6) | 5 (0.7) | −0.01 | ||
| Moderate risk 6–20% | 145 (20.7) | 1098 (24.7) | 196 (28.1) | 198 (28.4) | ||||
| High risk >20% | 416 (59.3) | 1967 (44.2) | 497 (71.2) | 495 (70.9) | ||||
| Unknown due to missing variables | 135 (19.3) | 1305 (29.3) | – | – | ||||
| Included in/after PORSCH trial | 487 (69.5) | 1851 (41.6) | 0.58 | 484 (69.3) | 490 (70.2) | −0.02 | ||
|
| ||||||||
| Localization | ||||||||
| Pancreas | 332 (47.3) | 2270 (51.0) | 0.10 | 330 (47.3) | 323 (46.3) | 0.10 | ||
| Peri-ampullary or CBD | 121 (17.3) | 531 (11.9) | 120 (17.1) | 138 (19.7) | ||||
| Duodenum | 40 (5.7) | 256 (5.8) | 40 (5.7) | 52 (7.5) | ||||
| Unknown | 208 (29.7) | 1390 (31.3) | 208 (29.8) | 132 (29.8) | ||||
| Suspected malignancy | 511 (72.9) | 3769 (84.8) | 0.03 | 552 (79.1) | 570 (81.7) | 0.02 | ||
| Preoperative tumour size (mm), median (i.q.r.) | 25 (18–35) | 26 (22–35) | 0.04 | 1.13 | 25 (18–35) | 25 (19–34) | 0.02 | 1.80 |
| Vascular involvement on preoperative imaging | ||||||||
| No | 571 (81.5) | 3043 (68.4) | 588 (84.2) | 589 (84.4) | ||||
| Yes | 106 (15.1) | 1238 (27.8) | −0.32 | 110 (15.8) | 108 (15.5) | 0.07 | ||
| Unknown | 24 (3.4) | 166 (3.7) | – | – | ||||
| Neoadjuvant therapy received | 60 (8.6) | 469 (10.5) | 0.11 | 81 (11.6) | 91 (13.0) | 0.04 | ||
|
| ||||||||
| Histological diagnosis | ||||||||
| Adenocarcinoma* | 481 (68.6) | 3505 (78.9) | −0.11 | 474 (67.9) | 512 (73.4) | −0.02 | ||
| Pancreas | 218 (31.1) | 1988 (44.7) | −0.17 | 218 (31.2) | 246 (35.2) | −0.15 | ||
| Distal bile duct | 97 (13.8) | 562 (12.6) | 0.09 | 96 (13.8) | 98 (14.0) | −0.09 | ||
| Ampulla | 118 (16.8) | 571 (12.8) | 0.14 | 118 (16.9) | 107 (15.3) | 0.10 | ||
| Duodenum/other | 40 (5.7) | 346 (7.8) | −0.06 | 42 (6.0) | 61 (8.7) | −0.10 | ||
| NET | 49 (7.0) | 196 (4.4) | 0.09 | 48 (6.9) | 35 (5.0) | 0.10 | ||
| IPMN | 89 (12.7) | 307 (6.9) | 0.17 | 88 (12.6) | 58 (8.3) | 0.12 | ||
| Intestinal adenoma | 39 (5.6) | 108 (2.4) | 0.14 | 39 (5.6) | 33 (4.7) | 0.07 | ||
| Other/unknown | 41 (6.0) | 331 (7.4) | −0.10 | 41 (5.9) | 52 (7.5) | −0.15 | ||
| Tumour size (mm), median (i.q.r.) | 25 (16–34) | 28 (20–38) | −0.20 | 25 (16–35) | 26 (18–38) | −0.17 | ||
| Full cohort, | Study cohort, after propensity-score matching | |||||
|---|---|---|---|---|---|---|
| RPD ( | OPD ( |
| RPD ( | OPD ( |
| |
|
| ||||||
| Pylorus-preserving PD | 145 (20.7) | 2435 (54.8) | <0.001* | 145 (20.8) | 335 (48.0) | <0.001* |
| Pylorus-resecting PD | 556 (79.3) | 2012 (45.3) | 553 (79.2) | 362 (52.0) | ||
| Operating time (min), median (i.q.r.) | 359 (304–424) | 312 (249–388) | <0.001* | 359 (303–424) | 301 (243–375) | <0.001* |
| Estimated blood loss (ml), median (i.q.r.) | 200 (100–450) | 500 (300–1000) | <0.001* | 200 (100–450) | 500 (265–900) | <0.001* |
| Conversion | 51 (7.3) | NA | 51 (7.3) | NA | ||
|
| ||||||
| Hard/firm | 170 (24.3) | 1544 (34.7) | <0.001* | 195 (27.9) | 207 (29.7) | 0.556 |
| Normal/soft | 462 (65.9) | 2439 (54.8) | 502 (71.9) | 490 (70.2) | ||
| Unknown | 69 (9.7) | 464 (11.5) | – | – | ||
|
| ||||||
| Wedge | 32 (4.5) | 465 (10.5) | <0.001* | 32 (4.6) | 59 (8.5) | 0.007* |
| Segment | 16 (2.2) | 277 (6.2) | <0.001* | 16 (2.3) | 24 (3.4) | 0.327 |
| Intraoperative drain placement | 640 (91.8) | 4293 (97.8) | <0.001* | 638 (91.4) | 676 (96.8) | <0.001* |
| Octreotide/pasireotide | 458 (65.7) | 2642 (60.4) | 0.008* | 456 (65.3) | 416 (59.6) | 0.010* |
|
|
|
|
|
| ||
| R margin | ||||||
| R0 | 128 (61.5) | 1024 (53.8) | 0.033* | 128 (60.1) | 131 (54.6) | 0.106 |
| R1/R2 resection | 80 (36.7) | 880 (44.3) | 0.092 | 80 (36.9) | 108 (45.0) | 0.234 |
| Unknown/missing | 10 (4.6) | 84 (4.2) | 5 (4.6) | 7 (2.9) | ||
| Lymph nodes | ||||||
| Total resected, mean(s.d.) | 15 (6) | 16 (8) | 0.044* | 14 (5) | 15 (7) | 0.008* |
| Ratio, median (i.q.r.) | 0.05 (0–0.2) | 0.09 (0–0.3) | 0.001* | 0.05 (0–0.2) | 0.08 (0–0.2) | 0.386 |
| Full cohort, before propensity-score matching | Study cohort, after propensity-score matching | |||||
|---|---|---|---|---|---|---|
| RPD ( | OPD ( |
| RPD ( | OPD ( |
| |
|
| ||||||
| Major complications (CD grade ≥III) | 283 (40.4) | 1324 (29.8) | <0.001* | 281 (40.3) | 253 (36.2) | 0.186 |
| CD grade IIIa | 174 (24.8) | 833 (18.7) | <0.001* | 172 (25.1) | 170 (24.8) | 0.811 |
| CD grade IIIb | 59 (8.4) | 257 (5.8) | 0.004* | 59 (8.7) | 43 (6.3) | 0.171 |
| CD grade IV | 27 (3.9) | 166 (3.7) | 0.878 | 27 (3.7) | 27 (3.7) | 0.991 |
| In-hospital/30-day mortality | 28 (4.0) | 148 (3.3) | 0.363 | 28 (4.0) | 21 (3.1) | 0.326 |
| Failure to rescue, % | 9.2 | 10.0 | 0.398 | 9.2 | 7.9 | 0.484 |
|
| ||||||
| Radiological | 227 (32.4) | 894 (20.1) | <0.001* | 225 (32.2) | 196 (28.0) | 0.203 |
| Endoscopic | 75 (10.7) | 286 (6.4) | <0.001* | 74 (10.6) | 59 (8.5) | 0.356 |
| Surgical reoperation | 68 (9.7) | 336 (7.6) | 0.061 | 67 (9.2) | 51 (7.3) | 0.170 |
|
| 176 (25.1) | 694 (15.6) | <0.001* | 174 (24.9) | 164 (23.5) | 0.578 |
| Grade C | 13 (1.9) | 111 (2.5) | 0.304 | 13 (1.9) | 16 (2.3) | 0.617 |
| PPH grade B/C | 88 (12.6) | 334 (7.5) | <0.001* | 87 (12.5) | 67 (9.6) | 0.111 |
| DGE grade B/C | 155 (22.1) | 860 (19.3) | 0.081 | 154 (22.1) | 156 (22.3) | 0.959 |
| Bile leak grade B/C | 59 (8.4) | 219 (4.9) | <0.001* | 59 (8.5) | 42 (6.0) | 0.135 |
| Chyle leak | 20 (2.9) | 217 (6.4) | <0.001* | 19 (2.7) | 47 (6.7) | 0.007* |
| Pneumonia | 43 (6.1) | 170 (4.7) | 0.089 | 43 (6.1) | 37 (5.3) | 0.732 |
| Wound infection | 52 (7.4) | 400 (9.0) | 0.008* | 52 (7.4) | 85 (12.2) | 0.008* |
| Transfusion during admission | 149 (21.3) | 754 (17.0) | 0.003* | 148 (21.2) | 139 (19.9) | 0.513 |
| Duration of hospital stay (days), median (i.q.r.) | 11 (7–19) | 12 (8–19) | <0.001* | 11 (7–19) | 12 (8–19) | <0.001* |
| Readmission | 147 (21.0) | 777 (16.3) | 0.017* | 147 (21.1) | 144 (20.6) | 0.296 |
| Full RPD cohort ( | Excluding the first 30 RPD cases per centre ( | High-volume centres (≥20 RPDs/year) ( | Lower-volume centres (<20 RPDs/year) ( | PDAC only ( | |
|---|---|---|---|---|---|
|
| |||||
| Operating time (min), median (i.q.r.) | 367 (314–429) | 357 (297–420) | 369 (327–4341) | 324 (306–427) | 351 (284–4467) |
| Estimated blood loss (ml), median (i.q.r.) | 211 (100–500) | 200 (100–400) | 200 (100–400) | 250 (100–550) | 300 (163–500) |
| Conversion | 51 (7.3) | 26 (5.6) | 33 (6.3) | 20 (11.2) | 17 (7.8) |
|
| |||||
| Major complication (CD grade ≥III) | 284 (40.5) | 198 (42.5) | 227 (43.4) | 60 (33.7) | 63 (28.9) |
| CD grade IIIa | 174 (24.8) | 118 (25.3) | 146 (27.9) | 28 (15.7) | 38 (17.4) |
| CD grade IIIb | 59 (8.4) | 43 (9.2) | 46 (8.8) | 13 (7.3) | 13 (6.0) |
| CD grade IV | 27 (3.9) | 18 (4.1) | 20 (3.8) | 6 (3.4) | 4 (1.8) |
| In-hospital/30-day mortality | 28 (4.0) | 19 (4.1) | 15 (2.9) | 13 (7.3) | 8 (3.7) |
| Failure to rescue, % | 9.2 | 9.6 | 6.6 | 21.6 | 12.7 |
| Re-interventions | |||||
| Radiological | 227 (32.4) | 160 (34.3) | 189 (36.1) | 38 (21.3) | 43 (19.7) |
| Endoscopic | 75 (10.7) | 52 (11.2) | 59 (11.3) | 16 (9.0) | 18 (19.7) |
| Surgical reoperation | 68 (9.7) | 43 (9.2) | 47 (9.0) | 21 (11.8) | 13 (6.0) |
| POPF grade B/C | 176 (25.1) | 133 (28.5) | 148 (28.3) | 28 (15.7) | 19 (8.7) |
| Grade C | 13 (1.9) | 6 (1.3) | 6 (1.1) | 7 (3.9) | 2 (0.9) |
| PPH grade B/C | 88 (12.6) | 64 (13.7) | 61 (11.7) | 27 (15.2) | 24 (11.0) |
| DGE grade B/C | 155 (22.1) | 97 (20.8) | 110 (21.0) | 45 (25.3) | 34 (15.6) |
| Bile leak grade B/C | 59 (8.4) | 40 (6.8) | 50 (9.6) | 92 (5.1) | 11 (5.0) |
| Chyle leak | 20 (2.9) | 17 (3.6) | 18 (3.4) | 2 (1.1) | 8 (3.7) |
| Pneumonia | 43 (6.1) | 132 (6.9) | 30 (5.7) | 13 (7.3) | 15 (6.9) |
| Surgical-site infections | 52 (7.4) | 330 (7.1) | 34 (6.5) | 18 (10.1) | 13 (6.0) |
| Transfusion during admission | 149 (21.3) | 103 (22.1) | 109 (20.8) | 40 (22.5) | 42 (19.3) |
| Duration of hospital stay (days), median (i.q.r.) | 11 (7–18) | 10 (7–21) | 11 (7–20) | 11 (7–17) | 8 (6–15) |
Peer Reviews
No public reviews on file for this paper yet. If you reviewed it on a platform where reviews are public (OpenReview, ICLR, NeurIPS, ICML), you can paste yours below so the community can read it here.
Videos
No videos yet. Explain this paper in a talk, walkthrough, or lecture? Add one.
Taxonomy
TopicsDiscourse Analysis and Cultural Communication · Security, Politics, and Digital Transformation
Introduction
Pancreatoduodenectomy (PD) is a complex procedure associated with a high risk of postoperative complications. Robotic pancreatoduodenectomy (RPD) has gained popularity based on reports from a few experienced, very high-volume centres^1–3^. RPD aims to reduce surgical trauma compared with open pancreatoduodenectomy (OPD) and hence could improve short- and long-term outcomes. However, some studies have reported safety concerns regarding the implementation of RPD into clinical practice^4–6^.
To facilitate the safe implementation of RPD in the Netherlands, the nationwide LAELAPS-3 training programme was performed in close collaboration with the University of Pittsburgh Medical Center (UPMC) group. This programme included virtual reality and artificial organ training, followed by on-site proctoring during the first RPD procedures^7^. Although early results from the programme seemed promising in selected patients, a direct comparison with OPD is lacking^8,9^. Randomized controlled trials comparing RPD and OPD are currently lacking and the existing comparative studies are often small retrospective single-centre studies, prone to treatment allocation bias^10–12^. This bias can go both ways; outcomes of RPD can appear better, because of the selection of fit patients early in the learning curve, but also worse, because of the selection of patients with small tumours (for example neuroendocrine tumours with a soft pancreas and/or small duct) and the inclusion of the learning curve effect.
Population-based propensity-score-matched studies comparing outcomes of RPD and OPD from the start of implementation into clinical practice have not been performed. Therefore, it is unclear whether the promising results of RPD from high-volume centres can be reproduced on a nationwide scale. Comparing the outcomes of RPD and OPD is needed to confirm the safety of implementing RPD on a large scale, especially during the learning curve^13^. The aim of this study was to assess the nationwide short-term surgical outcomes of RPD in the Netherlands, from implementation in eight centres during the past 6 years to current practice, and to compare these outcomes with those of OPD using a propensity-score-matched study design.
Methods
A multicentre propensity-score-matched retrospective cohort study was performed using data from the prospective and mandatory Dutch Pancreatic Cancer Audit (DPCA)^14^. All data were collected by trained medical staff. The DPCA database has been verified and the completeness of the data is greater than 90% (case ascertainment) and the accuracy of the data is greater than 95%^14^. For each patient, the DPCA collects the originally planned approach (open, laparoscopic, or robotic), as well as whether the surgery was converted to an open procedure. All consecutive patients who underwent elective RPD or OPD between 1 January 2014 and 31 December 2021, in all 18 Dutch centres for pancreatic surgery, were included (Fig. 1). The present study included all RPDs performed in the Netherlands, including the initial RPD procedure at each centre. Of the eight centres that performed RPD, seven participated in the LAELAPS-3 training programme^8^. No RPD procedures were performed in the Netherlands before the study interval. The STROBE guidelines^15^ were used for study design and reporting. The study protocol was approved by the scientific committee of the Dutch Pancreatic Cancer Group^16^. Ethical approval was waived by the institutional review board at the Amsterdam UMC due to coded data use.
Study flow chart of included patientsRPD, robotic pancreatoduodenectomy; OPD, open pancreatoduodenectomy.
Eligibility
Included were adult patients who underwent elective RPD or OPD for any pancreatic or peri-ampullary disease. Patients who underwent hybrid procedures (for example robotic resection with pancreatojejunostomy or hepatojejunostomy performed via laparotomy) were excluded, as were patients with chronic pancreatitis or cholangitis as an indication for surgery, planned/intended arterial resection, insufficient baseline data, or missing primary outcome data.
Primary and secondary outcomes
The primary outcomes were major complications (Clavien–Dindo grade greater than or equal to III) and in-hospital/30-day mortality^17^. Secondary outcomes included intraoperative parameters (for example operating time and intraoperative blood loss), procedure-specific complications (for example postoperative pancreatic fistula (POPF) and re-interventions), duration of hospital stay, and oncological outcomes (for example R0 resection rate and number of lymph nodes resected).
Surgical technique and definitions
In the Netherlands, RPD was implemented through a nationwide training programme using a standardized technique, based on the Pittsburgh approach^8^. The anastomosis technique in OPD was not standardized and based on local preference. All of the included centres, except for one, placed surgical drains after RPD and OPD. Preoperative variables included baseline characteristics, co-morbidities, preoperative imaging information for vascular/organ involvement (CT/MRI), ASA grade^18^, and Eastern Cooperative Oncology Group (ECOG) performance status^19^. Conversion during RPD was recorded if a laparotomy was performed for a reason other than specimen extraction^20^. The International Study Group on Pancreatic Surgery (ISGPS) definitions were used to classify POPF^21^, delayed gastric emptying (DGE)^22^, post-pancreatectomy haemorrhage (PPH)^23^, and chyle leak^24^. The International Study Group of Liver Surgery (ISGLS) grading system was used to define bile leakage^25^. Only clinically relevant complications (that is grade B/C) were included. The diagnosis of wound infection, pneumonia, and organ failure was based on clinical features; no predefined diagnosis was adapted in the DPCA. Failure to rescue was defined as the death of a patient due to a major postoperative complication^26,27^. Resection margin status was classified as microscopic radical resection (greater than 1 mm; R0), microscopic irradical (less than or equal to 1 mm; R1), or macroscopic margin involvement (R2). The DPCA collects outcomes during the entire hospital stay (that is regardless of duration) and up to 30 days after surgery in case of earlier discharge. For each patient, the baseline risk of POPF grade B/C was determined using the updated adjusted Fistula Risk Score (ua-FRS), which is validated for both open and minimally invasive PD^28^. The calculated scores were then assigned to one of three risk groups: low risk (less than or equal to 5%); moderate risk (6%–20%); and high risk (greater than 20%)^28^.
Propensity-score matching
Propensity-score matching was used to minimize treatment allocation bias^29^. The two treatment groups (RPD and OPD) were matched in a 1 : 1 ratio (standard caliper width of 0.1) on a set of predefined variables that may confound the comparisons. Covariates associated with the probability of undergoing RPD for each patient (that is the propensity score) were obtained from a logistic regression model (P < 0.100) and known cofounders were added (Appendix Table S1). The final covariates were age, BMI, ASA grade, sex, preoperative tumour size, vascular involvement on preoperative imaging, suspected malignancy, neoadjuvant therapy, year of surgery, preoperative fistula risk parameters (pancreatic texture and duct diameter on preoperative imaging), volume, and whether the PORSCH algorithm was implemented in the treatment centre. The PORSCH trial was a nationwide trial investigating an algorithm for the early detection and minimally invasive step-up management of patients after pancreatic resection, which reduced postoperative mortality^30^; this postoperative algorithm is currently still used in all centres included in the present study.
Sensitivity and subgroup analyses
A total of four sensitivity analyses were conducted. First, the impact of the learning curve on outcomes was assessed by excluding the first learning curve phase by excluding the first 30 RPDs per centre. Second and third, the impact of high-volume and lower-volume centres on outcomes was assessed by excluding RPDs from centres performing less than 20 RPDs annually (the recommended minimum annual volume per the Miami guidelines^13^) and greater than or equal to 20 RPDs annually respectively. Years were calculated starting from the date of the first RPD procedure at each centre. Fourth, the impact of pancreatic ductal adenocarcinoma (PDAC) on outcomes was assessed by excluding all indications other than PDAC. The association between the RPD sensitivity analyses and primary outcomes was assessed using ORs for major complications and in-hospital/30-day mortality. Last, the effect of major complications on postoperative recovery was assessed by determining the duration of hospital stay after RPD and OPD for patients with and without major complications.
Statistical analysis
Data were analysed using SPSS^®^ (IBM, Armonk, NY, USA; version 28.0) or the R programming environment (Rstudio), with propensity-score matching performed using the Rstudio Matching package (caliper 0.1).
All patients were analysed according to the intention-to-treat principle, hence conversions from RPD to OPD were included in the RPD group. The initially intended approach (RPD or OPD) is recorded in the DPCA. Continuous data are expressed as mean(s.d.) or median (interquartile range (i.q.r.)) and were compared using the two independent sample t test or the Mann–Whitney U test, as appropriate. Categorical data are presented n (%) and were compared using the chi-squared test or Fisher’s exact test, as appropriate. Additionally, log rank tests on Kaplan–Meier estimates were used to compare hospital stay between the groups of patients with and without major complications.
The standardized mean difference (SMD) was used to assess balance at baseline between groups, before and after propensity-score matching; small absolute values (less than 0.1) indicate balance. Missing baseline data of variables used for propensity-score matching were resolved by imputing five sets using multiple imputation with predictive mean matching (Appendix Table S2). Outcome data were not imputed. Subsequently, propensity-score matching was applied to the multiple imputed data sets in a 1 : 1 ratio without replacement. Descriptive statistics were generated by averaging the values across the imputed data sets according to Rubin’s rules and P values were computed by applying logistic regression models to the imputed data sets and subsequently pooling the causal effect estimates^31^. Statistical significance was set at P ≤ 0.050; all tests were two-sided.
Results
Overall, 733 patients who underwent RPD and 4641 who underwent OPD were included from 18 Dutch Pancreatic Surgery Group centres (Fig. 1); 8 centres started performing RPD during the study interval. The nationwide use of RPD among all PDs increased from 2.5% (14) in 2016, when the first centre started implementing RPD, to 24.9% (200) in 2021, when eight centres were performing RPD. After exclusion, 701 RPD patients from 8 centres and 4447 OPD patients from 18 centres were included. The median annual total PD volume (RPD and OPD combined) was 44 (i.q.r. 33–80) among the eight centres performing RPD and 26 (i.q.r. 23–34) among the centres that only performed OPD. The median annual volume of RPD was 20 (i.q.r. 16–27), which included the first RPD performed at every centre. In the final two study years (2020–2021), five of eight RPD centres met the Miami volume cut-off of 20 RPDs per year, whereas the other centres performed between 7 and 19 RPDs annually. The median total RPD experience was 86 procedures per centre (range 48–149). The same surgical team performed the RPD procedures in every centre. Of the eight centres, three had experience with laparoscopic PD before starting RPD. Of all included patients, 698 of 701 patients who underwent RPD were matched (1 : 1) to an OPD control.
Baseline characteristics
- shows the baseline characteristics before and after matching. Before matching, in the RPD group, less vascular involvement was seen on preoperative imaging (15% versus 28%; SMD −0.32) and fewer patients received neoadjuvant chemotherapy (8.6% versus 10.5%; SMD 0.11). The median ua-FRS was higher in the RPD group than in the OPD group (34 (i.q.r. 20–49) versus 25 (i.q.r. 14–42) respectively; SMD 0.25). More RPD procedures than OPD procedures were performed during or after the PORSCH trial (70% versus 42%; SMD 0.58). After propensity-score matching, most differences in baseline variables were minimized.
Operative outcomes
After matching, some differences in operative outcomes were observed (Table 2), with more often a pylorus-resecting procedure (79.2% versus 52.0%; P < 0.001), a longer operating time (median of 359 versus 301; P < 0.001), a lower estimated blood loss (median of 200 versus 500; P < 0.001), and fewer venous resections (4.6% versus 8.5%; P = 0.007) for RPD compared with OPD. The overall conversion rate was 7.3%.
Primary outcomes
- shows the details of the primary outcomes before and after matching. After matching, no significant differences in major complications (40.3% versus 36.2%; P = 0.186) and in-hospital/30-day mortality (4.1% versus 3.0%; P = 0.326) were found between RPD and OPD respectively.
Postoperative outcomes
After matching, no differences were observed in the rates of POPF grade B/C (24.9% versus 23.5%; P = 0.578), PPH grade B/C (12.5% versus 9.6%; P = 0.111), and DGE grade B/C (22.1% versus 22.3%; P = 0.959) after RPD and OPD respectively (Table 3). Lower rates of chyle leak grade B/C (2.7% versus 6.7%; P = 0.007) and wound infections (7.4% versus 12.2%; P = 0.008) were found after RPD. The rates of radiological intervention (32.2% versus 28.0%; P = 0.203) and surgical reoperation (9.2% versus 7.3%; P = 0.170) did not differ significantly between the RPD group and the OPD group respectively. Overall, the median hospital stay was shorter after RPD (11 days) compared with after OPD (12 days) (P < 0.001).
Sensitivity and subgroup analyses
- shows the study outcomes of the primary and sensitivity analyses of the RPD cohort and Appendix Fig. S1 shows the impact of the sensitivity analyses on primary outcomes after RPD and OPD.
The first sensitivity analysis regarding the impact of the learning curve (excluding the first 30 RPDs for every centre; 466) showed that it did not influence the rates of major complications, POPF, and mortality. The second sensitivity analysis regarding the impact of high-volume centres (excluding RPDs from centres performing less than 20 RPDs/year; 523) showed that they did influence the rates of major complications, POPF, and mortality. For the third sensitivity analysis, regarding the impact of lower-volume centres, a lower in-hospital/30-day mortality rate (2.9% versus 7.3%; P = 0.009) and a lower conversion rate (6.3% versus 11.2%; P = 0.032) were found comparing RPDs from high-volume centres (523) with RPDs from lower-volume centres (178) respectively. The fourth sensitivity analysis, including only patients with PDAC (218), showed that patients with PDAC had lower rates of major complications (28.9% versus 40.5%; P = 0.002) and POPF (8.7% versus 25.1%; P < 0.001) compared with the total RPD cohort, with a 7.8% conversion rate and a 3.7% in-hospital/30-day mortality rate.
For patients without major complications (413 RPD and 3059 OPD), the median hospital stay was 8 (i.q.r. 6–12) days after RPD compared with 10 ( i.q.r. 8–14) days after OPD (P < 0.001) (Appendix Fig. S2). For patients with major complications (283 RPD and 1324 OPD), the median hospital stay was 19 (i.q.r. 13–34) days after RPD compared with 20 (i.q.r. 14–33) days after OPD (P = 0.597).
Discussion
This nationwide propensity-score-matched cohort study provides a comprehensive assessment of the early nationwide experience with RPD compared with conventional OPD in the Netherlands. During the first 6 years of RPD implementation, no differences in major morbidity and in-hospital/30-day mortality were found. RPD was associated with a longer operating time, less intraoperative blood loss, lower rates of wound infection and chyle leak, and a 1 day shorter hospital stay (2 days for patients without major morbidity) compared with OPD. For patients with PDAC, RPD was associated with a similar R0 resection rate, but fewer retrieved lymph nodes. RPD was not associated with an increased risk of POPF; also not when stratified by ua-FRS risk categories. The present study also showed a lower in-hospital/30-day mortality rate (2.9% versus 7.3%; P = 0.009) and a lower conversion rate (6.3% versus 11.2%; P = 0.032) in centres performing greater than or equal to 20 RPDs annually compared with centres performing less than 20 RPDs annually.
Studies comparing nationwide outcomes of RPD and OPD from the start of RPD implementation have not yet been reported, making it difficult to contrast the results of the present study with corresponding benchmarks. Zureikat et al.^32^ compared 211 patients who underwent RPD in two specialized RPD centres that had completed the learning curve with 817 patients who underwent OPD in six high-volume centres and found no differences in mortality and short-term oncological outcomes. RPD was independently associated with a reduction in major complications, corrected for POPF risk factors, which was not observed in the cohort of the present study. The largest propensity-score-matched multicentre comparison of minimally invasive PD and OPD to date, conducted by the European Consortium on Minimally Invasive Pancreatic Surgery (E-MIPS), found no differences in postoperative mortality, major complications, and hospital stay^33^. However, a higher POPF rate after minimally invasive PD was found, which was no longer present after excluding patients who underwent a single-layer pancreatojejunostomy. Unfortunately, the study by Klompmaker et al.^33^ only included 184 RPD procedures. Furthermore, a meta-analysis including 2175 RPD procedures and 10 404 OPD procedures from 24 studies reported superior RPD outcomes regarding blood loss, wound infections, duration of hospital stay, R0 resections, and lymph node retrieval^34^. However, the meta-analysis also included non-matched studies, increasing the risk of selection bias.
The use of RPD is relatively high in the Netherlands (25% in 2021) compared with other national databases (for example 3% in the National Surgical Quality Improvement Program (NSQIP) data set)^35,36^. This rapid implementation of RPD was clearly facilitated by the nationwide LAELAPS-3 training programme. However, the learning curve has not yet been completed in all centres, as the current median total institutional RPD experience ranges from 48 to 149 RPD procedures. Several studies have reported a learning curve of 20–100 RPD procedures^4,37–40^. Therefore, the present study serves more to assess the overall safety of the nationwide implementation of RPD in selected patients and cannot be used to demonstrate or dismiss the superiority of RPD over OPD. To do so, a randomized trial is needed in centres that have completed the learning curve, such as the recently completed single-centre EUROPA pilot trial and the multicentre DIPLOMA-2 trial (ISRCTN27483786) and the ongoing PORTAL trial^41^.
The findings of the present study underscore the complexity of reproducing outcomes achieved by highly specialized pancreatic surgery centres, which benefit from a concentrated caseload and stringent patient selection, on a nationwide level. In contrast, RPD implementation across a country introduces additional variables, including case volume, patient diversity, and perioperative care. Furthermore, it should be noted that the present study included all RPD procedures performed in the Netherlands, including the very first procedure for each centre, most within the LAELAPS-3 training programme. A sensitivity analysis that excluded the first 30 RPDs per centre confirmed the absence of a strong learning curve effect on the results. The value of such a training programme is therefore confirmed.
Some studies reported concerns regarding an increased rate of POPF after minimally invasive PD^33^. Considering the outcomes of the total cohort in the present study, an increased rate of POPF after RPD was found. However, after adjusting for POPF risk factors, RPD was not associated with an increased rate of POPF. Only in the moderate-risk ua-FRS patient group was there a higher rate of POPF after RPD (Appendix Fig. S3). Similar results were reported in a similar single-centre propensity-score-matched study on RPD versus OPD^42^. Nevertheless, the overall POPF rate in the present study (24%) seems high compared with the 7–28% reported by others^10,42,43^. The high incidence of POPF in both groups in the present study may be partly attributable to the PORSCH trial, resulting in the early detection and minimally invasive treatment of POPF using radiological catheter drainage. The PORSCH algorithm reduced 90-day mortality in the intervention group compared with the control group (3% versus 5%; P = 0.029) and increased the detection of POPF, with a (non-significant) increase in the use of catheter drainage (29% versus 23%; P = 0.160)^30^. The PORSCH algorithm may be a contributing factor to the high POPF rate in the cohort of the present study. Additionally, the POPF rate in the matched OPD population was significantly higher than that in the pre-matched OPD cohort, illustrating the high-risk patient selection for RPD. Finally, the four published randomized trials on laparoscopic PD versus OPD found no differences in the rate of POPF, although no risk categories for POPF were reported^44–48^.
Finally, although not statistically significant, but of potential clinical relevance, the present study showed a higher margin-negative (R0) resection rate after RPD, both in the overall RPD cohort and in the subgroup analysis for PDAC alone. Conversely, the number of retrieved lymph nodes was significantly lower after RPD (14 versus 15 nodes). These contradictory findings could be explained by the residual confounding by indication. The oncological safety of RPD compared with OPD should be studied in future randomized trials, focusing on radical resection rates and, ideally, survival rates.
The present study should be interpreted considering the following limitations. First, although the data were retrieved from the nationwide and mandatory DPCA registry, missing data and therefore information bias could not be avoided. Second, data collection was limited to the established variables, thus limiting the analyses. For example, the following were lacking: reasons for conversion; reasons for reoperations; and mortality beyond 30 days. Third, the retrospective nature of the present study is a limitation, with inherent biases, such as treatment allocation bias. Despite an attempt to minimize the influence of treatment allocation bias, by applying propensity-score matching, outcomes may still have been influenced by unknown confounders. Only a randomized trial can eliminate this bias, such as the recently completed single-centre EUROPA trial (DRKS00020407) and the international multicentre DIPLOMA-2 trial (ISRCTN27483786) and the currently ongoing PORTAL trial^41^. Fourth, data on quality of life, use of adjuvant chemotherapy, and overall survival were not available for the present study. Clearly, these data are highly relevant and randomized trials will provide these outcomes. The strengths of the present study include its nationwide multicentre design, the inclusion of the very first RPD patient for each centre, the large study size, and the propensity-score matching, aiming to minimize selection bias.
Supplementary Material
znae043_Supplementary_Data
The reference list from the paper itself. Each links out to its DOI / PubMed record.
- 1Zureikat AH , Beane JD, Zenati MS, Al Abbas AI, Boone BA, Moser A Jet al 500 minimally invasive robotic pancreatoduodenectomies: one decade of optimizing performance. Ann Surg 2021;273:966–97231851003 10.1097/SLA.0000000000003550 PMC 7871451 · doi ↗ · pubmed ↗
- 2Napoli N , Kauffmann EF, Menonna F, Perrone VG, Brozzetti S, Boggi U. Indications, technique, and results of robotic pancreatoduodenectomy. Updates Surg 2016;68:295–30527614901 10.1007/s 13304-016-0387-7 · doi ↗ · pubmed ↗
- 3Nota CL , Molenaar IQ, te Riele WW, van Santvoort HC, Hagendoorn J, Borel Rinkes IHM. Stepwise implementation of robotic surgery in a high volume HPB practice in the Netherlands. HPB (Oxford)2020;22:1596–160332093965 10.1016/j.hpb.2020.01.018 · doi ↗ · pubmed ↗
- 4Napoli N , Kauffmann EF, Palmeri M, Miccoli M, Costa F, Vistoli Fet al The learning curve in robotic pancreaticoduodenectomy. Dig Surg 2016;33:299–30727215422 10.1159/000445015 · doi ↗ · pubmed ↗
- 5Chan KS , Wang ZK, Syn N, Goh BKP. Learning curve of laparoscopic and robotic pancreas resections: a systematic review. Surgery 2021;170:194–20633541746 10.1016/j.surg.2020.11.046 · doi ↗ · pubmed ↗
- 6Nakata K , Nakamura M. The current status and future directions of robotic pancreatectomy. Ann Gastroenterol Surg 2021;5:467–47634337295 10.1002/ags 3.12446 PMC 8316739 · doi ↗ · pubmed ↗
- 7Rice MJK , Hodges JC, Bellon J, Borrebach J, Al Abbas AI, Hamad Aet al Association of mentorship and a formal robotic proficiency skills curriculum with subsequent generations’ learning curve and safety for robotic pancreaticoduodenectomy. JAMA Surg 2020;155:607–61532432666 10.1001/jamasurg.2020.1040 PMC 7240650 · doi ↗ · pubmed ↗
- 8Zwart MJW , Nota CLM, de Rooij T, van Hilst J, te Riele WW, van Santvoort H Cet al Outcomes of a multicenter training program in robotic pancreatoduodenectomy (LAELAPS-3). Ann Surg 2022;276:e 886–e 89533534227 10.1097/SLA.0000000000004783 · doi ↗ · pubmed ↗