The Multivariate Regression Models Suggested as Standardising Tools for Categorising Solitarious and Gregarious Groups of the Main Pest Locust, Schistocerca gregaria, Produce Reproducible Results
Somia Saadi, Noureddine Bakkali, Rubén Martín-Blázquez, Abdelmounim Badih, Mohammed Bakkali

TL;DR
Researchers developed and validated two multivariate regression models to reliably classify desert locusts into solitarious or gregarious phases, which is important for studying locust outbreaks.
Contribution
The study validates two reproducible models for standardizing the classification of solitarious and gregarious desert locusts.
Findings
The models performed consistently on new locust samples, confirming their validity.
Both models successfully categorized solitarious, intermediate, and gregarious locust samples.
Recommendations were made to improve model precision in classifying nymph and adult locusts.
Abstract
Locusts can be at a state called the solitarious phase, associated with harmless populations, or at the gregarious phase, associated with outbreaks. Given the importance of the phenomenon, researchers are trying to reveal its molecular basis and find ways to tackle it. For this, assessing the phase state and comparing locusts is essential, and researchers have thus far used different formulae. To address the problem presented by the lack of standardised tools for such an essential task, we previously suggested two models as tools for standardising the method for assessing the main pest locust, Schistocerca gregaria. However, a theoretical work later cast doubts on the validity of such models and predicted that they would not work as well on future samples as in their initial application. Here, we use additional, different S. gregaria samples to test and assess the performance of these…
Genes, proteins, chemicals, diseases, species, mutations and cell lines named across the full text — each resolved to its canonical identifier and authoritative record.
Click any figure to enlarge with its caption.
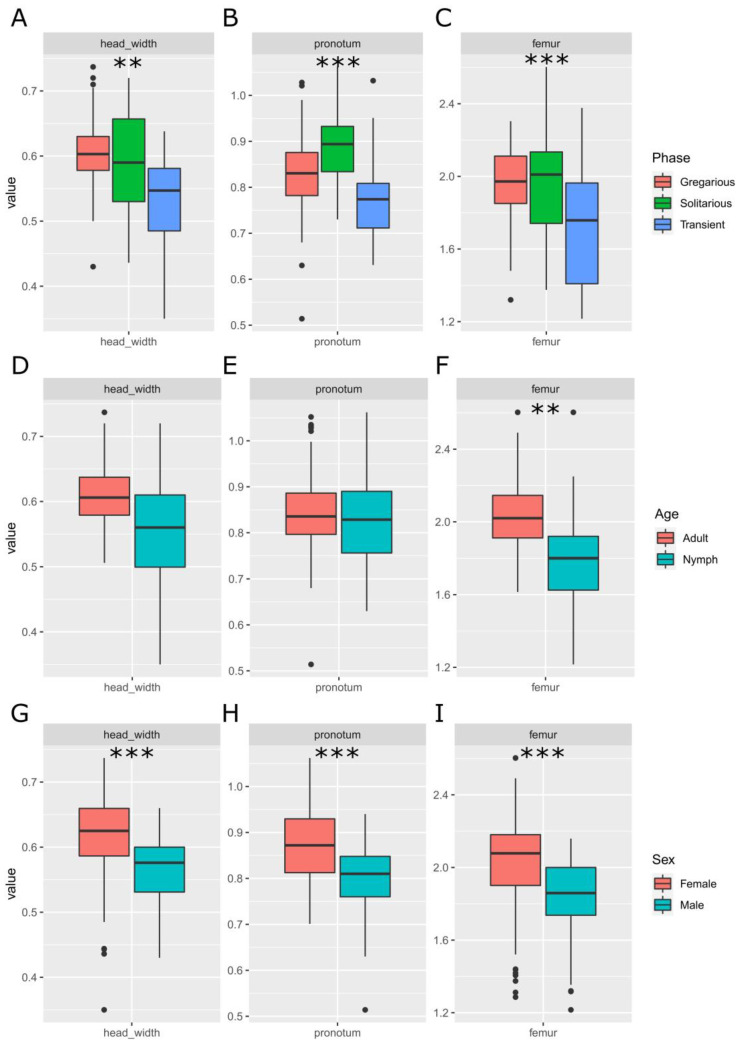 Figure 1
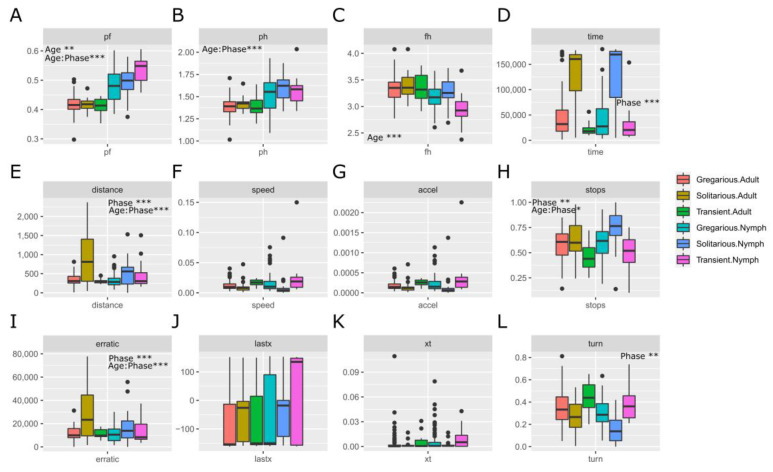 Figure 2
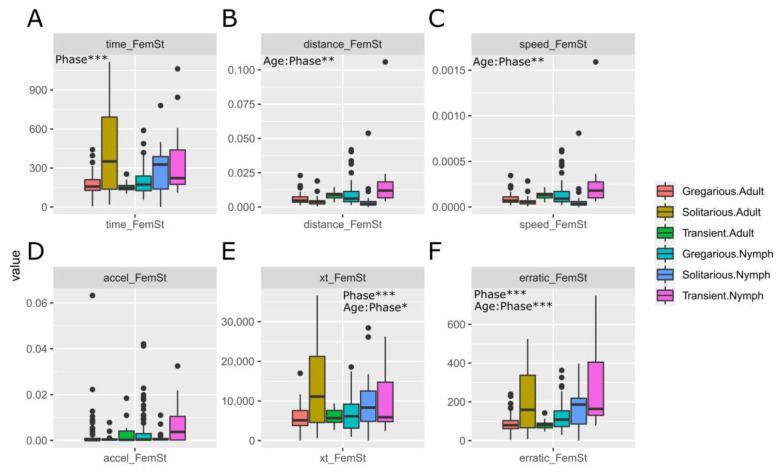 Figure 3
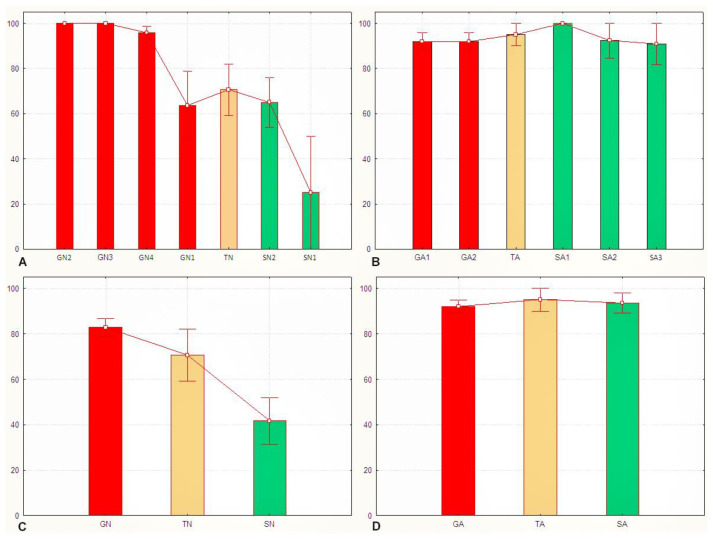 Figure 4
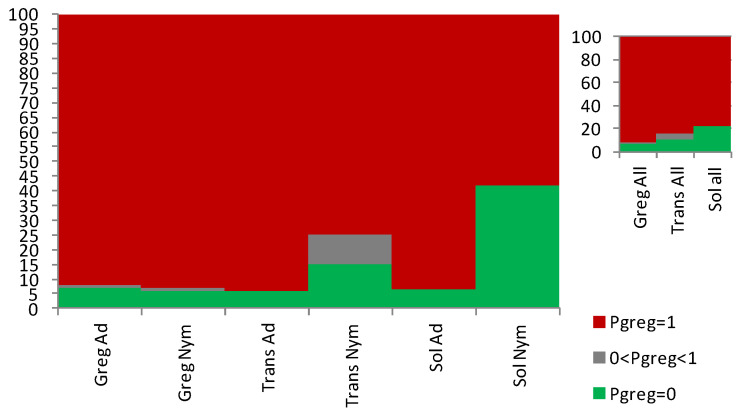 Figure 5
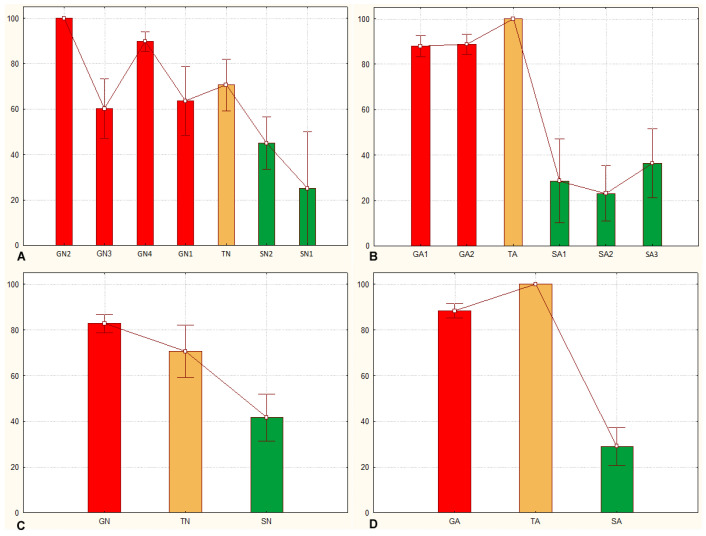 Figure 6
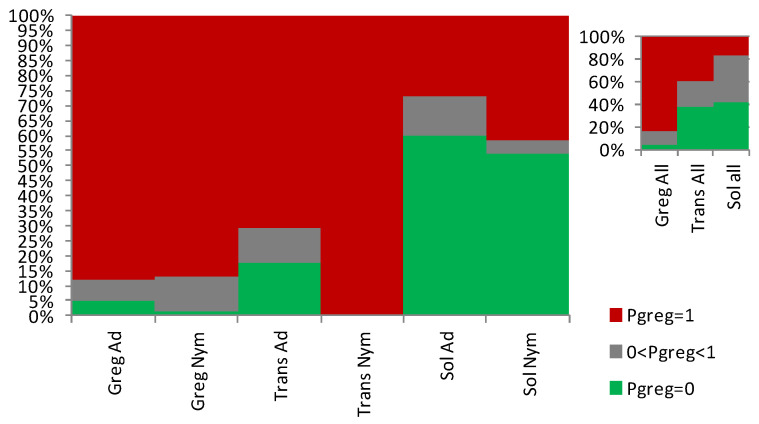 Figure 7
- —Agencia Estatal de Investigación, Ministerio de Ciencia e Innovación, Spain
- —ERASMUS+ International Dimension Programme at the University of Granada
Peer Reviews
No public reviews on file for this paper yet. If you reviewed it on a platform where reviews are public (OpenReview, ICLR, NeurIPS, ICML), you can paste yours below so the community can read it here.
Videos
No videos yet. Explain this paper in a talk, walkthrough, or lecture? Add one.
Taxonomy
TopicsInsect and Arachnid Ecology and Behavior · Neurobiology and Insect Physiology Research · Orthoptera Research and Taxonomy
1. Introduction
Locust outbreaks recurrently devastate vast regions around the globe. Different species are responsible for such devastation, including Locusta migratoria (mainly in Asia) [1], Melanoplus sanguinipes (in North America) [2], Schistocerca piceifrons and Schistocerca cancellata (in Latin America) [3,4], Dociostaurus maroccanus (in Southern Europe and Central Asia) [5] and Chortoicetes terminifera (in Australia) [6], among other species. Schistocerca gregaria, the desert locust, is considered the most devastating pest locust due to its broad distribution range (from Northwest Africa to India) [7,8] and to the damage it causes to regions that are already affected by extreme climates, poverty, war, and corruption [9]. The especially pressing need to find ways to prevent, protect, and help those areas against locust outbreaks makes S. gregaria a species of interest to science.
Like other locust species, S. gregaria is usually found living in low-population-density conditions, where individuals are at a state referred to as the solitarious phase, at which locusts display sedentary behaviour, social avoidance, and usually inconspicuous coloration. When climatic conditions change and become favourable, locusts experience an increase in their population size, and a subsequent series of physiological (e.g., [10,11,12,13]), behavioural (e.g., [14,15,16,17]), and morphological changes (e.g., [18,19]) occur. Their mobility increases, and they start aggregating onto the dense bands and massive swarms associated with their being in the gregarious phase during outbreaks. The differences between the two states (phases) of the locusts are adaptive responses to the change in the living environment that the locusts suffer. They co-occur in long-term solitarious and gregarious individuals. However, these differences are decoupled in short-term gregarious and solitarious locusts, meaning that solitarious locusts that have been just gregarised and gregarious locusts that are just solitarised will change behaviour but will not change colour and morphometry until their next moult(s) (e.g., [14,15,16,17,20]).
Molecular and genetic testing is becoming a common strategy in all the fields of research that study S. gregaria (e.g., [21,22,23]), and we are entering into an era of functional testing in non-model species. Accordingly, research on S. gregaria is, as predicted in [24], increasingly shifting towards functional studies in a quest for a better understanding and tackling of locust plagues. Comparing solitarious and gregarious locusts and assessing changes in the phase status of the locusts is key to such research. Logistic regression models are usually used for such assessment and comparisons of the locust phase status. However, new models have to be built by each laboratory and for each piece of experiment, and no agreed-upon model (tool) is available for standardising the way that the locust phase is assessed and how solitarious and gregarious locusts are categorised (e.g., [16,25,26]). In light of this serious problem, in 2017, we measured several morphological and behavioural traits (variables) from solitarious and gregarious S. gregaria locusts, and we assessed the correlation between the changes in each of these variables and the locust phase. The variables that correlated the most with the locust phase were used for model building, based on logistic regression formulae. The results of those formulae were transformed into probabilities of a locust being gregarious, where P_greg_ = 0 was assigned to solitarious and P_greg_ = 1 was assigned to gregarious locusts.
After testing on additional solitarious and gregarious locusts, we suggested the use of two logistical regression models as standardised tools to detect changes in S. gregaria locust phase status or to distinguish between solitarious and gregarious S. gregaria samples [27].
One of those two models, the Sg_extended_corrected model, is based not only on behavioural variables but also on selected morphological variables that were proven to correlate with the long-term phase status of S. grearia locusts. The other model, the Sg_non-morphometric model, included selected behavioural variables only. The first model was intended for experiments that compare different locust groups, including long-term solitarious and long-term gregarious locust groups and groups of nymphs that moulted during the experiment (i.e., animals whose morphology is not the same between the two ends of the comparison). The second model was intended for use on animals that do not change morphology between the two ends of the comparison (i.e., just solitarised and just gregarised locust groups that do not moult or change morphology during the experiment). A novelty that we introduced, compared to previous models, was that we normalised the movement-related variables—which are function of body size—using the animal’s femur (leg) size. The models were optimised and tested on different locust cages of different states (raised at different densities), sexes, developmental stages (adults and nymphs), and origins (populations). They were reasonably able to distinguish solitarious from gregarious S. gregaria samples in all the different sets. Nonetheless, the performance of the Sg_non-morphometry model was better than that of the Sg_extended_corrected model, with the latter deemed useless for adult samples. We therefore wrote that “we suggest using the ‘Sg_extended_corrected’ model (that includes morphometric variables) for comparing different S. gregaria nymph samples. For testing adults or the same nymphs at different time points (if they do not molt), we suggest using the ‘Sg_non-morphometric’ model (that does not include morphometric variables)” [27].
In silico re-application of the models to our data successfully reproduced the model’s outcomes, at least “with two-digit accuracy or better” [28]. Still, interpretations in the same work [28] cast doubts on the standardization possibility and on how the models were built, and led to predicting that the model “will not predict future observations as well as it appeared to predict on the present sample” [28]. Hence, the problem of the lack of valid tools to standardise how we compare and assess the phase status of S. gregaria locust samples re-emerged.
Since the prediction in [28] was based on theoretical analyses and interpretations and not on testing real locusts, here, we take advantage of the re-population and renewal of our laboratory locust colony—which was annihilated during the COVID-19 restriction period—in order to directly test and answer the question of whether the models would work in additional S. gregaria samples that are different from the ones tested in [27]. In the affirmative case, the models would be re-established as valid and possible standardising tools for the research community to use. Otherwise, the search for new tools would still be needed.
This work shows that, contrary to the prediction in [28], when used on additional, different, samples of actual solitarious and gregarious S. gregaria locusts, the models worked with similar performance and limitations as they did in [27]. We discuss the reproducibility of the results and validity of the models, and we refine our recommendations for using these models. We also signal the model’s advantages and limitations for time savings and, more importantly, for standardising the very important task of categorising S. gregaria samples for relevant research on that locust’s phase change and population outbreaks.
2. Materials and Methods
We used S. gregaria of different phases (solitarious, transient, and gregarious), stages (nymphs of different stages and adults), and sexes. The locusts were unrelated to the 12 sets of two origins that we used for the building and initial testing of the models in [27]. The personnel that reared the locusts and measured the variables and video-recorded the locusts was different from those who conducted the work in [27]. Furthermore, the personnel that applied the models using the gathered morphometric and behavioural data were unaware of (blind to) the locust rearing conditions and phases.
We raised the locusts at different densities, as described in [27]. Briefly, all the locusts shared some rearing conditions (31 degrees Celsius temperature, 14:10 light/dark period, and the same food—cabbage and corn flakes), while they differed in other rearing conditions (the phase-related ones). The solitarious locusts were raised each in an individual small cage in complete visual, mechanical (contact), and chemical (olfactory) isolation from other locusts, in order to prevent them from turning gregarious. The gregarious locusts were raised in groups in large cages that allow mechanical, visual, and olfactory contact between the locusts. The transient locusts were from a gregarious colony, but they were reared for one generation at lower density. The videos were taken at midday in the same room and a 60 × 60 × 60 cm observation arena as described in [27]. Two opposite sides of the observation arena were respectively separated from the control and stimulus using transparent glass. The control was an empty 60 × 60 × 60 cm wooden rearing cage that had a 60-watt light bulb turned on in the upper part of its back wall. We did not place locusts in that cage, in order to avoid accumulation of pheromones and other chemicals that might attract locusts. The stimulus was another 60 × 60 × 60 cm cage containing tens of gregarious locusts and a 60-watt light bulb turned on in the same place as in the empty (control) cage at the opposite side of the observation arena. The behavioural data were extracted from the videos using the R script provided in [27]. The morphometric data were measured for each individual after (not before) its video-recording—in order to avoid disturbing its behaviour. The probability of a locust being gregarious was separately calculated for each individual using the Sg_extanded_corrected and the Sg_non-morphometric models from [27]. The animals were tested only once—in order to avoid the effect of habituation. Animals that jumped straight to the arena’s walls were discarded; otherwise, the data were considered no matter how the animal behaved. The personnel that applied the models were blind to the state of the locusts, and no post-analysis filtering was applied to the data (i.e., data were considered even when they did not fit the individual locust’s phase status), in order to avoid subjective manipulation or bias of the results. Nymphs and adults were uncontrolled mixes of different sexes—since the models do not distinguish between sexes—and the nymphs were uncontrolled mixes of different stages—since the models do not distinguish between nymphal stages. First and second instar nymphs were not used in order to avoid the possible effect of mechanical damage when handling them; they are too small and fragile for the handling required for the morphometrical measurements and behavioural observations needed for the present work.
In total, we tested 279 additional S. gregaria locusts grouped into 11 sets: two sets of solitarious nymphs, three sets of solitarious adults, four sets of gregarious nymphs, and two sets of gregarious adults. In addition, we also tested two sets of gregarious adults and nymphs that were transferred since eclosion to lower density cages—referred to as transient adults and transient nymphs, respectively.
All the variables were already analysed as to their association with the locust phase, and they, as well as the methods used here, were as specified in [27]. As a reminder, the variables and formulae of both models are in Table 1 and, as the results of both models are interpretable at the group/sample not the individual level, the models were assessed based on the mean values they assigned to each locust set (i.e., the means obtained for solitarious nymphs, transient nymphs, gregarious nymphs, solitarious adults, transient adults, and gregarious adults).
In order to assess the differences between the locust samples, and before applying the models, the morphometric and behavioural variables that we extracted from the locust samples were analysed. For that, we used the ANOVA design: variable ~ Phase + Age + Sex + Phase * Age, where phase had the levels gregarious, solitarious, and transient; age had the levels adult and nymph; and sex had the levels female and male. The sex ratio of the samples was tested using the Chi squared test, and the Mann–Whitney test was used in Statistica 8.0 to compare the outcomes of each model between sample types. All other statistical analyses were performed using R project v4.1.2.
3. Results
3.1. Sets of Locusts Used Are Significantly Different from Each Other
Measurements of head width, pronotum length, and femur length showed statistically significant differences between phases (Figure 1A–C) and sexes (Figure 1G–I). Solitarious females showed higher values for femur and pronotum length, while gregarious females showed wider heads. With all of the mean values lower in nymphs, only femur length showed significant difference between the adults and nymphs (Figure 1D–F). The sex ratio of the sample was not biased (χ^2^2 = 2.847, p-value = 0.241).
None of the morphometric indices showed statistically significant differences between the current gregarious and solitarious samples (Figure 2A–C). Nevertheless, the pronotum to femur (P/F) and femur to head (F/H) indices showed differences between nymphs and adults. Both indices showed interactive effects of phase and age: solitarious nymphs showed higher values for these indices compared to gregarious nymphs, while adults showed no differences between phases but lower values compared to nymphs (p-value < 0.001 in both cases).
As expected, unlike gregarious locusts that rapidly went to the side of the arena where the gregarious stimulus was placed, solitarious locusts moved more slowly and randomly within the arena; thus, they showed higher values for the behavioural variables associated with less determination, hesitation, and lethargy (Figure 2D–L). They showed significantly longer elapsed time (Figure 2D)—i.e., it took them longer to reach the stimulus side of the arena, compared to the gregarious locusts, and some did not reach that side of the arena for the full 3 min of the test. They also showed significantly more turns (Figure 2L), meaning that they were less determined, hesitated, and moved more randomly compared to the gregarious locusts. They also travelled significantly longer distances (Figure 2E), stopped more (Figure 2H), and showed more erratic movement (Figure 2I) than the gregarious locusts—more signs of less determination in heading towards the stimulus—although the differences in these three last variables were age-dependent. In addition, elapsed time and turn ratio showed differences between gregarious and transient individuals (p-values 0.036 and 0.009, respectively). Stops showed differences only for transient individuals, and a statistically significant interaction between age and phase was also seen for that variable: while solitarious nymphs took more time static compared to gregarious nymphs, this tendency was inverted in adults. The individual and mean values of the analysed variables are given in Supplementary Tables S1 and S2.
We checked whether the statistical differences would change after normalization by femur length of six behavioural variables that are related to movement and that could therefore be affected by locust size (i.e., elapsed time, total distance, average speed, average acceleration, C/T, and erratic movement) (Figure 3A–F). Average speed and acceleration continued to not show statistical differences between gregarious and solitarious locusts, and elapsed time and erratic movement continued showing differences between such locusts. However, distance no longer was associated with significant differences between gregarious and solitarious locusts, while C/T—which is the last coordinate reached divided by the time spent to reach it—showed differences between the gregarious and the transient locusts.
3.2. The Sg_extended_corrected Model Is Not Accurate, although It Does Distinguish between Solitarious and Gregarious Nymphs
Application of the Sgextended_corrected model to S. gregaria nymphs allowed distinction between the solitarious and the gregarious ones. Accordingly, Figure 4A shows how solitarious nymphs had lower mean probability of being gregarious (P_greg mean ± SE = 0.65 ± 0.09) than gregarious nymphs (P_greg_ mean ± SE = 0.93 ± 0.03). Although the mean P_greg_ value for solitarious nymphs was higher than 0.5, the difference between solitarious and gregarious P_greg_ is statistically significant (Z-adjusted = 4.330, p < 0.0001). Indeed, the distribution of the P_greg_ values was clearly different between the solitarious and gregarious nymphs, although it had a relatively broad range, with some overlap observed (0.25 to 0.65 in solitarious nymphs, and 0.64 to 1.00 in gregarious nymphs). The standard deviations were clearly dependent on the sample sizes and, just as we found in [27], the model’s results are interpretable at the group and not the individual level (see Supplementary Tables S3–S5 for details).
For transient nymphs, the P_greg_ values were intermediate (0.71 ± 0.11), and statistics suggest that those nymphs became not significantly different from the solitarious group (Z-adjusted = −1.097, p = 0.273) and were no longer similar to the gregarious samples from where they came (Z-adjusted = 2.670, p = 0.008).
Taking all three independent nymph groups together (i.e., when increasing the sample size), the model shows even clearer separation of the gregarious, transient, and solitarious S. gregaria nymphs (Figure 4C).
Application of the Sg_extended_corrected model to adults gave mean P_greg_ values of 0.92 ± 0.06 for solitarious and 0.95 ± 0.05 and 0.92 ± 0.03 for transient and gregarious adults, respectively. Thus, as was the case in [27], it reproducibly failed to assign acceptable differences in P_greg_ values between solitarious and gregarious adult locusts: Z-adjusted = −0.271, p = 0.787 for solitarious versus gregarious adults, Z-adjusted = −0.213, p = 0.831 for solitarious versus transient adults, and Z-adjusted = −0.455, p = 0.639 for gregarious versus transient adults (Figure 4B,D and Supplementary Tables S4 and S5).
Overall, and although the adult samples sizes were larger than the nymph ones, when applied to both stages at once, the model discriminates between phases (Z-adjusted = 3.059, p = 0.002) but, as seen before, there is a significant difference between developmental stages (Z-adjusted = 2.378, p = 0.017). Based on the distribution of the P_greg_, Figure 5 confirms how this model works for nymphs but not for adults.
3.3. The Sg_non-morphometric Model Does Distinguish between Solitarious and Gregarious Locusts
As in [27], the Sgnon-morphometric model did distinguish well between the solitarious and gregarious nymphs, with P_greg mean ± SE values of 0.45 ± 0.09 and 0.83 ± 0.04, respectively (Z-adjusted = 4.452, p < 0.00001). It also distinguished between the solitarious and gregarious adults, with P_greg_ mean ± SE values of 0.29 ± 0.10 and 0.88 ± 0.03, respectively (Z-adjusted = 6.825, p < 0.000001) (Figure 6A,B). As in the previous model, transient locusts showed intermediate and gregarious P_greg_ means for nymphs (0.88 ± 0.08) and adults (1.00 ± 0.00), respectively. However, this model suggests that the transient nymphs and adults remained not statistically different from the gregarious group from which they came and did not become similar to solitarious locusts (Z-adjusted = −2.134, p = 0.033 for solitarious versus transient nymphs, Z-adjusted = 1.160, p = 0.246 for gregarious versus transient nymphs, Z-adjusted = −4.829, p = 0.000001 for solitarious versus transient adults, and Z-adjusted = −1.623, p = 0.105 for gregarious versus transient adults).
The model therefore again distinguishes solitarious from gregarious locusts in both nymph and adult stages (Figure 6C,D and Supplementary Tables S4 and S5) and, as was the case when we used the Sg_extended_corrected model, the transient adults show high P_greg_ in the Sg_non-morphometric model.
Overall, the Sg_non-morphometric model differentiates between phases better than the Sg_extended_corrected model (Z-adjusted = 8.062, p < 0.000001) while, contrary to the latter, it does not show any between-stage difference in performance (Z-adjusted = 0.889, p = 0.374). The distribution of P_greg_ further supports the better outcomes of the Sg_non-morphometric model both for nymphs and for adults (Figure 7).
4. Discussion
Locust outbreaks are a significant recurrent problem in several parts of the world, and outbreaks of the main pest locust, S. gregaria, are associated with the shift from the solitarious to the gregarious phase. The shift between phases occurs in response to changes in the environment (living conditions), and locusts of both phases show adaptations in the form of substantial differences in almost every aspect of their biology (see Section 1). In the absence of a clear qualitative or quantitative single morphological or behavioural marker that indicates the phase of a locust, some of the differences between solitarious and gregarious locusts could be combined so that we can infer the phase of the locusts or, at least, compare between locust groups or between different time points of the same locust group. This was thus far achieved using logistic regressions that combine different traits. The problem is that each single published work that differentiated between locust samples based on such methods used a different combination of traits and a different logistic regression formula (e.g., [16,25,26]). This not only implies spending time for building a new model for each experiment, it also means that the results might not be transferable or comparable between the different experiments and laboratories. Providing a time-saving tool is valuable for science, and standardising methods is a must. That is why we aimed in [27] at providing a solution to this problem in the form of an agnostic tool for time savings and for standardising the way solitarious and gregarious S. gregaria samples are categorised. However, the problem re-emerged after doubts were cast on the validity of such standardising tools [28], so that new models for research were required—thus again encountering the non-standardised realm—or the models that we suggested could be used under the risk of criticism on the basis that those models are doubtful or not valid.
Therefore, our aim in this study is to answer the question of the validity of those models, which if proven valid, would provide an even more trustworthy tool for solving the problem of the lack of standardised tools for S. gregaria sample categorization and phase assessment. That being said, we do not aim at characterising the phenomenon of locust outbreaks per se (an issue already approached in several earlier works [12,13,14,19,21,29,30,31,32,33,34,35,36,37,38,39] and that is still being analysed in current research). Neither do we aim at a simple repeat of a previous work; thus, we will not discuss every single result in the present work as, having successfully replicated our previous results, such discussion can be found in our earlier extensive work [27].
Nonetheless, we highlight that here, as in [27], preliminary analyses on the selected traits of adults and nymphs, males and females, and solitarious and gregarious S. gregaria showed expected size differences between males and females (with females generally larger) and between nymphs and adults (with adults generally larger). They also confirm that our solitarious and gregarious samples are indeed different (with both types of locust samples showing traits expected for their respective phase). They additionally reflect how no single morphological or behavioural trait is sufficient to distinguish between solitarious and gregarious S. gregaria groups.
The models that we test here introduce two novelties: normalization of the movement-related variables by the size of the locust and, in one model, inclusion of morphometric traits together with behavioural traits in the formula. Contrary to the insinuations in [28], we do not include colorimetry in the models, and we do not suggest that the models are applicable to other locust species (that is why we include “Sg” in the model names). In fact, we actually tested, proved, and suggested the contrary, and we suggested that similar studies should be carried out to determine the standardised features and models for assessing gregariousness in each species [27].
4.1. Should We Normalise by Locust Size?
This, in principle, should be as obvious as stating that dividing the distance travelled by the leg size of the traveller will allow more accurate comparison between the levels of activity of tall and short runners. Here, as in [27], we consider the fact that some movement (see behavioural) variables are a function of, and could be affected by, the animal’s size. Such an effect could distort the differences between solitarious and gregarious individuals. We corroborate this by showing how the variable distance (Figure 2E and Figure 3B), when not normalised by the animal’s size, shows a higher mean for solitarious locusts than for gregarious ones. Had we not normalised by femur length (a proxy of the animal’s size—as we explain in [27]), we would have had as a result and interpretation that the solitarious individuals walked greater distances in the observation arena, so they were more active than the gregarious individuals (which is contrary to what is proven and known about the differences between solitarious and gregarious S. gregaria). It is normalisation that attenuates the effect of the larger body size on the distance travelled by the solitarious locusts. Movement-related variables are undoubtedly a function of the leg size variable, so rather than introducing a leg-size effect (often vaguely described as morphology in [28]), the normalisation that we applied (a division) actually mathematically removes (or at least attenuates) the leg-size effect from the movement-related variables (often vaguely described as behaviour in [28])—introducing such an effect would be mathematically true had we added or multiplied by the leg size. So, for model building, we used the femur size (not a random morphological variable) for normalisation after explaining why it is the most suitable and valid proxy for leg and body size, and we normalised movement-related variables that we previously proved to be associated with S. gregaria phase (not a random behavioural variable). Given that the model’s regression coefficients are calculated based on the normalised movement-related variables, the weight (i.e., the regression coefficient) of each normalised variable is mathematically adequate for the values that that variable shows and for the association of such values with the locusts’ states. That being said, while larger individuals may well move longer distances, size is not the only reason solitarious individuals might travel larger distances than gregarious individuals. Solitarious locusts are more hesitant and lethargic (when they move, they wander about for a longer time, travelling greater distances in the observation arena). Gregarious locusts, however, quickly and directly move towards the stimulus (they take shorter paths and have a higher speed and acceleration). These characteristics reflect the direct movement seen in marching bands of gregarious locusts in the field.
4.2. Can Morphometry and Behaviour Be in the Same Model?
S. gregaria’s phase change involves either morphological and behavioural or only behavioural changes and is a dynamic phenomenon. Behaviour is the best indicator of phase state because locusts always change behaviour when they change phase. For its part, morphology can be an indicator of the phase, but this applies only to long-term solitarious and gregarious locusts. In addition, different S. gregaria samples will have morphological differences even when they are of the same phase, developmental stage, and sex.
At the same time, if one is to use variables in order to differentiate between two states, then one has to select the variables that significantly differentiate those two states and use as many variables as possible in order to be as accurate as possible. Hence, it is expected that the more variables that are associated with phase change that one considers, the closer one is to reality and to correctly inferring the phase of a locust sample. Using morphological and behavioural variables for distinguishing locust samples that differ in morphology and behaviour should therefore be a plus.
As an objection to introducing morphology, much was made of the potential situation of a locust that would be stimulated/induced into the gregarious phase and tested straightaway (non-long-term gregarious). It was claimed that because such locusts will not change morphology, using morphological variables in the model is erroneous [28]. That was quite surprising, given that in [27], we (i) explain that the models work at the group not individual level and, especially, (ii) we suggest using the Sg_non-morphology model, not the model that includes morphometry, for such locusts (i.e., those that do not change morphology).
4.3. Do the Models Do What We Want Them to Do?
Research on locust phase change is quite important and deserves standardised tools for one of its essential tasks—i.e., comparing locust groups. However, the message in [28] is that standardization of such tools is not possible. Moreover, the same author considered our models to be flawed and not recommended, and predicted that they “will not predict future observations as well as it appeared to predict on the present sample” [28]. These criticisms and predictions were based on theoretical evaluations (simulations) and some views and interpretations of proven and unproven concepts, but not on the actual application of the models to real locusts.
In experimental sciences, experiments are more trustworthy than interpretations of concepts, with the latter having to adapt to the empirical results and not the other way around—in fact, interpretation and indirect evaluation-based predictions themselves need testing.
Direct testing of the models by applying them to real locust samples is quick (a matter of minutes or, at most, a few hours), easy, and feasible (in [27], we provide the methods, formulae, and even a script to facilitate this task).
Here we re-evaluate and test the validity of the models as if we were working in a different laboratory. So, although the methods are exactly the same (as should be the case for a verification work), in the present study, the models are tested using additional independent samples of real locusts, and the researchers who carry out the observations and data collection are different from the ones in [27]; the researchers that apply the models are blind to the phase state of the analysed locusts.
In our original work [27], we suggested using the Sg_extended_corrected model (which includes morphometric variables) for comparing different S. gregaria nymph samples and the Sg_non-morphometric model (which does not include morphometric variables) for testing S. gregaria adults or the same S. gregaria nymphs at different time points (if they do not moult). This was successfully replicated in the present work, as (i) the Sg_extended_corrected model only predicts the phase for S. gregaria nymphs, and (ii) the Sg_non-morphometric model predicts the phase of both adults and nymphs of the same species.
Here, we successfully replicated the findings of [27], with the results that the two models are applicable only at the population (sample) and not the individual level and that distinguishing between samples of intermediate densities falls beyond these models’ sensitivity.
We therefore re-tested and corroborated again that the models built and initially tested in [27] can distinguish between solitarious and gregarious S. gregaria nymphs and adults. Although the models are useful for testing groups, but not single individuals, we highlight—as we did in [27]—that the experiments are conducted using samples (populations/groups) and not individual locusts, and that individual locusts might behave in a way that is not expected for their phase due to uncontrolled or even stochastic reasons. Thus, we confirm that the models suggested in [27] can be used for inferring the phase or for comparing samples/groups/populations of S. gregaria locusts (both different samples or the same sample between experimental times, e.g., when testing the effects of experimental manipulations such as the effect of drugs, gene silencing, etc., on the phase of S. gregaria). We thus reiterate that the use of these models would standardise and homogenise methodologies in benefit of reliable results and interpretations.
Testing, replication, and reproduction of the results are key to science, and science is based on hypotheses-driven results that are prone to testing and rejection and that should stand valid as long as they are capable of being reproduced. The models we suggest for inferring the phase of S. gregaria—for the sake of standardising methods between experiments and laboratories— were tested in two works, by different researchers, and using a total of 447 locusts pertaining to 25 different sets of S. gregaria locusts of different origin, densities, developmental stages, and sexes. The models consistently differentiate between solitarious and gregarious S. gregaria sets (see groups or populations). They, thus, should do so whenever they are used, a fact that allows us to confidently suggest their use for the benefit of standardising methodologies and saving time. The models were previously successful tested in [27], and when reapplied to our data from [27] by others, the models gave the same results, leading to the assertion that the models “appeared” to work “well” in our 2017 samples [28]. The successful testing of the models on the additional samples used in the current work hence further consolidates their validity and, contrary to the assumptions in [28], they are now even more valid than they were when initially suggested in 2017.
We highlight, as we did in [27], that the Sg_non_morphometric model works on adult and nymph samples and produces a better outcome compared to the Sg_extended_corrected model, which we suggest for different nymph samples and the same nymph sample if it changes morphometry (i.e., moults) between tests. Had we to choose only one model, we would recommend the Sg_non_morphometric model over the Sg_extended_corrected model. Of course, both models work only for S. gregaria and are better in larger samples sizes (as shown by the results when we pool all the samples of the same phase together).
So, contrary to the message in [28], we have shown here that standardisation of the models for categorising solitarious and gregarious locusts is possible and that the models that we suggested in [27] do work and are expected to work for future samples. We therefore prove here that there is a solution to the serious problem of the lack of standardised tools for categorising S. gregaria locusts and assessing their phase status, and that solution is the use of the models that we suggest.
That being said, the models, capable of correctly categorising solitarious and gregarious S. gregaria samples as thus far they have proven to be, are useful for different sample types, are not equally valid, are not optimal, and can no doubt be improved. We would certainly applaud anyone who can rebuild and improve them using larger sample sizes. As these models are species-specific, we also encourage colleagues working on other species to build and standardise tools for their work.
The reference list from the paper itself. Each links out to its DOI / PubMed record.
- 1Uvarov B. Grasshoppers and Locusts Cambridge University Press Cambridge, UK 1966
- 2Dingle H. Mousseau T.A. Scott S.M. Altitudinal variation in life cycle syndromes of california populations of the grasshopper, Melanoplus sanguinipes (f.)Oecologia 19908419920610.1007/BF 0031827228312753 · doi ↗ · pubmed ↗
- 3Waloff Z. Green S.M. Regularities in duration of regional desert locust plagues Nature 197525648448510.1038/256484 a 01160989 · doi ↗ · pubmed ↗
- 4Poot-Pech M.A. Ruiz-Sanchez E. Ballina-Gomez H.S. Gamboa-Angulo M.M. Reyes-Ramirez A. Olfactory response and host plant feeding of the central american locust schistocerca piceifrons piceifrons walker to common plants in a gregarious zone Neotrop. Entomol.20164538238810.1007/s 13744-016-0385-y 26957085 · doi ↗ · pubmed ↗
- 5Latchininsky A.V. Moroccan locust dociostaurus maroccanus (thunberg, 1815): A faunistic rarity or an important economic pest?J. Insect Conserv.1998216717810.1023/A:1009639628627 · doi ↗
- 6Key K. The regional and seasonal incidence of grasshopper plagues in Australia Coun. Sci. Industr. Res. Aust.193811787
- 7Waloff Z. Upsurges and Recessions of the Desert Locust Plague: An Historical Survey Anti-Locust Research Centre London, UK 1966
- 8Pedgley D. Desert Locust Forecasting Manual Centre for Overseas Pest Research London, UK 1981 Volumes I and II