Impact of insomnia upon inflammatory digestive diseases and biomarkers: a two-sample mendelian randomization research on Europeans
Lei Dai, Yunyan Ye, Joseph Mugaanyi, Caide Lu, Changjiang Lu

TL;DR
This study finds that insomnia is linked to certain digestive issues like esophageal ulcers and abdominal pain in Europeans.
Contribution
The study uses Mendelian randomization to explore causal links between insomnia and inflammatory digestive diseases.
Findings
Insomnia is associated with a higher risk of esophageal ulcers and abdominal pain.
There is suggestive evidence linking insomnia to other ulcers and hemorrhoidal disease.
No significant associations were found for most other digestive diseases or biomarkers.
Abstract
A number of observational studies indicate that insomnia is linked to inflammatory digestive diseases (IDDs). However, the definite relationship between insomnia and IDDs remains unclear. We obtained the publicly available data from genome-wide association studies (GWAS) to conduct two-sample Mendelian randomization (MR) for association assessment. Five MR analysis methods were used to calculate the odds ratio (OR) and effect estimate, and the heterogeneity and pleiotropy tests were performed to evaluate the robustness of the variable instruments (IVs). One exposure and twenty outcome datasets based on European populations were included in this study. Using the inverse variance weighted method, we found insomnia was closely correlated with esophageal ulcer (OR = 1.011, 95%CI = 1.004–1.017, p = 0.001) and abdominal pain (effect estimate = 1.016, 95%CI = 1.005–1.026, p = 0.003).…
Genes, proteins, chemicals, diseases, species, mutations and cell lines named across the full text — each resolved to its canonical identifier and authoritative record.
Click any figure to enlarge with its caption.
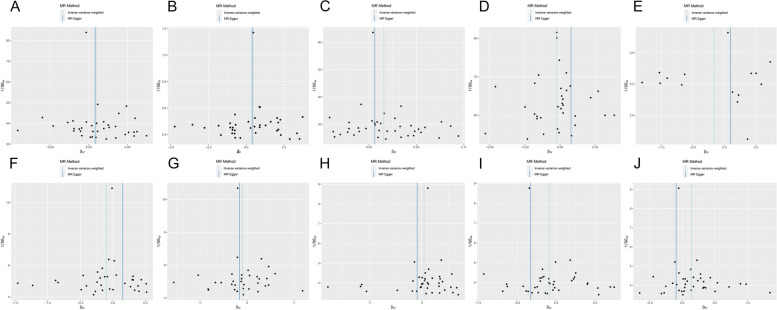 Figure 10
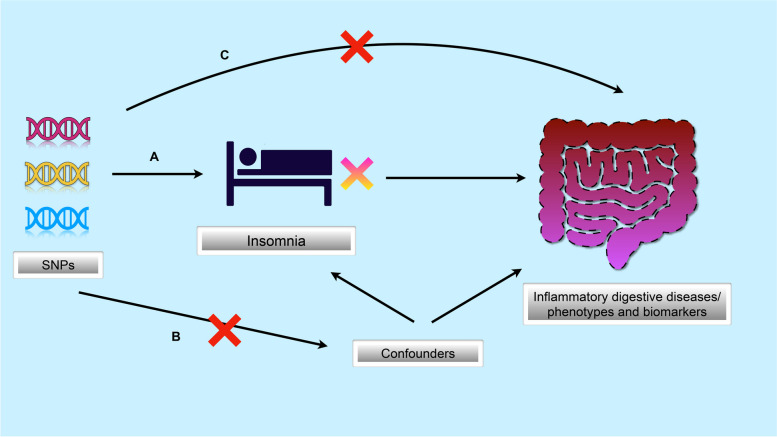 Figure 1
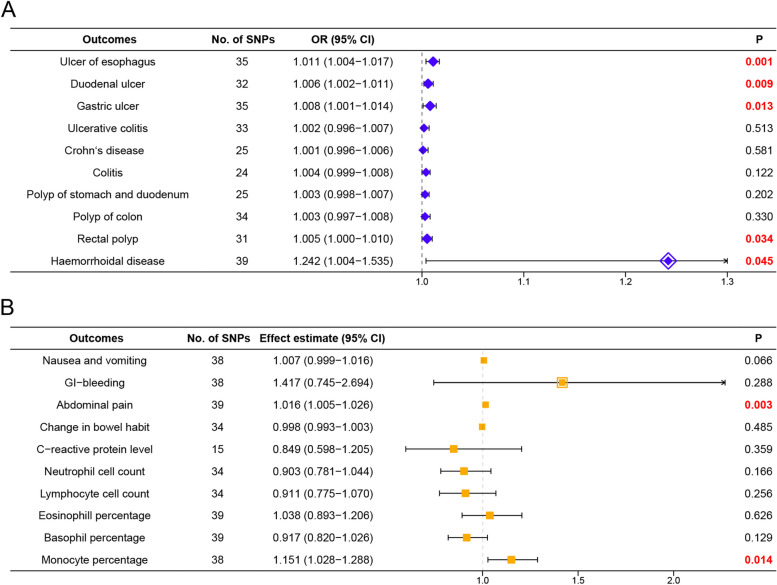 Figure 2
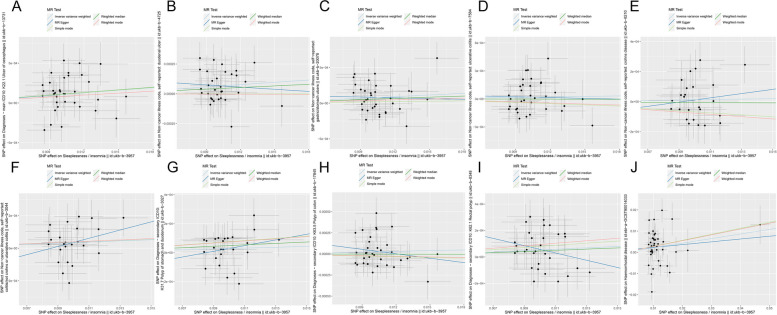 Figure 3
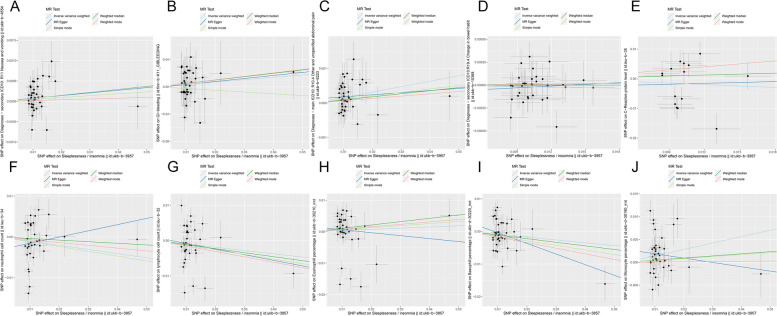 Figure 4
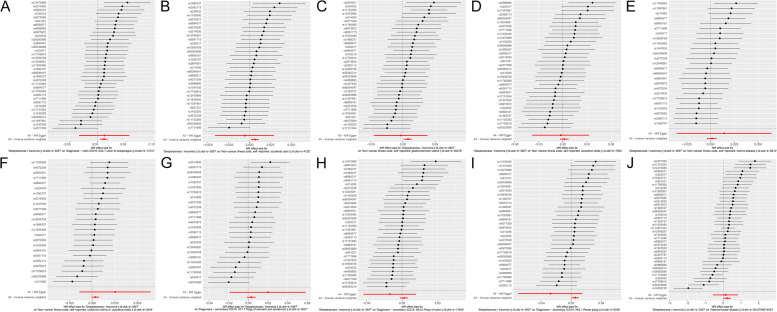 Figure 5
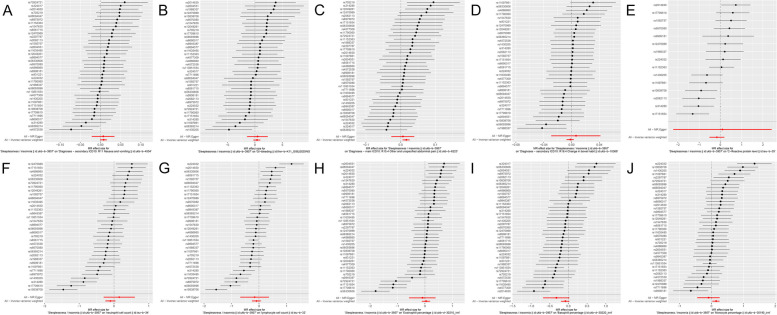 Figure 6
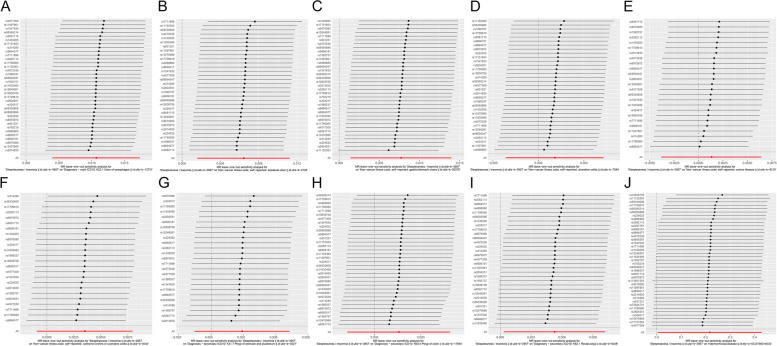 Figure 7
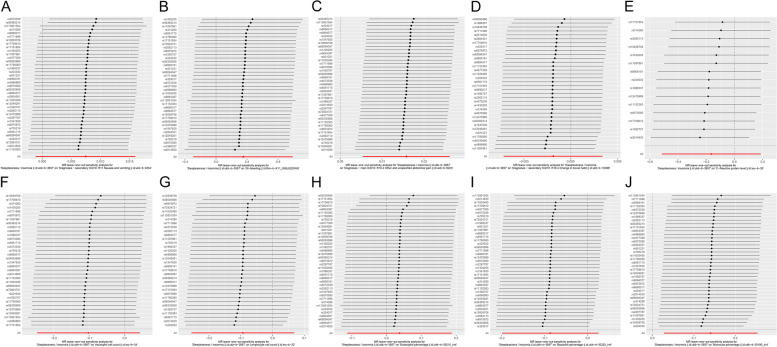 Figure 8
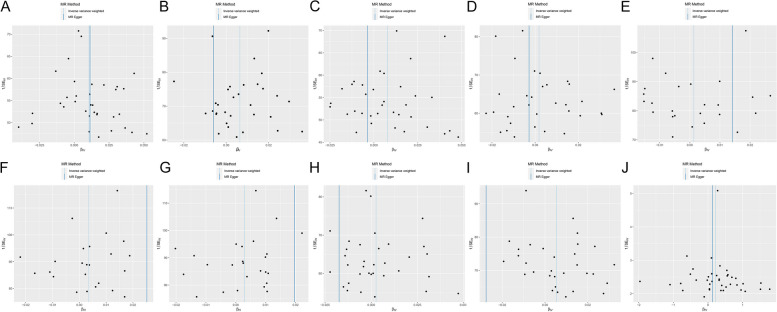 Figure 9
- —http://dx.doi.org/10.13039/100007834Natural Science Foundation of Ningbo
- —Ningbo Health Branding Subject Fund
Peer Reviews
No public reviews on file for this paper yet. If you reviewed it on a platform where reviews are public (OpenReview, ICLR, NeurIPS, ICML), you can paste yours below so the community can read it here.
Videos
No videos yet. Explain this paper in a talk, walkthrough, or lecture? Add one.
Taxonomy
TopicsEosinophilic Esophagitis · IL-33, ST2, and ILC Pathways · Gastroesophageal reflux and treatments
Introduction
Inflammatory bowel disease (IBD) is a chronic, non-specific intestinal inflammatory illness that mostly includes Crohn’s disease (CD) and ulcerative colitis (UC) [1]. The incidence of IBD has increased globally in recent years, particularly in Europe and developing countries, posing a significant clinical challenge [2–5]. Although its probable causes are unknown, the immune impairment viewpoint gives a full picture of the disease’s multi-factor origin [6]. Intestinal bacterial disorders are one of the reasons for the development of IBD, as confirmed by the randomized, controlled PRASCO trial (using the metagenome method) [7]. In addition, therapeutic nutrition was considered to be associated with IBD alleviation [8, 9].
More and more studies show that interrupted sleep and irregular day and night rhythms can cause severe damage to the gastrointestinal tract [10]. A prospective cohort study demonstrated that sleep insufficiency and daytime napping significantly increased the risk of IBD [11]. This potentially indicates that the ability to fine-tune our intestinal barrier and the normal interaction between the mucous immune system and microorganisms is disrupted when the rhythm of the central nervous system is disturbed during the day and night. On the contrary, another retrospective cohort study including 48,799 IBD patients found that IBD patients were correlated with a higher incidence ratio of insomnia with a hazard ratio (HR) of 1.99 [12]. Moreover, several studies also found a relatively consistent conclusion that IBD might promote insomnia, which could be illustrated as symptoms like pain worsened sleep quality [13–15]. A questionnaire study showed that 81% of 312 respondents said they believed there was an interaction between sleep and IBD [15]. However, the association between insomnia and IBD still remains undefined. Current research may contain a selection bias by its nature, requiring us to interpret the results with caution. A randomized controlled study on this issue is urgently needed to confirm the potential relationship.
Additionally, peptic ulcer disease(PUD) [16, 17] and intestinal polyp [18] were also considered to be potentially correlated with sleep duration. All of these inflammatory digestive diseases (IDDs) cause physical and mental suffering and a high medical burden for patients. Hence, it is of great clinical value to explore the potential association between them and insomnia to benefit patients through a lifestyle shift.
Mendelian randomization (MR) analysis is an epidemiological statistical technique that uses observational data to estimate causality. It has been widely used in inferring the potential causal relationships between an exposure and an outcome, owing to its advantage of minimizing the influence of confounders by introducing genetic variants as instrumental variables (IVs) [19, 20]. Using the characteristics of random allocation of allelic genetic polymorphisms, MR has largely overcome the disadvantages of reverse causality bias and ethical issues [21].
Here we extend the concept of IBD to IDDs, which include 10 benign gastrointestinal inflammatory diseases. Two-sample MR was performed to assess the potential associations between insomnia and inflammatory diseases/phenotypes/biomarkers. In this study, we aim to answer two core questions: (1) whether there are potential relationships between insomnia and IDDs (positive/negative). (2) whether potential links exist between insomnia and IDD-related phenotypes and biomarkers.
Materials and methods
Study design
The overview of study design and three core hypotheses for genetic IVs are demonstrated in Fig. 1: (1) Relevance hypothesis: single nucleotide polymorphisms (SNPs) are strongly correlated with insomnia (Fig. 1A); (2) Independence hypothesis: SNPs are independent of known confounders (Fig. 1B); (3) Exclusivity hypothesis: insomnia is the only approach for SNPs affecting IDDs/phenotypes/biomarkers (Fig. 1C) [22].Fig. 1 Three core assumptions of the MR study. A SNPs are closely associated with exposure (insomnia); B SNPs are independent of confounders; C SNPs only affect outcomes (inflammatory digestive diseases, phenotypes and biomarkers) through exposure of insomnia. MR, mendelian randomization; SNPs, single nucleotide polymorphisms
Exposure and outcome data
The open genome-wide association study (GWAS) database, based on scalable and high-performance cloud data infrastructure, supports complete GWAS summary datasets and metadata for the public (https://gwas.mrcieu.ac.uk/) [23]. This research was conducted using published data from GWASs of related traits in European individuals (both males and females included). The GWAS dataset for sleeplessness/insomnia (n = 462,341) was obtained from the MRC-IEU Consortium of the UK Biobank, in which estimated the correlation between insomnia and SNPs [24]. Ulcer of esophagus (n = 463,010), Duodenal ulcer (n = 462,933), Gastric ulcer (n = 462,933), Ulcerative colitis (n = 462,933), Crohn’s disease (n = 462,933), Colitis (n = 462,933), Polyp of stomach and duodenum (n = 463,010), Polyp of colon (n = 463,010) and Rectal polyp (n = 463,010) were obtained from the MRC-IEU Consortium [23]. Haemorrhoidal disease was obtained from the results reported by Zheng et al. [25]. For inflammatory digestive phenotypes, Nausea and vomiting (n = 463,010), Abdominal pain (n = 463,010), and Change in bowel habit (n = 463,010) were obtained from MRC-IEU Consortium [23]. Gastrointestinal (GI)-bleeding (n = 215,956) was obtained from the FinnGen biobank. As for inflammatory digestive biomarkers, C-reactive protein (CRP) level (n = 204,402) was derived from the results revealed by Ligthart et al. [26]. Neutrophil cell count (n = 563,946) and Lymphocyte cell count (n = 563,946) were achieved from Blood cell consortium [27]. Eosinophil percentage (n = 349,861), Basophil percentage (n = 349,861) and Monocyte percentage (n = 349,861) from Neale Lab. All the datasets were collected by using the TwoSampleMR R package. Details of all the datasets were summarized in Table 1. Table 1. Baseline characteristics of insomnia and inflammatory digestive diseases, phenotypes and biomarkersTraitGWAS IDYearAuthorPopulationSample SizeCase (n)Control (n)SNP (n)Sleeplessness/insomniaukb-b-39572018Ben ElsworthEuropean462,341--9,851,867Ulcer of esophagusukb-b-13,7312018Ben ElsworthEuropean463,0103,251459,7599,851,867Duodenal ulcerukb-b-47252018Ben ElsworthEuropean462,9331,908461,0259,851,867Gastric ulcerukb-b-20,0782018Ben ElsworthEuropean462,9333,329459,6049,851,867Ulcerative colitisukb-b-75842018Ben ElsworthEuropean462,9332,439460,4949,851,867Crohn’s diseaseukb-b-82102018Ben ElsworthEuropean462,9331,401461,5329,851,867Colitisukb-b-30442018Ben ElsworthEuropean462,9331,193461,7409,851,867Polyp of stomach and duodenumukb-b-30272018Ben ElsworthEuropean463,0101,233461,7779,851,867Polyp of colonukb-b-17,8452018Ben ElsworthEuropean463,0102,437460,5739,851,867Rectal polypukb-b-83482018Ben ElsworthEuropean463,0101,837461,1739,851,867Haemorrhoidal diseaseebi-a-GCST900140332021Zheng TEuropean944,133218,920725,2138,424,267Nausea and vomitingukb-b-45542018Ben ElsworthEuropean463,0106,773456,2379,851,867GI-bleedingfinn-b-K11_GIBLEEDING2021NAEuropean215,9564,992210,96416,380,464Abdominal painukb-b-62232018Ben ElsworthEuropean463,01011,925451,0859,851,867Change in bowel habitukb-b-10,3682018Ben ElsworthEuropean463,0102,443460,5679,851,867C-reactive protein levelieu-b-352018Ligthart, SEuropean204,402NANA2,414,379Neutrophil cell countieu-b-342020Vuckovic, DEuropean563,946NANANALymphocyte cell countieu-b-322020Vuckovic, DEuropean563,946NANANAEosinophill percentageukb-d-30210_irnt2018Neale labEuropean349,861NANA13,586,283Basophil percentageukb-d-30220_irnt2018Neale labEuropean349,861NANA13,586,283Monocyte percentageukb-d-30190_irnt2018Neale labEuropean349,861NANA13,586,283GWAS Genome-wide association study, SNP Single nucleotide polymorphism, NA Not available
Ethics statement
The GWAS summary-level data are publicly available and approved by their corresponding ethical review boards. Ethics approval was exempted for our study.
SNPs selection and validation
In the present research, SNPs linked with insomnia were chosen and confirmed as IVs if they fulfilled the three conditions listed below: (1) The genome-wide significance threshold level was defined as p < 5E-08; (2) The linkage disequilibrium of SNPs threshold was set at r ^2^ < 0.001 and Kb = 10,000 to avoid the bias caused by them [28]; (3) The F statistic was calculated to assess the strength of each IV. To mitigate the bias caused by a weak instrumental variable, each SNP included must satisfy the condition of *F-*value > 10 [29, 30]. The formula is as follows [31]:
\documentclass[12pt]{minimal} \usepackage{amsmath} \usepackage{wasysym} \usepackage{amsfonts} \usepackage{amssymb} \usepackage{amsbsy} \usepackage{mathrsfs} \usepackage{upgreek} \setlength{\oddsidemargin}{-69pt} \begin{document}$$F=(N-K-1)/K\times \frac{{R}^{2}}{1-{R}^{2}}$$\end{document} \documentclass[12pt]{minimal} \usepackage{amsmath} \usepackage{wasysym} \usepackage{amsfonts} \usepackage{amssymb} \usepackage{amsbsy} \usepackage{mathrsfs} \usepackage{upgreek} \setlength{\oddsidemargin}{-69pt} \begin{document}$${R}^{2}=2\times (1-MAF)\times MAF\times {\left(\frac{\beta }{SD}\right)}^{2}$$\end{document} \documentclass[12pt]{minimal} \usepackage{amsmath} \usepackage{wasysym} \usepackage{amsfonts} \usepackage{amssymb} \usepackage{amsbsy} \usepackage{mathrsfs} \usepackage{upgreek} \setlength{\oddsidemargin}{-69pt} \begin{document}$$SD=SE\times \sqrt{N}$$\end{document}Annotation: MAF: minor allele frequency = eaf.exposure; SE = se.exposure; \documentclass[12pt]{minimal} \usepackage{amsmath} \usepackage{wasysym} \usepackage{amsfonts} \usepackage{amssymb} \usepackage{amsbsy} \usepackage{mathrsfs} \usepackage{upgreek} \setlength{\oddsidemargin}{-69pt} \begin{document}$$\beta$$\end{document} = beta.exposure; N: no. of samples; K: no. of SNPs.
Secondly, PhenoScanner V2 (http://www.phenoscanner.medschl.cam.ac.uk/) was used to remove the SNPs of confounders related to the exposure and outcome [32, 33]. Thirdly, data harmonization was performed to align the effect alleles of IVs.
Statistical analysis
To estimate the potential association between insomnia and different IDDs/phenotypes/biomarkers comprehensively, random/fixed-effects inverse variance weighting (R/F-IVW), MR Egger, Weighted median, Simple mode and Weighted mode were performed for sensitivity analyses. The Mendelian estimates of different validity assumptions can be obtained from the above methods [34, 35]. We adopted IVW as the primary analysis method to report the odds ratio (OR) with 95% confidence intervals (CI), owing to its remarkable performance on accurate estimates and SNPs validation [36]. Additionally, MR-Egger regression and IVW were utilized to assess the heterogeneity of IVs. We utilized the MR-Egger interception method to test for pleiotropy and kicked out outliers via the MR-PRESSO method [37]. We conducted a leave-one-out analysis to evaluate whether and which individual SNPs could affect the overall estimates disproportionately. The Bonferroni correction method [38] was used to safeguard against the effect of multiple tests. Instead of using a p-value threshold of 0.05, p < 0.005 (α = 0.05/10 outcomes), p < 0.0125 (α = 0.05/4 phenotypes) and p < 0.008 (α = 0.05/6 biomarkers) were considered to be statistically significant for inflammatory digestive outcomes, phenotypes and biomarkers, respectively. If the Bonferroni-corrected value < p < 0.05, potential evidence of correlation was indicated, which needs further validation. We implemented all statistical analyses and visualizations employing the “Two-Sample MR” package [27] in R (version 4.0.3).
Results
Selection and validation of IVs
After screening, 42 SNPs that correlated strongly with insomnia in individuals of European descent were identified as IVs. All of them were verified to meet the criteria for IVs, with an F value > 10 (summarized in Table 2). Table 2. Single nucleotide polymorphisms used as instrumental variables in the Mendelian randomization analyses of insomniaSNPChrA1A2SEBetaMAFF-statisticsNearby geneP-valuers28032961CG0.001-0.0090.54433CALML67.30E-09rs120492611CG0.0020.0110.29347RP11-478L17.16.80E-12rs66900171GT0.002-0.0100.40946DAB11.10E-11rs26441281GC0.0010.0110.54851NAV11.00E-12rs45725382TC0.002-0.0100.36438PABPC1P27.70E-10rs563652142AC0.002-0.0150.15652LINC011225.60E-13rs45773092GA0.001-0.0090.53433MFSD61.00E-08rs124709892GA0.002-0.0100.20431MAIP12.80E-08rs1138515542TG0.0030.0470.057199MEIS12.90E-45rs560938962AC0.002-0.0120.21447IGKV1OR2-1087.70E-12rs20148303TC0.002-0.0120.30451SEMA3F-AS18.90E-13rs7052193AT0.0020.0130.88733RP11-384F7.21.20E-08rs98453873AC0.004-0.0220.04033LSAMP7.10E-09rs19883374GA0.0010.0080.55231CCSER12.10E-08rs110978614GA0.0020.0100.71637RP11-729M20.11.10E-09rs26045514GT0.002-0.0080.64030RP11-665G4.14.70E-08rs15927575CG0.0020.0100.35643RP11-6N13.14.30E-11rs77116965TG0.0020.0110.30548SMAD54.10E-12rs14302055TC0.0010.0090.46240TMEM161B-AS12.10E-10rs3142806GA0.0010.0100.54742LIN28B7.30E-11rs69759727GA0.002-0.0090.57936C7orf502.00E-09rs81808177CG0.002-0.0100.43144FOXP22.70E-11rs171518548TG0.0020.0130.15239MSRA3.80E-10rs117900609CT0.002-0.0100.33143RP11-165J3.65.80E-11rs22403210AG0.0010.0080.55032ALDH7A1P41.80E-08rs1770961010GA0.002-0.0100.29837ACTR1A9.50E-10rs229778710AT0.003-0.0180.08042CNNM29.60E-11rs7292472111TC0.0030.0160.07333CFL11.10E-08rs1083870811AG0.002-0.0090.45940PSMC32.90E-10rs6809404712TC0.0020.0100.25136MYO1H1.70E-09rs93122112AT0.0020.0110.23737RP11-788H18.11.30E-09rs32401712CA0.002-0.0100.70537NAB21.40E-09rs957008013CT0.002-0.0110.34445RPP40P21.60E-11rs656171513AT0.002-0.0120.63157RP11-384G23.14.80E-14rs154763013AG0.0020.0090.65234SNORD445.80E-09rs488686015CG0.002-0.0120.76745PML1.80E-11rs1163549515CT0.0010.0090.51240IQCH-AS12.80E-10rs206211316CT0.002-0.0100.56841AC040163.11.60E-10rs989457717AG0.0020.0130.31868HEXIM11.30E-16rs990618117GA0.002-0.0090.68831KCNJ122.40E-08rs1115236318AG0.0020.0160.18666TCF44.50E-16rs5633060619GA0.0020.0090.37937ZNF585B1.20E-09SNP Single-nucleotide polymorphisms, Chr Chromosome, A1 Effect allele, A2 Other allele, SE Standard error, *MAF *Minor allele frequency
MR sensitivity analysis
We assessed the potential associations between insomnia and inflammatory digestive diseases, phenotypes and biomarkers in people of European descent mainly using the IVW approach. The results showed that insomnia might be positively correlated with all IDDs at the genetic level, while no statistically significant association was found for ulcerative colitis, Crohn’s disease, colitis, polyp of colon and polyp of the stomach and duodenum (all p > 0.05). Based on the analysis, we speculated that there might be a potential relationship between insomnia and ulcer of the esophagus (OR = 1.011, 95%CI = 1.004–1.017, p = 0.001). However, only suggestive evidence of positive associations was observed in duodenal ulcer (OR = 1.006, 95%CI = 1.002–1.011, p = 0.009), gastric ulcer (OR = 1.008, 95%CI = 1.001–1.014, p = 0.013), rectal polyp (OR = 1.005, 95%CI = 1.000-1.010, p = 0.034) and haemorrhoidal disease (OR = 1.242, 95%CI = 1.004–1.535, p = 0.045) (Fig. 2A). For most IDDs, the results of MR-Egger and weighted-median analyses revealed approximate estimates of lower exactness (Table 3). No obvious evidence of horizontal pleiotropy was detected (all p > 0.05). Based on the heterogeneity test, the fixed-effects model was applied to most IDDs except haemorrhoidal disease (p = 1.04E-08) which adopted the random-effects model to alleviate the effect of heterogeneity (Table 3).Fig. 2 Associations of genetically predicted insomnia with inflammatory digestive diseases, phenotypes, and biomarkers. A Effect of insomnia on inflammatory digestive diseases using IVW analysis; B Effect of insomnia on inflammatory digestive phenotypes and biomarkers using IVW analysis. IVW, inverse-variance weighted; CI, confidence interval; OR, odds ratio; SNPs, single nucleotide polymorphismsTable 3Associations between genetically predicted insomnia and inflammatory digestive diseases in sensitivity analyses using the weighted-median and MR-Egger methodsOutcomeWeighted MedianMR-EggerHeterogeneityPleiotropyOR (95%CI)POR (95%CI)PQPInterceptPUlcer of esophagus1.011 (1.002–1.020)0.0171.011 (0.967–1.058)0.62341.840.167-6.95E-060.977Duodenal ulcer1.004 (0.998–1.011)0.2030.994 (0.959–1.030)0.74026.640.6901.29E-040.490Gastric ulcer1.006 (0.997–1.014)0.2010.996 (0.955–1.039)0.86536.150.3681.20E-040.594Ulcerative colitis1.000 (0.992–1.007)0.9540.997 (0.962–1.033)0.87730.970.5194.85E-050.798Crohn’s disease0.999 (0.992–1.007)0.8881.014 (0.965–1.066)0.58428.550.2371.30E-040.618Colitis1.004 (0.997–1.010)0.2661.026 (0.986–1.067)0.22022.420.4952.16E-040.286Polyp of stomach and duodenum1.005 (0.999–1.011)0.1171.020 (0.981–1.060)0.33121.160.6291.68E-040.403Polyp of colon1.000 (0.992–1.007)0.9520.983 (0.947–1.020)0.36636.630.3042.11E-040.293Rectal polyp1.005 (0.998–1.012)0.2030.973 (0.932–1.015)0.21430.820.4253.33E-040.139Haemorrhoidal disease1.317 (1.071–1.619)0.0091.141 (0.568–2.294)0.713108.531.04E-081.00E-030.805CI Confidence interval, MR Mendelian randomization, OR Odds ratio
For inflammatory digestive phenotypes, the IVW analysis demonstrated that insomnia potentially correlated with abdominal pain (effect estimate = 1.016, 95%CI = 1.005–1.026, p = 0.003). Additionally, genetically predicted liability to insomnia might be positively correlated with nausea and vomiting and GI-bleeding, although no statistically significant results were obtained. To our surprise, an inverse association between insomnia and change in bowel habit (effect estimate = 0.998, 95%CI = 0.993–1.003, p = 0.485) was observed, although the result was not statistically significant (Fig. 2B). As to inflammatory biomarkers, except for the suggestive evidence of a positive relationship between insomnia and monocyte percentage (effect estimate = 1.151, 95%CI = 1.028–1.288, p = 0.014), no statistically significant association between insomnia and other biomarkers was observed (all p > 0.05) (Fig. 2B). Consistent with above, MR-Egger and weighted-median analyses revealed approximate estimates but of lower exactness (Table 4). No obvious evidence of horizontal pleiotropy was detected (all p > 0.05). According to the heterogeneity test, the fixed-effects model was applied to inflammatory digestive phenotypes, while the random-effects model was applied to inflammatory digestive biomarkers (Table 4). Table 4. Associations between genetically predicted insomnia and inflammatory digestive phenotypes and biomarkers in sensitivity analyses using the weighted-median and MR-Egger methodsOutcomeWeighted MedianMR-EggerHeterogeneityPleiotropyEE (95%CI)PEE (95%CI)PQPInterceptPNausea and vomiting1.007 (0.995–1.019)0.2341.007 (0.979–1.035)0.65343.210.2231.09E-050.947GI-bleeding1.639 (0.639–4.204)0.3041.561 (0.237–10.290)0.64627.990.857-1.19E-030.915Abdominal pain1.009 (0.993–1.025)0.2741.006 (0.973–1.040)0.71737.490.4931.15E-040.553Change in bowel habit1.000 (0.993–1.007)0.9981.006 (0.971–1.043)0.73128.200.705-8.57E-050.651C-reactive protein level1.109 (0.789–1.559)0.5521.103 (0.109–11.179)0.93543.966.01E-05-2.72E-030.826Neutrophil cell count0.962 (0.859–1.076)0.4961.165 (0.743–1.826)0.512169.742.56E-20-3.09E-030.250Lymphocyte cell count0.892 (0.797–0.999)0.0470.853 (0.506–1.437)0.554215.171.32E-287.92E-040.797Eosinophill percentage1.112 (0.986–1.253)0.0840.910 (0.561–1.475)0.704152.871.03E-151.57E-030.577Basophil percentage0.895 (0.792–1.011)0.0750.722 (0.507–1.027)0.07884.242.36E-052.85E-030.170Monocyte percentage1.048 (0.936–1.173)0.4180.909 (0.640–1.293)0.60086.816.99E-062.82E-030.175CI Confidence interval, MR Mendelian randomization, EE Effect estimate
Scatter plots of the association between insomnia and IDDs/phenotypes and biomarkers showed similar results (Figs. 3 and 4). Forest plot displayed each SNP’s influence on the associations between insomnia and IDDs/phenotypes and biomarkers (Figs. 5 and 6). For additional confirmation, the leave-one-out sensitivity analysis showed that no particular SNP altered the total estimates of IVs excessively, which was consistent with previous results (Figs. 7 and 8). The absence of horizontal pleiotropy was also confirmed by the funnel plot (Figs. 9 and 10).Fig. 3 Scatter plot of the association of insomnia with inflammatory digestive diseases. A Ulcer of the esophagus; B Duodenal ulcer; C Gastric ulcer; D Ulcerative colitis; E Crohn’s disease; F Colitis; G Polyp of stomach and duodenum; H Polyp of the colon; I Rectal polyp; J Haemorrhoidal disease. Each dot represents an SNP, which is plotted with standard error bars by the estimate of SNP on individual sleep condition and the estimate of SNP on the risk of inflammatory digestive diseases. The slopes of the lines correspond to estimates calculated using each of the five approaches. SNP, single nucleotide polymorphismFig. 4 Scatter plot of the association of insomnia with inflammatory digestive phenotypes and biomarkers. A Nausea and vomiting; B GI-bleeding; C Abdominal pain; D Change in bowel habit; E C-reactive protein level; F Neutrophil cell count; G Lymphocyte cell count; H Eosinophill percentage; I Basophil percentage; J Monocyte percentage. Each dot represents an SNP, which is plotted with standard error bars by the estimate of SNP on individual sleep condition and the estimate of SNP on the risk of inflammatory digestive phenotypes and biomarkers. The slopes of the lines correspond to estimates calculated using each of the five approaches. GI, gastrointestinal; SNP, single nucleotide polymorphismFig. 5 Forest plot of the association of insomnia with inflammatory digestive diseases. A Ulcer of the esophagus; B Duodenal ulcer; C Gastric ulcer; D Ulcerative colitis; E Crohn’s disease; F Colitis; G Polyp of stomach and duodenum; H Polyp of the colon; I Rectal polyp; J Haemorrhoidal disease. The dot and bar estimate the effect of each SNP related to insomnia on the risk of inflammatory digestive disease. SNP, single nucleotide polymorphismFig. 6 Forest plot of the association of insomnia with inflammatory digestive phenotypes and biomarkers. A Nausea and vomiting; B GI-bleeding; C Abdominal pain; D Change in bowel habit; E C-reactive protein level; F Neutrophil cell count; G Lymphocyte cell count; H Eosinophill percentage; I Basophil percentage; J Monocyte percentage. The dot and bar estimate the effect of each SNP related to insomnia on the risk of inflammatory digestive disease. GI, gastrointestinal; SNP, single nucleotide polymorphismFig. 7 Leave-one-out sensitivity analysis of the association of insomnia with inflammatory digestive diseases. **A **Ulcer of the esophagus; B Duodenal ulcer; C Gastric ulcer; D Ulcerative colitis; E Crohn’s disease; F Colitis; G Polyp of stomach and duodenum; H Polyp of the colon; I Rectal polyp; J Haemorrhoidal disease. The dot and bar demonstrate the sensitivity of IV by removing SNPs one at a time. IV, instrument variable; SNPs, single nucleotide polymorphismsFig. 8 Leave-one-out sensitivity analysis of the association of insomnia with inflammatory digestive phenotypes and biomarkers. A Nausea and vomiting; B GI-bleeding; C Abdominal pain; D Change in bowel habit; E C-reactive protein level; F Neutrophil cell count; G Lymphocyte cell count; H Eosinophill percentage; I Basophil percentage; J Monocyte percentage. The dot and bar demonstrate the sensitivity of IV by removing SNPs one at a time. IV, instrument variable; SNPs, single nucleotide polymorphisms; GI, gastrointestinalFig. 9 Funnel plot of the association of insomnia with inflammatory digestive diseases. A Ulcer of the esophagus; B Duodenal ulcer; C Gastric ulcer; D Ulcerative colitis; E Crohn’s disease; F Colitis; G Polyp of stomach and duodenum; H Polyp of the colon; I Rectal polyp; J Haemorrhoidal disease. Each black dot indicates a single nucleotide polymorphismFig. 10 Funnel plot of the association of insomnia with inflammatory digestive phenotypes and biomarkers. A Nausea and vomiting; B GI-bleeding; C Abdominal pain; D Change in bowel habit; E C-reactive protein level; F Neutrophil cell count; G Lymphocyte cell count; **H **Eosinophill percentage; I Basophil percentage; J Monocyte percentage. Each black dot indicates a single nucleotide polymorphism. GI, gastrointestinal
Discussion
For all we know, this MR study is the first one conducted to determine if insomnia is potentially associated with inflammatory digestive diseases, phenotypes and biomarkers. Our study originally extended the narrow-sense concept of IBD to the broad-sense concept of IDD, incorporating several approximate gastrointestinal disorders. Based on the Two-Sample MR analysis, we thoroughly evaluated the potential relationship between insomnia and inflammatory digestive diseases, phenotypes and biomarkers. The results disclosed that insomnia was positively associated with ulcers of the esophagus and abdominal pain. Furthermore, although only suggestive evidence was obtained, potential relationships were observed between insomnia and duodenal ulcer, gastric ulcer, rectal polyp, haemorrhoidal disease, and monocyte percentage.
PUD remains a common disease endangering public health worldwide [39], and there is no effective solution. Some research has claimed that an unhealthy lifestyle plays a critical role in PUD [40]. Sleeplessness, as one of the risk factors, was considered to be closely correlated with the development and recurrence of PUD [41–43]. To be consistent with this observational evidence, an MR study indicated a certain association between insomnia and PUD [16]. However, given the limitations of the previous studies, we conducted an MR analysis to investigate whether insomnia was closely correlated with PUD. Different from the previous MR study, we split PUD into ulcers of the esophagus, gastric, and duodenal regions for association assessments, respectively. When the three types of PUDs were treated as independent diseases, a potential association was observed between insomnia and them, respectively (all p < 0.05) (Fig. 2A). This result not only corroborated previous research but also provided more detailed and precise evidence. However, as components of IDDs, a definite association was solely observed between insomnia and ulcers of the esophagus. Only suggestive evidence existed for the potential relationship between insomnia and the other two PUDs, which might be attributed to stricter statistical thresholds. Although some studies revealed that digestive tract mucosa injury caused by immune, oxidative stress and circadian rhythm disturbances was the underlying mechanism of PUD induced by insomnia [10, 16], more randomized controlled trials (RCTs) and fundamental experiments are needed for further exploration and validation.
Many clinical studies revealed a correlation between sleeplessness and IBD, in which deficiencies in sleep duration and efficiency were strongly correlated with the progression of IBD [44–47]. Previous animal experiments [48, 49] and recent meta-analyses [50] have also confirmed the relationship between sleeplessness and IBD. Nevertheless, limited to the selection bias and potential confounders of the early studies, it is difficult to elucidate a causal relationship between them. Although our study failed to disclose any remarkable correlation between insomnia and IBD, the result was supported by a previous MR study [51]. Immune impairment and intestinal flora disruption caused by disturbed sleep rhythms are still widely recognized as an important trigger of IBD [6, 7, 10, 52], therefore, large-scale RCT/basic studies are urgently needed to further elucidate the intrinsic relationship between them.
Digestive tract polyps and haemorrhoidal diseases are common inflammatory proliferative diseases from a physiological angle. There is no available evidence to elucidate the association between sleep and these diseases. Although our study revealed no significant association between insomnia and digestive tract polyps for the first time, the ORs of these correlations were larger than 1 (Fig. 2A), indicating that insomnia might be a risk factor for these kinds of diseases. Besides, suggestive evidence was obtained from the potentially association between insomnia and haemorrhoidal diseases (Fig. 2A). However, these findings should be further validated in the future.
For inflammatory digestive phenotypes and biomarkers, the IVW method revealed that the genetic predisposition to insomnia was significantly correlated with abdominal pain and suggested evidence for a potential association between insomnia and monocyte percentage (Fig. 2B). Surprisingly, our analysis discovered no significant association between insomnia and other phenotypes and biomarkers. Such results might be attributed to the lack of high-specificity of these phenotypes and biomarkers for IDDs. Although specific pro-inflammatory cytokines (TNF-α, interleukin-1β and interleukin-6) were recognized to correlate with sleep and IBD closely [1, 53], we failed to obtain reliable evidence that insomnia had a potential relationship with the three inflammatory biomarkers due to the deficiency of the related GWAS dataset. As for the monocyte, a critical inflammatory-related immune cell, it is known to be closely correlated with insomnia [54, 55]. According to the studies, monocyte percentage is regulated by the circadian gene Bmal1 [56] and clock gene Arntl [57] and insomniac individuals have an increase in circulating monocytes. The findings of these studies provided credence to our research, but the definite association between insomnia and monocyte percentage still needs further validation.
There are several highlights to this study. The use of five MR analysis methods enhanced the reliability and comprehensiveness of the association assessment between exposure and outcome. And in essence, the MR study eliminated the potential confounders, reverse causality and other issues common in traditional epidemiological studies. Instead of a single SNP, multiple SNPs closely correlated with insomnia were used as IVs to decrease horizontal pleiotropy. Moreover, a homogenous population (European population) was used to reduce heterogeneity, which was prevalent when individuals of different races were included in genetic research. We further performed statistical corrections to make the results more robust.
However, our research still has some unavoidable limitations. First, several datasets with higher specificity were not included due to their small sample size. This might result in the absence of some potential associations, which need large-scale RCTs and basic studies for further elucidation. Second, although the population in our study was highly homogenous, whether the results could be generalized to individuals of various ancestry populations remains unknown. Moreover, some phenotypes/biomarkers may be expressed only during certain time periods of life, resulting in some potential associations being missed. Genetic pleiotropy cannot be completely ruled out, although we have done our best to minimize it.
Conclusions
To sum up, our MR analysis revealed a well-established potential relationship between insomnia and IDDs/phenotypes/biomarkers including ulcer of the esophagus and abdominal pain, as well as suggestive evidence of a potential association among IDDs/phenotypes/biomarkers including gastric ulcer, duodenal ulcer, rectal polyp, haemorrhoidal disease and monocyte percentage. Sleep management and insomnia therapy may provide new insights into the prevention and treatment of IDDs and bring more benefits to patients.
Supplementary Information
Supplementary Material 1.
The reference list from the paper itself. Each links out to its DOI / PubMed record.
- 1Kofla-Dłubacz A Pytrus T Akutko K Etiology of IBD-Is it still a mystery?Int J Mol Sci 202223201244510.3390/ijms 23201244536293300 PMC 9604112 · doi ↗ · pubmed ↗
- 2Peña-Sánchez JN Osei JA Marques Santos JD Increasing prevalence and stable incidence rates of inflammatory bowel Disease among First Nations: Population-based evidence from a western Canadian Province Inflamm Bowel Dis 2022285142210.1093/ibd/izab 09634037223 PMC 8972279 · doi ↗ · pubmed ↗
- 3Cosnes J Gower-Rousseau C Seksik P Epidemiology and natural history of inflammatory bowel diseases Gastroenterology 201114017859410.1053/j.gastro.2011.01.05521530745 · doi ↗ · pubmed ↗
- 4M’Koma AE Inflammatory bowel disease: an expanding global health problem Clin Med Insights Gastroenterol 2013633472483394110.4137/C Gast.S 12731 PMC 4020403 · doi ↗ · pubmed ↗
- 5Krzesiek E Kofla-Dlubacz A Akutko K The incidence of inflammatory bowel disease in the Paediatric Population in the District of Lower Silesia, Poland J Clin Med 202110399410.3390/jcm 1017399434501439 PMC 8432562 · doi ↗ · pubmed ↗
- 6Bezzio C Della Corte C Vernero M Inflammatory bowel disease and immune-mediated inflammatory diseases: looking at the less frequent associations Th Adv Gastroenterol 2022151756284822111531210.1177/17562848221115312 PMC 934039435924080 · doi ↗ · pubmed ↗
- 7Turner D Bishai J Reshef L Antibiotic Cocktail for Pediatric Acute severe colitis and the Microbiome: the PRASCO Randomized Controlled Trial Inflamm Bowel Dis 20202617334210.1093/ibd/izz 29831833543 · doi ↗ · pubmed ↗
- 8Pigneur B Lepage P Mondot S Mucosal Healing and bacterial composition in response to Enteral Nutrition vs Steroid-based induction Therapy-A randomised prospective clinical trial in children with Crohn’s Disease J Crohns Colitis 2019138465510.1093/ecco-jcc/jjy 20730541015 · doi ↗ · pubmed ↗