Low frequency of SLC26A4 c.919-2A > G variant among patients with nonsyndromic hearing loss in Yunnan of Southwest China
Yan-Qiong Li, Heng Ma, Qin-Yao Wang, De-Sheng Liu, Wei Wang, Shi-Xin Li, Rong-Xia Zuo, Tao Shen, Bao-Sheng Zhu, Ya-Lian Sa

TL;DR
This study found that a specific gene variant linked to hearing loss is less common in Yunnan's ethnic minority and Han Chinese patients compared to other regions in China.
Contribution
The study provides new insights into the frequency of SLC26A4 gene variants in Yunnan’s diverse ethnic populations with nonsyndromic hearing loss.
Findings
The SLC26A4 c.919-2A > G variant had a total carrier rate of 4.50% in Han Chinese and 1.42% in ethnic minorities.
The c.2168 A > G variant was found in 0.94% of Han Chinese and 0.47% of ethnic minorities, with no significant difference.
Three Han Chinese patients carried compound heterozygosity for both SLC26A4 variants.
Abstract
Gene variants are responsible for more than half of hearing loss, particularly in nonsyndromic hearing loss (NSHL). The most common pathogenic variant in SLC26A4 gene found in East Asian populations is c.919-2A > G followed by c.2168A > G (p.H723R). This study was to evaluate their variant frequencies in patients with NSHL from special education schools in nine different areas of Southwest China’s Yunnan. We performed molecular characterization by PCR-products directly Sanger sequencing of the SLC26A4 c.919-2AG and c.2168 A > G variants in 1167 patients with NSHL including 533 Han Chinese and 634 ethnic minorities. The SLC26A4 c.919-2A > G variant was discovered in 8 patients with a homozygous state (0.69%) and twenty-five heterozygous (2.14%) in 1167 patients with NSHL. The total carrier rate of the c.919-2A > G variant was found in Han Chinese patients with 4.50% and ethnic minority…
Genes, proteins, chemicals, diseases, species, mutations and cell lines named across the full text — each resolved to its canonical identifier and authoritative record.
Click any figure to enlarge with its caption.
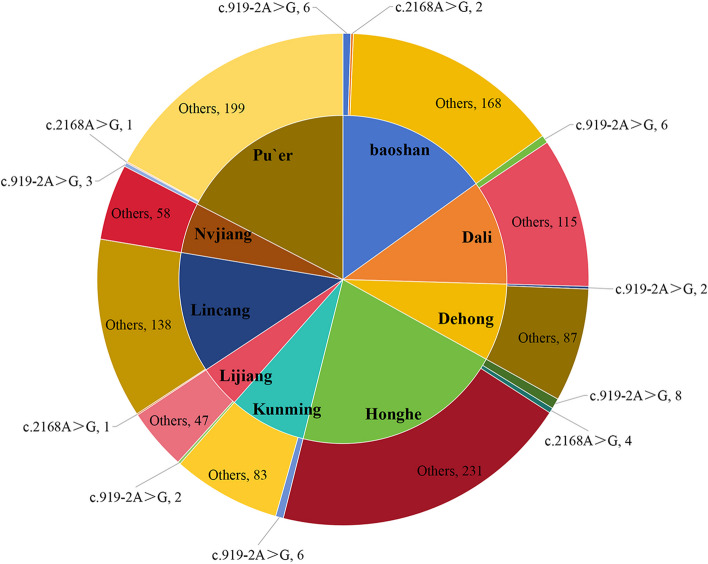 Figure 1
- —the National Natural Science Foundation of China
Peer Reviews
No public reviews on file for this paper yet. If you reviewed it on a platform where reviews are public (OpenReview, ICLR, NeurIPS, ICML), you can paste yours below so the community can read it here.
Videos
No videos yet. Explain this paper in a talk, walkthrough, or lecture? Add one.
Taxonomy
TopicsHearing, Cochlea, Tinnitus, Genetics · Vestibular and auditory disorders · Ear Surgery and Otitis Media
Background
Hearing loss (HL) is one of the most prevalent disabilities [1]. There is a broad spectrum of genetic and environmental factors involved in hearing loss [2]. Genetic factors are responsible for more than half of cases. The variants of solute carrier family 26 member 4 (SLC26A4) gene (MIM #605,646), also named the PDS gene, described as the second leading cause after the gap junction protein β 2 (GJB2) gene (MIM #121,011), were responsible for autosomal recessive NSHL (DFNB4, MIM #600,791) and syndromic deafness characterized by congenital sensorineural hearing loss, abnormalities of the cochlea, and goiter named as Pendred syndrome (PS, MIM #274,600) [3, 4].
The SLC26A4 gene, located on chromosome 7q22.q31, contains 21 exons, spans approximately 2343 bp of cDNA and encodes pendrin. Previous research demonstrated that there are hundreds of known variants in the SLC26A4 gene spreading over all exons and their flanking sequences associated with an increased risk of hearing loss [5–7]. It was reported that the different ethnic groups and geographical origins have their own distinctive variant hotspot of the SLC26A4 gene with its frequency [8, 9]. In a multiethnic cohort consisting of 117 deaf patients from Turkey (n = 45), Mexico (n = 11) and Iran (n = 61), the most common pathogenic variants of the SLC26A4 gene were c.1197delT (p. C400Vfs*32) and c.1226G > A (p. R409H) [10]. Adhikary et al. observed that SLC26A4 gene variants containing c.1087A > G, c.1195 T > C, c.1363A > T, and c.2145G > T in Indian were found in 215 patients with NSHL [11]. In a meta-analysis, the SLC26A4 c.919-2A > G (rs111033313) in intron 7, c.2168A > G (rs121908362) in exon 19 were the two most common variants in the East Asian population [12]. Particularly, the SLC26A4 c.919-2A > G variant was the most prevalent in China [12, 13], c.2168A > G was predominant in Japan and Korea [14, 15]. However, published work has not been well documented the variant frequencies of c.919-2A > G and c.2168A > G in patients with NSHL in most areas of Southwest China’s Yunnan.
Yunnan, with a unique natural and geographical environment, is located in China's southwest frontier and lives together 52 ethnic populations [16]. Compared to the eastern regions of China, the information on the frequencies of SLC26A4 c.919-2A > G and c.2168A > G variants are still not well known in most areas of Yunnan. In this study, we report the variant frequencies of SLC26A4 c.919-2A > G and c.2168A > G in 1167 patients with NSHL from special education schools in nine different areas of Yunnan, and compared the difference of their frequencies between Han Chinese group and ethnic minority group, among neighboring populations and countries of China. This research enriches the frequency spectrum of the c.919-2A > G and c.2168A > G variants in the Chinese population and contributes to regional genetic counselling and accurate personalized genetic testing.
Methods
Subjects
A total of 1167 unrelated NSHL patients (604 males, 563 females) from special education schools in nine areas of Yunnan were recruited into our study from January 2011 to October 2013. The subjects with NSHL showed bilateral, mild, and severe to profound, sensorineural hearing loss. This cohort consisted of 634 ethnic minorities (54.33%) and 533 ethnic Han Chinese (45.67%). The median age of the patients with NSHL was 13 years (range, 3–27 years). The basic demographics and the distribution of patients with NSHL in nine geographic areas are provided in Table 1 and Fig. 1 according to the China Sixth Census in 2010. The geographical areas from where individuals were recruited are shown in Fig. 1. Table 1. The demography and the patients with NSHL in nine areas of YunnanName of geographical areaArea (square km)^a^General population (ten thousand)^a^ethnic minority population (ten thousand)^a^Participants with NSHLChina9,634,05713,700904.2Yunnan394,1004596.61533.7Kunming21,473643.288.7689Baoshan19,600250.627.32176Dehong11,173121.155.4689Dali29,459345.6182.13121Honghe32,931450.1276.81243Lijiang20,600124.570.2249Lincang24,469243.092.10139Nvjiang14,70353.446.8358Pu`er44,221254.3155.63203^a^These data was from the China Sixth Census in 2010Fig. 1The demographics in nine areas of Yunnan including the counts of participants and SLC26A4 c.919-2A > G and c.2168A > G variants
This study received approval from the Ethics Committee of the First People’s Hospital of Yunnan Province and was performed according to the Declaration of Helsinki of 1975, which was revised in 2008. Written informed consent was obtained from all subjects or their parents/guardians. The patients enrolled in this study were diagnosed with NSHL with a medical certificate and our team-based clinical interview, which excluded syndromic hearing loss and consanguinity, brain injury and meningitis. In this cohort, 94 patients (8.05%) had a family history of deafness.
PCR amplification and sanger sequencing
All participants donated their 2 ml peripheral venous blood samples and were collected in EDTAK2-containing tubes. Genomic DNA extraction was performed using a Bioteke Blood DNA Extraction Reagent Kit (BioTeke Corporation, Wuxi, China) according to the manufacturer’s instructions. DNA samples were used to detect variants in SLC26A4 c.919–2 A > G and c.2168A > G by polymerase chain reaction (PCR) amplification followed by Sanger sequencing (ABI 373XL automated DNA sequencer), and analyzed by Genetool software.
Statistical analysis
Data were analyzed using SPSS statistical software (IBM SPSS Statistics for Windows, Version 19.0.). The significance of differences between groups was assessed by the chi-square test. Fisher’s exact test was used to establish the distributions of genotype and allele. A value of P < 0.05 was considered statistically significant. Analysis of data Sequences were compared to the published reference sequence of SLC26A4 (NG_008489, NM_000441).
Results
To identify c.919-2A > G and c.2168A > G variants in the SLC26A4 gene, genomic DNA was extracted, and their regions were amplified by PCR. Amplicons were Sanger sequenced to find c.919-2A > G and c.2168A > G variants.
The distributions of allele and genotypic frequencies of c.919–2 A > G and c.2168A > G in the collected samples were shown in Table 2. Here, we present 1167 patients with NSHL who carried a frequency (2.83%, 33/1167) of SLC26A4 c.919-2A > G variant, with 8 homozygotes (0.69%) and 25 heterozygotes (2.14%), leading to 1.76% allelic frequency. The graphs of DNA sequencing results for c.919–2 A > G and c.2168A > G were shown in Figure S1. Table 2. The frequencies of SLC26A4 c.919-2A > G and c.2168 A > G variants between the Han Chinese group and the ethnic minority group in NSHLAreasSubjects with NSHL (n)Subjects with c.919-2A > G, number of cases (%)Han Chinese with c.919-2A > G,number of casesMinority patient with c.919-2A > G,number of casesHomozygous, number of cases (%)Heterozygous, number of cases (%)Number of c.919-2A > G variant alleles, frequency(%)Baoshan1766 (3.41)601 (0.57)5 (2.84)7(1.99)Dali1216 (4.96)602 (1.65)4 (3.31)8(3.31)Dehong892 (2.25)200(0)2 (2.25)2(1.12)Honghe2438 (3.29)624 (1.65)4 (1.65)12(2.47)Kunming896 (6.74)241 (1.12)5 (5.62)7(3.93)Lijiang492 (4.08)020(0)2 (4.08)2(2.04)Lincang1390(0)000(0)0(0)0(0)Nvjiang580(0)000(0)0(0)0(0)Pu`er2033 (1.48)210(0)3 (1.48)3(0.74)total116733 (2.83)2498 (0.69)25 (2.14)41(1.76)
Ethnically, as shown in Table 2, the SLC26A4 c.919–2 A > G variant was found in 4.50% (24/533) of Han Chinese patients and 1.42% (9/634) of minority ethnic patients. Of them, the variant frequencies of heterozygotes and the G allele were 3.56% (19/533) and 2.72% (29/1066) in Han Chinese patients, while there were 0.95% (6/634) and 0.95% (12/1268) in minority ethnic patients, respectively. These differences between the two groups were statistically significant (all P < 0.05). Homozygotes was detected at a lower rate (0.69%, 8/1167), the frequency of homozygotes (0.94%, 5/533) in the Han Chinese group without statistically significant compared to that (0.47%, 3/634) in the minority ethnic group (P = 0.547).
Geographically, a considerable diversity of the SLC26A4 c.919–2 A > G variant frequency in patients with NSHL was shown in Table 3. In nine areas of Yunnan, the allele frequency of the c.919-2A > G variant was the highest in Kunming with 3.93%, compared with that in other areas. The c.919-2A > G variant was not detected in patients from Lincang and Nvjiang areas. Table 3. The distribution of affected alleles of SLC26A4 c.919-2A > G was found in patients with NSHL in nine different areas of YunnanGeneVariantNumber of Affected AllelesTotal patientsHan Chinese groupMinority groupχ2POR (95%CI)(n = 1167)(n = 533)(n = 634)(frequencies)(frequencies)(frequencies)SLC26A4c.919-2A > GHomozygous8 (0.69%)5 (0.94%)3 (0.47%)0.3630.5471.992 (0.474, 8.373)Heterozygous25 (2.14%)19 (3.56%)6 (0.95%)9.4700.0023.869 (1.534, 9.759)Total carrier rate33 (2.83%)24 (4.50%)9 (1.42%)10.0180.0023.274 (1.509, 7.107)Allele G41(1.76%)29(2.72%)12 (0.95%)10.5620.0012.927 (1.486, 5.765)c.2168 A > GHomozygous1 (0.09%)0 (0.00%)1 (0.16%)——1.000——Heterozygous7 (0.60%)5 (0.94%)2 (0.32%)0.9830.3210.334(0.065, 1.729)Total carrier rate8 (0.69%)5 (0.94%)3 (0.47%)0.3630.5470.502(0.119, 2.111)Allele G9(0.40%)5 (0.47%)4 (0.32%)0.0680.7940.670(0.179, 2.510)
We also detected SLC26A4 c.2168 A > G variant in this cohort. A summary of its variant frequency was shown in Table 2. Eight patients (0.69%, 8/1167) were found to harbor c.2168 A > G variant involving five Chinese patients (0.43%) and three ethnic minority patients (0.26%), which were one homozygous and seven heterogeneous. Of them, one ethnic minority patient (0.09%) with homozygous was from Pu`er area, and 2 ethnic minority patients with heterogeneous (0.17%) from Honghe area. Five Han Chinese patients with heterogeneous were from Honghe (0.17%, 2/1167), Baoshan (0.17%, 2/1167) and Lincang (0.09%, 1/1167) areas, respectively.
In this cohort, only three Han Chinese patients (0.26%) carried compound heterozygosity for c.919-2A > G and c.2168 A > G, which 2 patients were from Baoshan and one patient in Honghe areas. Above all, SLC26A4 c.919-2A > G and c.2168 A > G variants were detected at a lower rate among 1167 patients with NSHL in Yunnan compared to the average levels (8.01%, 1.51%) in most of areas of China [17].
The comparisons of the two major pathogenic variant frequencies of SLC26A4 c.919-2A > G and c.2168A > G among neighboring populations and countries of China, and between the Han Chinese group as well as ethnic minority group in China were shown in Tables 4, and 5, respectively. Generally, the distribution trend of c.919-2A > G variant frequency was higher in Eastern and Central regions than the Western regions, the Han Chinese patients harboring more variant frequency than the Ethnic minority patients with NSHL in China. Table 4. Comparison of the variant frequencies of c.919-2A > G and c.2168 A > G in SLC26A4 gene in patients from neighboring populations and countries of ChinaAuthor ReferenceCountry /region, areaSamples (n)c.919-2A > G, No. of allele, frequency (%)c.2168 A > G, No. of allele, frequency (%)in this paperChina /Yunnan116741 (1.76%)9 (0.40%)Tekin et al., 2003 [18]Turkey3330.00%2 (0.30%)Anwar S et al., 2009 [19]Pakistanis775 Pakistani families0.00%0.00%Adhikary et al., 2015 [11]India2150.00%0.00%Kahrizi et al., 2009 [20]Iran800.00%0.00%Park et al., 2003 [15]Korea924 (2.17%)5 (2.72%)Usami, et al., 1999 [21]Japan2642 (0.38%)22 (4.17%)Erdenechuluun et al., 2018 [22]Mongolia1887 (1.86%)0.00%Danilchenko et al., 2021 [23]Russia/Southern Siberia23276 (12.14%)4 (0.64%)Yuan et al., 2012 [17]China/27 regions2352377 (8.01%)71 (1.51%)Wang Y et al., 2021 [24]China/ 3 regions47565 (6.84%)10 (0.98%)Liu et al., 2016 [25]China/Inner Mongolia AutonomousRegion738168 (11.38%)12 (0.81%)Yuan et al., 2012 [26]China/Tibet1140.00%0.00%Duan et al., 2021 [27]China/ Qinghai44042(4.77%)17(1.93%)Pan et al., 2017 [28]China/Heilongjiang38051 (6.71%)25 (3.29%)Zhu et al., 2015 [29]China/Hebei31869 (10.85%)21 (3.30%)Xie et al., 2021 [30]China/Hubei13724 (8.76%)4 (1.46%)Xiang et al., 2019 [31]China/Zhejiang50637 (3.66%)7 (0.69%)Lin et al., 2019 [32]China/Guangdong63479 (6.23%)11 (0.87%)Huang et al., 2018 [33]China/Hainan29924 (4.01%)1 (0.17%)Wu et al., 2019 [34]China/Taiwan34644 (6.36%)39 (5.64%)Southwest of ChinaJiang et al., 2015 [35]China/Chongqing592 (1.69%)0.00Dai et al., 2008 [13]China/Sichuang10919 (8.72%)—Dai et al., 2008 [13]China/Guizhou13811(3.99%)—Samples from the same city of Yunnanin this paperYunnan/Kunming897 (3.93%)0.00%Xin et al., 2013 [36]Yunnan /Kunming23520 (4.26%)3 (0. 64%)Dai et al., 2008 [13]Yunnan /Kunming15926 (8.18%)—in this paperYunnan /Lincang1390.00%1 (0.36%)Dai et al., 2008 [13]Yunnan /Lincang732 (1.37%)——Data was not publishedTable 5Comparison of the variant frequencies of SLC26A4 c.919-2A > G and c.2168 A > G among Han Chinese and Ethnic minority patients with NSHL in ChinaAuthor ReferenceHan Chinese patients (n)Ethnic minority patients (n)Region/areaHan Chinese patients / Minority patients (n)c.919-2A > G, No. of allele, frequency (%)c.2168 A > G, No. of allele, frequency (%)c.919-2A > G, No. of allele, frequency (%)c.2168 A > G, No. of allele, frequency (%)in this paperSouthwestern China’s Yunnan533 / 63429 (2.72%)5 (0.47%)12 (0.95%)4 (0.32%)Duan et al., 2015 [37]Northwester China’sNingxia, Qinghai234 / 25028(5.98%)14(2.99%)24(4.80%)8 (1.60%)Du et al., 2014 [38]Northwester China’sGansu1809 / 515386 (10.67%)112 (3.10%)52 (5.05%)27 (2.62%)Chen et al., 2011 [39]Northwester China’sXinjiang151 / 19925 (8.28%)5 (1.66%)5 (1.26%)2 (0.50%)Dai et al., 2008 [13]China/27 regions2783 / 465533 (9.58%)——29 (3.12%)————Data was not published
Discussion
Hearing loss can be caused by a heterogeneous etiology involving genetic and environmental factors [2, 6]. Previous studies supported the SLC26A4 gene, especially the c.919-2A > G followed by c.2168A > G variant, play a critical role in molecular etiology of NSHL in the East Asia population [7–9].
In this study, PCR products direct Sanger sequencing was employed to analyze the SLC26A4 c.919-2A > G and c.2168A > G variants in 1167 patients with NSHL from special education schools in nine different areas of Southwest China’s Yunnan, which included 533 Han Chinese and 634 ethnic minorities. The present study shown that 33 (2.83%) out of 1167 NSHL patients carrying SLC26A4 c.919-2A > G variant were detected, and eight patients (0.69%) were found to harbor c.2168 A > G variant. Their allele frequencies were significantly lower (1.76%, 0.40%) than the average levels (8.01%, 1.51%) in most regions of China reported by Yuan and his colleagues [17].
The c.919-2A > G variant frequency in this current study was different from those reported by Dai and other researcher [13, 17, 24–38]. Dai and colleague demonstrated that 158 homozygotes (4.83%) and 250 heterozygotes (7.64%) of the SLC26A4 c.919-2A > G variants were found in 3271 patients with NSHL from 27 regions of China [13]. Its allele frequency varies widely from 19.94% in Henan to 0.40% in Lhasa of Tibet Autonomous, which was 8.18% in Kunming. Xin’s research demonstrated the c.919-2A > G variant frequency was 4.26% in patients from Kunming [35]. Our results shown that the allele frequency of c.919-2A > G variant was found 3.93% in patients from Kunming. The difference of c.919 A > G variant frequency in the patients from the same area was presented. The reason may be partly explained by sample bias.
Previous studies have revealed that homozygous (biallelic variation) or compound heterozygosity for c.919-2A > G and c.2168 A > G in the SLC26A4 gene was the molecular genetic etiology of sensorineural hearing impairment [9, 11, 12, 15]. In the current study, 8 cases (0.69%) were found to harbor homozygotes of c.919-2A > G, one case (0.09%) with c.2168 A > G homozygotes, and three patients harbored compound heterozygosity for c.919-2A > G and c.2168 A > G. Their variant frequencies were significantly lower compared with the average levels in most regions of China reported by Yuan and Dai et al. [13, 17]. The reasons may be interpreted as follows. First, the c.919-2A > G and c.2168 A > G variants in this cohort may not be the main susceptibility sites to NSHL. Second, there may be small sample bias in this cohort. Third, it can be interpreted in a broader spatial and historical context of population genetics. Yunnan is home not only to Han Chinese but also to 24 officially recognized ethnic minority groups. Populations from different regions of Eurasia as well as Eastern China arrived in Yunnan, and admixed into aborigines with a long history [16]. The present ethnic minority and Han are living together in many places in Yunnan including nine areas in this study, which could have been influenced inter-population marriage. Thus, the homozygote frequency of the SLC26A4 c.919-2A > G variation can be expected to transiently decline according to the Wahlund principles. Therefore, further studies including a larger number of minority ethnic populations and a broad range of geographic areas are needed in the future.
The c.919 A > G variant was the most prevalent in China, while c.2168A > G variant in Japan and Korea [15, 21]. Zhou et al. demonstrated that 57 patients and 20 patients harbored c.919‐2A > G (4.75%) and c.2168A > G (1.67%) variants were found in 1201 patients with NSHL from Shanxi of China [40]. Chen et al. reported five c.919‐2A > G (0.94%) and three c.2168A > G heterozygous (0.57%) were detected in 530 NSHI patients of south China, including Guangdong, Guangxi, Hainan, Hunan, Fujian and Jiangxi Province [41]. Park HJ et al. demonstrated that one SLC26A4 c.919-2A > G homozygote (1.09%) and two c.919-2A > G heterozygotes (2.17%) were detected in 92 deaf Korean probands [21]. The frequency of the SLC26A4 c.919-2A > G allele variant was 0.38% in 264 Japanese individuals [15]. Previous reported that the allele frequency of c.2168A > G variant in patients with NSHL was detected in 2.72%, 4.17%, and 1.51% of Korean, Japanese, and Chinese (mainland Chinese) subjects, respectively [15, 17, 21]. In this study, SLC26A4 c.919-2A > G and c.2168A > G allele variant in patients from Yunnan were rarely lower frequency (0.40%) than that in patients from neighboring populations and countries of China, except from Tibetan Chinese patients with zero. Thus, these results support the variant frequencies of c.919-2A > G and c.2168A > G in SLC26A4 gene dependent on the geographical origin [4, 13, 15, 23, 31–33].
Ethnically, the Chinese population consists of 56 ethnic groups. Han Chinese is the largest group. The ethnic minority groups are mainly living in Northwestern and Southwestern of China. Duan et al. reported that the allele frequency of c.919-2A > G was 6.09% (28/460) in Han Chinese patients and 3.33% (14/420) in ethnic minority patients with NSHL from Qinghai in Northwest China [27]. Qing et al. shown that the frequency of the SLC26A4 variant was 7.04% (82/1164), 7.54% (67/888), 5.43% (15/276) among total subjects, the Chinese Han and ethnic minorities patients in Changsha of Hunan [42], respectively. In this study, ethnic minority patients have a lower carrier frequency (0.95%) than that in Han Chinese (2.72%) with statistical significance. The result was in consistence with the previous research shown in Table 5. Above all, these results support the influence of regional or environmental or ethnic origin on the variant frequency of c.919-2A > G and c.2168 A > G in SLC26A4 gene [4, 9, 13, 23, 36].
There are some limitations in this study. Even though this project collected 1167 samples from the wide geographic area of Southwest China’s Yunnan, subjects receiving an imaging examination to identify inner ear status or an enlarged vestibular aqueduct (EVA) and temporal bone abnormalities were unclear. Secondly, Sanger sequencing is the gold-standard for all nucleic acid detection. But compared to the next- generation sequencing (NSG) technology, it cannot find more molecular genetic etiology of deafness. Thirdly, there are absence of information on the hearing levels and some other specific clinical features. Thus, possible genotype–phenotype correlations will be to analysis in the future research.
In conclusion, this study demonstrated that the SLC26A4 c.919-2A > G and c.2168A > G variant frequencies accounted for only a small proportion (1.03%) of patients with NSHL in this cohort. That is, the most common molecular genetic etiology of these patients with NSHL in this cohort is still uncertain. It is probable that hearing loss in these patients is due to variations in other spots in the SLC26A4 gene or other deafness-related genes. Furthermore, these data would facilitate implementation of the frequency spectrum of the SLC26A4 c.919-2A > G variant in the NSHL of the Yunnan population. And, it implied that the SLC26A4 c.919–2 and c.2168A > G are not appropriate for the first step in genetic testing of patients with NSHL in Yunnan.
Supplementary Information
**Additional file 1: Figure S1. **The chromatograms of the c.919-2A>G and c.2168A>G variant in SLC26A4 gene of Sanger sequencing. A Homozygote. B Heterozygote. C Wild type.
The reference list from the paper itself. Each links out to its DOI / PubMed record.
- 1GBD 2019 Hearing Loss Collaborators Hearing loss prevalence and years lived with disability, 1990–2019: findings from the Global Burden of Disease Study 2019 Lancet 202139710278996100910.1016/S 0140-6736(21)00516-X 33714390 PMC 7960691 · doi ↗ · pubmed ↗
- 2Meena R Ayub M Genetics Of Human Hereditary Hearing Impairment J Ayub Med Coll Abbottabad 201729467167629331002 · pubmed ↗
- 3Wasano K Takahashi S Rosenberg SK Kojima T Mutai H Matsunaga T Ogawa K Homma K Systematic quantification of the anion transport function of pendrin (SLC 26A 4) and its disease-associated variants Hum Mutat 202041131633110.1002/humu.2393031599023 PMC 6930342 · doi ↗ · pubmed ↗
- 4Everett LA Glaser B Beck JC Idol JR Buchs A Heyman M Adawi F Hazani E Nassir E Baxevanis AD Sheffield VC Green ED Pendred syndrome is caused by mutations in a putative sulphate transporter gene (PDS)Nat Genet 199717441142210.1038/ng 1297-4119398842 · doi ↗ · pubmed ↗
- 5Lu YJ Yao J Wei QJ Xing GQ Cao X Diagnostic Value of SLC 26A 4 Mutation Status in Hereditary Hearing Loss With EVA: A PRISMA-Compliant Meta-Analysis Medicine (Baltimore)20159450 e 224810.1097/MD.000000000000224826683941 PMC 5058913 · doi ↗ · pubmed ↗
- 6Korver AM Smith RJ Van Camp G Schleiss MR Bitner-Glindzicz MA Lustig LR Usami SI Boudewyns AN Congenital hearing loss Nat Rev Dis Primers 201731609410.1038/nrdp.2016.9428079113 PMC 5675031 · doi ↗ · pubmed ↗
- 7Li XC Everett LA Lalwani AK Desmukh D Friedman TB Green ED Wilcox ERA mutation in PDS causes non-syndromic recessive deafness Nat Genet 199818321521710.1038/ng 0398-2159500541 · doi ↗ · pubmed ↗
- 8Cengiz FB Yilmazer R Olgun L Sennaroglu L Kirazli T Alper H Olgun Y Incesulu A Atik T Huesca-Hernandez F Domínguez-Aburto J González-Rosado G Hernandez-Zamora E Arenas-Sordo ML Menendez I Orhan KS Avci H Mahdieh N Bonyadi M Foster J 2nd Duman D Ozkinay F Blanton SH Bademci G Tekin M Novel pathogenic variants underlie SLC 26A 4-related hearing loss in a multiethnic cohort Int J Pediatr Otorhinolaryngol 201710116717110.1016/j.ijporl.2017.08.00628964290 PMC 5679420 · doi ↗ · pubmed ↗