Correction: Collusion of α-Synuclein and Aβ aggravating co-morbidities in a novel prion-type mouse model
Grace M. Lloyd, Jess-Karan S. Dhillon, Kimberly-Marie M. Gorion, Cara Riffe, Susan E. Fromholt, Yuxing Xia, Benoit I. Giasson, David R. Borchelt

Abstract
Genes, proteins, chemicals, diseases, species, mutations and cell lines named across the full text — each resolved to its canonical identifier and authoritative record.
Click any figure to enlarge with its caption.
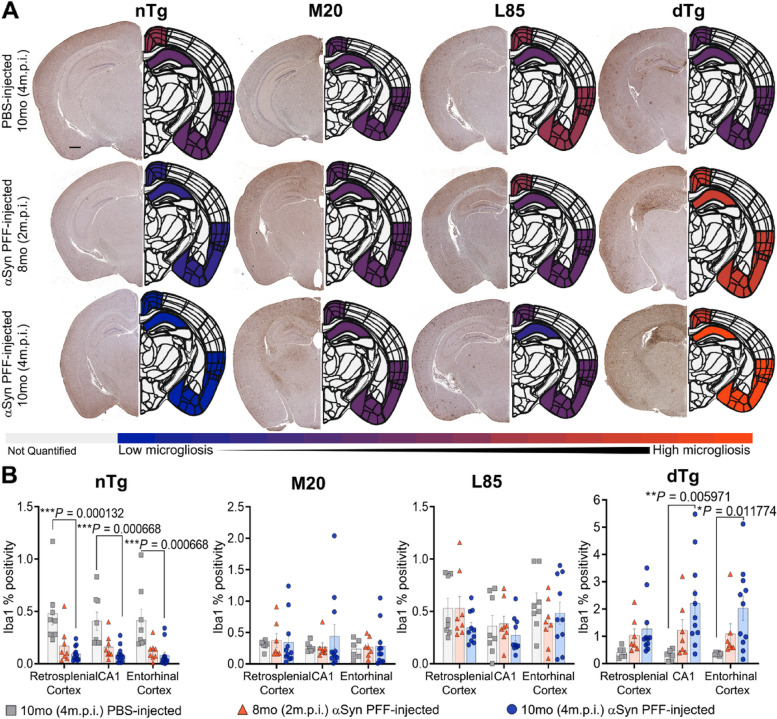 Figure 1
Peer Reviews
No public reviews on file for this paper yet. If you reviewed it on a platform where reviews are public (OpenReview, ICLR, NeurIPS, ICML), you can paste yours below so the community can read it here.
Videos
No videos yet. Explain this paper in a talk, walkthrough, or lecture? Add one.
Taxonomy
TopicsAlzheimer's disease research and treatments · Parkinson's Disease Mechanisms and Treatments · Prion Diseases and Protein Misfolding
Correction: Molecular Neurodegeneration 16, 63 (2021)
https://doi.org/10.1186/s13024-021-00486-9
The authors wish to correct an error in Fig. 7A of the original article [1]. We have determined that the representative image of a hemibrain shown for 10 month-old, PBS-injected, nontransgenic (nTg) mice in panel A is incorrect. Due to a labeling error of the digital file name, the brain image shown was actually from a 10 month-old, PBS-injected, wild-type αSyn (M20) animal. The corrected panel for Fig. 7A is provided in the figure shown below. It is imperative to emphasize that this correction does not alter the conclusions presented in the paper. None of the 10 month-old nTg or M20 mice injected with PBS exhibited appreciable pathology.Fig. 7. Exacerbation of Microgliosis in αSyn PFF-seeded dTg mice. A Representative images showing IHC using antibodies specific for Iba1 to compare nTg, M20, L85, and dTg mice injected with PBS or αSyn PFFs at 8 (2 m.p.i.) and 10 months (4 m.p.i.) of age as indicated, and corresponding heatmap depicting regional Iba1 percent positivity. The increase in microglial proliferation is illustrated by the color change from blue (minimum of Iba1 percent positivity) to orange (maximum of Iba1 percent positivity). Gray indicates regions were not quantified during this study. B Quantitation of Iba1 percent positivity comparing the retrosplenial cortex, CA1 of the hippocampus, and the entorhinal cortex within each cohort. Two-Way ANOVA followed by Holm-Sidak’s multiple comparisons test was used for statistical analysis (n = 8,8,13; 6,8,12; 8,8,10; 6,8,11). Data are presented as mean + / − SEM. Scale bar: 500 μm
The authors sincerely regret any confusion this oversight may have caused and appreciate the understanding of the readership.
The reference list from the paper itself. Each links out to its DOI / PubMed record.