A biological ocean data reformatting effort
Kimberlee Baldry, Robert Johnson, Peter G. Strutton, Philip W. Boyd

TL;DR
This paper introduces a new effort to reformat and standardize biological ocean data for better reuse and analysis.
Contribution
The novel contribution is the first version of BIO-MATE, a reproducible data reformatting system for subsurface bio-physical ocean data.
Findings
BIO-MATE reformats biological and physical data from oceanographic voyages into an interoperable data product.
The system supports easy application of QA/QC protocols for surface and subsurface applications.
BIO-MATE uses open-source R software and openly sourced datasets to improve data accessibility.
Abstract
Biological ocean data collected from ships find reuse in aggregations of historical data. These data are heavily relied upon to document long term change, validate satellite algorithms for ocean biology and are useful in assessing the performance of autonomous platforms and biogeochemical models. Existing aggregate products have largely been restricted to the surface ocean, omit physical data or have limited biological data. We present the first version of a BIOlogical ocean data reforMATting Effort (BIO-MATE) to begin to fill a gap in subsurface bio-physical data aggregates in a reproducible way. BIO-MATE uses open-source R software that reformats openly sourced published datasets from oceanographic voyages. These reformatted biological and physical data from underway sensors, profiling sensors, pigments analysis and particulate organic carbon analysis are stored in an interoperable…
Click any figure to enlarge with its caption.
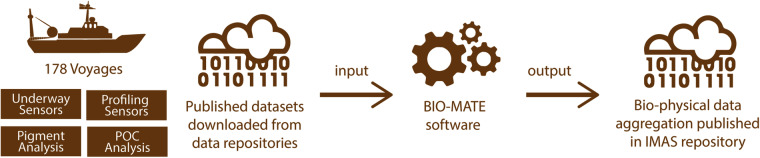 Figure 1
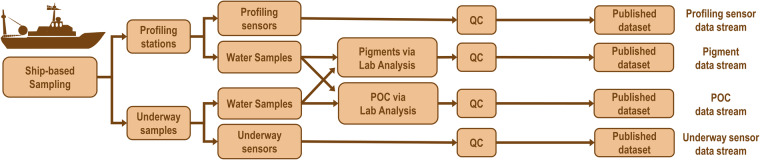 Figure 2
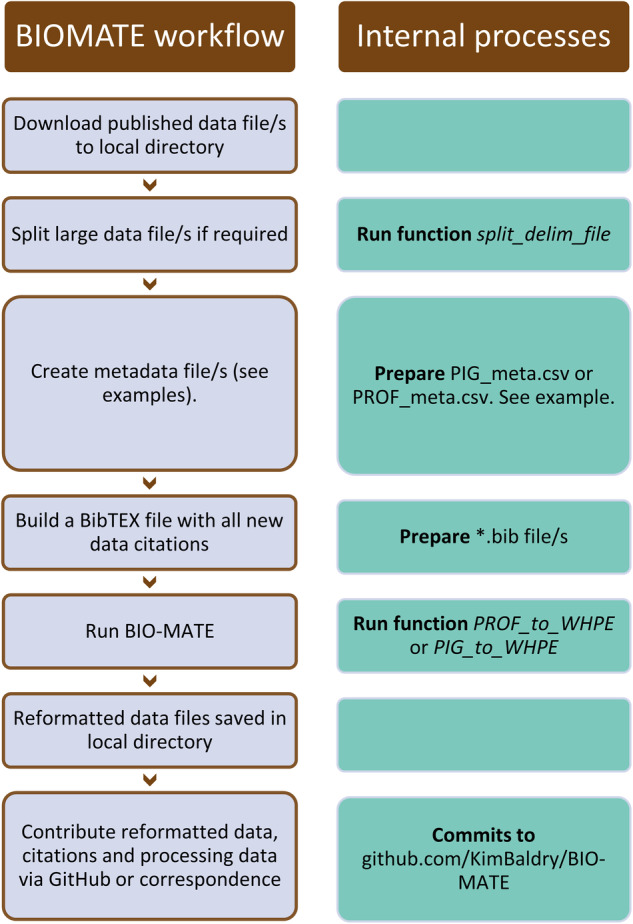 Figure 3
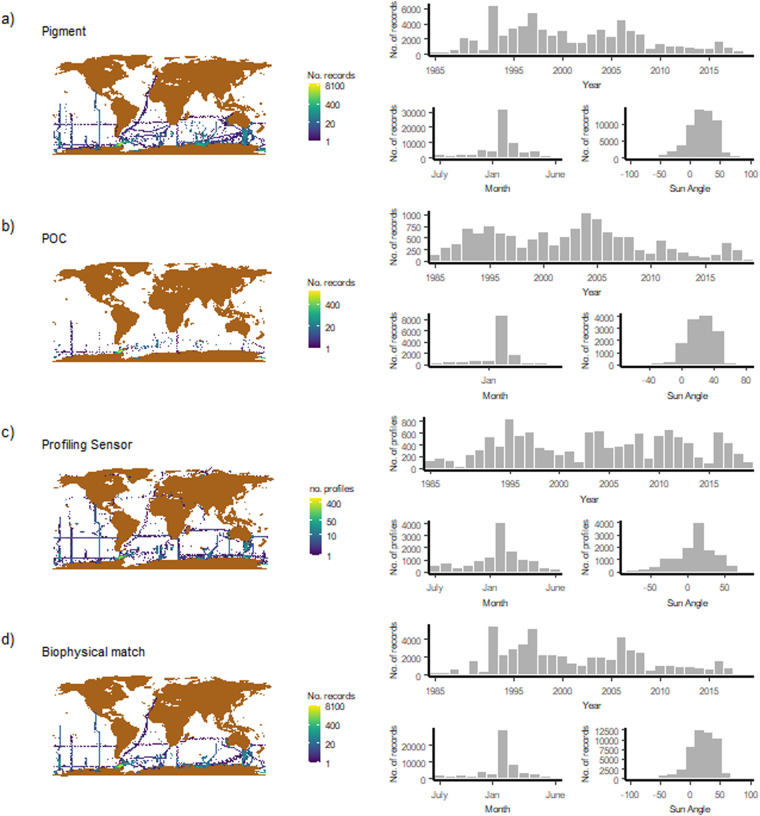 Figure 4
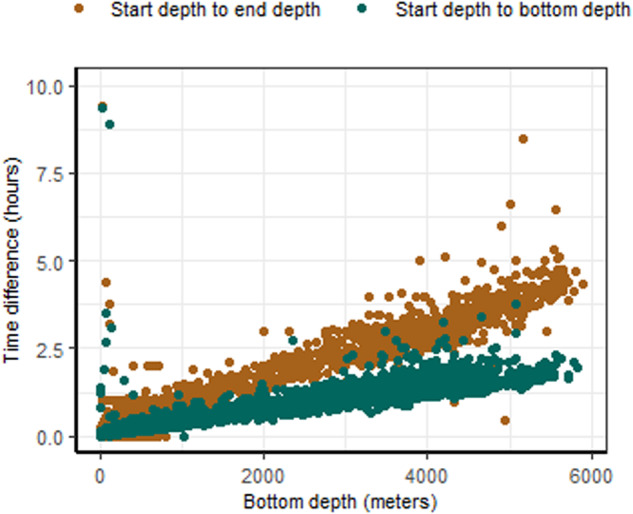 Figure 5
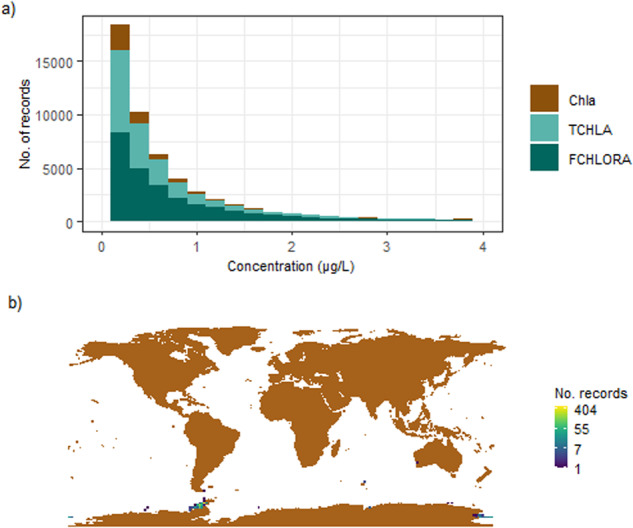 Figure 6
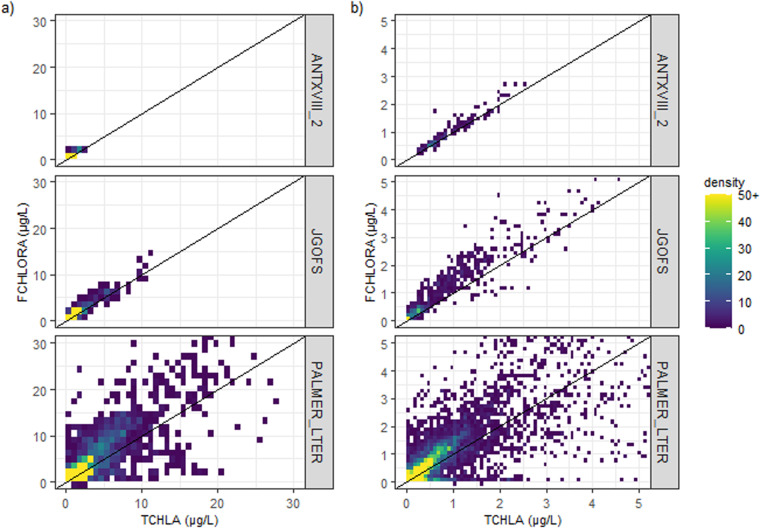 Figure 7
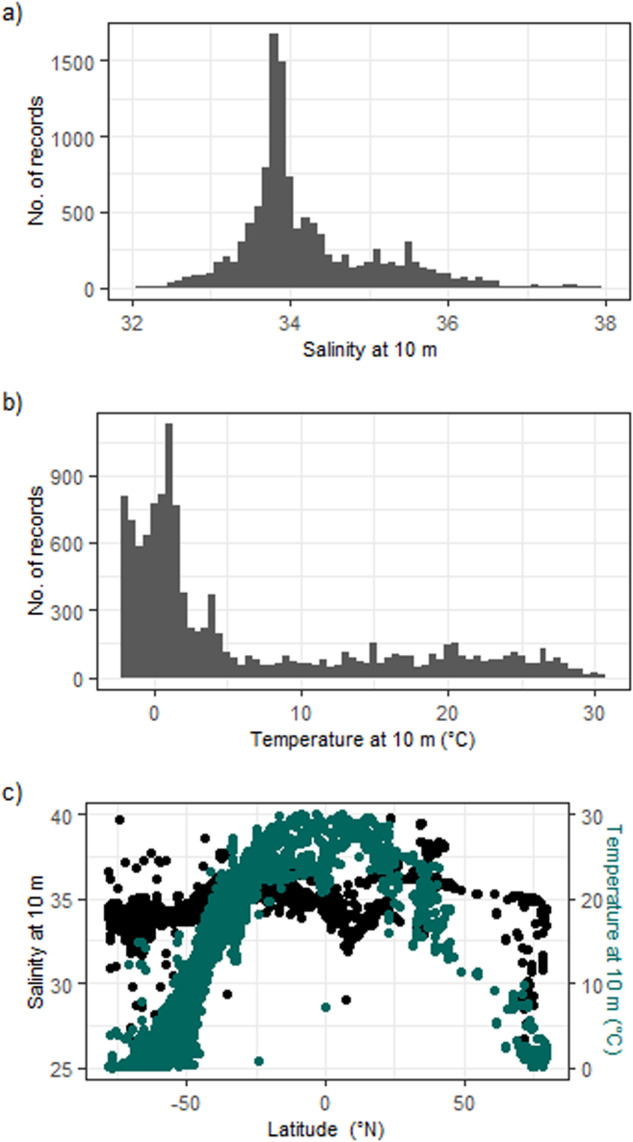 Figure 8
- —https://doi.org/10.13039/501100000706Scientific Committee on Antarctic Research (SCAR)
- —Australian Research Council’s Special Research Initiative for Antarctic Gateway Partnership (Project ID: SR140300001)
- —Australian Research Council Special Research Initiative, Australian Centre for Excellence in Antarctic Science (Project Number SR200100008) Australian Research Council Centre of Excellence for Climate
- —Australian Centre for Excellence in Antarctic Science (Project Number SR200100008) Australian Research Council’s Special Research Initiative for Antarctic Gateway Partnership (Project ID: SR140300001)
Peer Reviews
No public reviews on file for this paper yet. If you reviewed it on a platform where reviews are public (OpenReview, ICLR, NeurIPS, ICML), you can paste yours below so the community can read it here.
Videos
No videos yet. Explain this paper in a talk, walkthrough, or lecture? Add one.
Taxonomy
TopicsMarine and coastal ecosystems · Microbial Community Ecology and Physiology · Environmental Monitoring and Data Management
Background & Summary
Marine phytoplankton blooms support ocean food-webs and influence global climate through the biological carbon pump^1–3^. Ocean physics and other environmental drivers control the timing, magnitude and extent of phytoplankton blooms through complex bio-physical relationships^4–7^. To study these relationships, integrated data structures that link biological and physical ocean data are needed. Ship-based data are the gold standard for accurate biological oceanographic measurements^8^. These data are often published separately to physical ocean data, stored across different repositories and in multiple formats. This makes it difficult and time-consuming to aggregate and link biological and physical data. The described data product attempts to make this task easier.
The biological ocean data reformatting effort (BIO-MATE) works to link existing, open-access biological and physical datasets across oceanographic voyages and promote their re-use (Fig. 1). This has been done by developing a BIO-MATE R software package that not only reformats published datasets, but also cross-references between biological and physical data and allows access to citation information (https://github.com/KimBaldry/BIOMATE-Rpackage). The resulting BIO-MATE data product allows users to easily access, manipulate and cite published ship-based datasets of different dimensions for multiple applications.Fig. 1. The BIO-MATE concept for creating a consistent data compilation from existing ship-based oceanographic data.
The BIO-MATE data product can be accessed via the IMAS Data Portal^9^ and the Australian Ocean Data Network (https://portal.aodn.org.au/). The aggregation includes four data streams: (1) data collected from shipboard underway sensors, (2) profiling sensors mounted on sampling rosettes, (3) lab analysis for phytoplankton pigments and (4) lab analysis for particulate organic carbon (POC). These data streams are cross-referenced by unique expedition codes (EXPOCODE) and profiling station identifications (CTD_ID). An additional data stream contains supporting information for the data product including a list of oceanographic voyages, investigator contact information and data citations for reformatted datasets. We have also included an aggregated data table for biological data. Users are requested to refer to supporting data and cite all data products accessed through BIO-MATE, as well as the BIO-MATE data product itself. We consulted the distribution licenses of all data sources to ensure that with this condition data are re-used lawfully.
The data product has been used to understand how the response of in-situ fluorometers changes in the Southern Ocean, to assess non-photochemical quenching corrections and to investigate the role of ocean physics in mediating subsurface chlorophyll features^10^. These examples highlight the malleability of this data product to improve our understanding of biological oceanography. Other potential applications include validating satellite observations^11,12^, developing new ways to validate in-situ bio-optical observations collected by autonomous profiling platforms in the presence of dynamic fronts^8,13,14^, training ocean state estimations^15^, informing bio-physical models and using multi-variate analyses to understand bio-physical relationships.
We recognise the massive effort in producing the thousands of data records in this data product. This includes the investigators and data officers who have spent countless hours in ship time, project organisation, grant writing, laboratory analysis, data processing and report writing. Oceanographic data are often collected with regional studies in mind, but their value increases with publication and re-use. We encourage all investigators to publish their data for re-use through data products like BIO-MATE.
Methods
Published datasets in BIO-MATE
The BIO-MATE aggregate data product^9^ brings together ship-based data that have been collected by a Principal Investigator (PI), published to a publicly accessible database and re-cited in this data descriptor^16–506^ (Fig. 2). The first version of BIO-MATE includes published datasets associated with four types of measurements:
- sensors in the vessels underway seawater in-take (underway sensor data stream),
- profiling sensors mounted to sampling rosettes (profiling sensor data stream),
- pigments measured in the laboratory (pigment data stream), and
- POC measured in the laboratory (POC data stream). Fig. 2. Typical data collection and treatment process for biological oceanographic data within the BIO-MATE data compilation.
Data records from the pigment data stream were first identified in data repositories that host biological data. Pigment data records were identified using the search term “chlorophyll” and a latitude bound of 30 to 90 S from PANGAEA^506^ (https://www.pangaea.de/), SeaBASS^500,501^ (https://seabass.gsfc.nasa.gov/), the Australian Ocean Data Network (AODN, https://portal.aodn.org.au/), GLODAP^466,467^ (https://www.glodap.info/), the Palmer Long Term Ecological Record (PAL-LTER, https://pal.lternet.edu/data), the Biological and Chemical Oceanography Data Management Office (BCO-DMO, https://www.bco-dmo.org/data), the CSIRO Marlin Data Trawler (Marlin, https://www.cmar.csiro.au/data/trawler/) and the Australian Antarctic Data Center (AADC, https://data.aad.gov.au/). Data records from the profiling sensors and underway sensors data streams were then identified in these repositories and in the CCHDO (https://cchdo.ucsd.edu/) and MGDS^493^ (https://www.marine-geo.org/). Although we largely constrained the first version of BIO-MATE aggregate data product to the Southern Ocean, further versions can be expanded to the global ocean.
From available pigment data records, 178 relevant voyages were identified using unique 12-digit expedition codes (EXPOCODES) assigned as follows; National Oceanographic Data Centre (NODC) platform codes followed by voyage 8 digit start dates (YYYYMMDD). NODC platform and country codes are recorded on Git Hub (https://github.com/KimBaldry/BIO-MATE/product_data/supporting_information/codes) and within the BIO-MATE software (https://github.com/KimBaldry/BIOMATE-Rpackage/inst/codes). If the vessel name or voyage start/end dates were absent, this information was found using Google to discover voyage records. This voyage information was used to do a final Google keywords search (i.e. ship name, synonyms for voyages, year, “underway”, “CTD”, “chlorophyll”,”POC”, “cruise report” and “data”) to determine any absent records and to discover accompanying cruise reports.
Semi-automated BIO-MATE workflow for reformatting datasets
A semi-automated workflow and the BIO-MATE R software (https://github.com/KimBaldry/BIOMATE-Rpackage) were used to reformat published datasets, and produce the BIO-MATE data product (Fig. 3). Downloaded data files were split by EXPOCODES if they recorded data within a larger dataset (e.g PAL-LTER data records). Files for the profiling sensor data stream were further split into individual profiles. Processing metadata were manually entered into a table to inform the BIO-MATE R software and a bulk run of the software was performed to reformat data files. The workflow is described in more detail in the following subsections (Fig. 2).Fig. 3A schematic demonstrating the BIO-MATE workflow.
Download of published datasets
Published datasets were manually downloaded from open source repositories and stored locally in accordance with data policies. Some manual reformatting of a small portion of downloaded data had to be performed on old datasets, prior to the application of reformatting scripts, due to formatting irregularities. Downloaded data files, and their amendments used to create the BIO-MATE data product, are not published in BIO-MATE, but are available upon request to the corresponding author.
Splitting large datasets with BIO-MATE software
The BIO-MATE R software requires each file to only contain observations from a single voyage. Further, the profiling sensor data stream requires each file to only contain observations from a single profiling cast, held in a discrete directory for each voyage.
The split_delim_file function splits files using identified variables containing EXPOCODE synonyms and/or profiling station information. This function can be used to split a single, large data file into smaller files as required. For this version of the data product, a number of files had to be split to be ingested into the BIO-MATE core functions. A record of these can be found in Git Hub in the project notebook (https://github.com/KimBaldry/BIO-MATE/blob/main/BIO-MATE.Rmd).
Processing metadata
Information on file formats, dataset information, citation information, location data variables and ocean data variables are needed to reformat published datasets with BIO-MATE software. This information is called processing metadata herein and was manually entered and stored as comma delimited text files. The processing metadata required to run BIO-MATE software is described in the supplement Processing Metadata Table and differs for each data stream. All processing metadata used to construct the BIO-MATE aggregated data product is stored in Git Hub (https://github.com/KimBaldry/BIO-MATE/tree/main/product_data/processing_metadata).
Dataset citation with BibTEX files
Information is included in the BIO-MATE data product, for citing published datasets, laboratory analysis methodologies (for the pigment and POC data streams) and the data repositories through which published data records were accessed. Each citation was recorded as a BibTeX entry, compatible with EndNote, R and LaTeX. Each BibTeX entry has a tag that is referenced in the processing metadata. This tag is used to link citations to their corresponding data records when datasets are ingested in the BIO-MATE software. Citation information is then printed in the header information in reformatted files. Where possible BibTeX entries were sourced from data repositories. If BibTeX entries were not found, they were created manually.
All BibTeX entries are stored on Git Hub (https://github.com/KimBaldry/BIO-MATE/product_data/supporting_information/citations) and in the BIO-MATE software (https://github.com/KimBaldry/BIOMATE-Rpackage/inst/citations). A look-up table is included in the BIO-MATE software to help users find relevant BibTeX entries needed to cite datasets appropriately (https://github.com/KimBaldry/BIOMATE-Rpackage/tree/main/data). A function export_ref supports the export of a smaller BibTeX file based on user selections of EXPOCODES and data streams that they have accessed through the product. This allows references to be easily appended to a bibliography as required.
Reformatting and linking data streams with BIO-MATE R software
The BIO-MATE R software was run to reformat data files to the WHP (CCHDO)-Exchange format (https://exchange-format.readthedocs.io/en/latest/index.html), using the original or split data files, processing metadata and citation information as input. The software arranges reformatted WHPE files into four data streams in local directories that include separate WHPE files, for each EXPOCODE, and for underway sensors, profiling sensor casts, pigment measurements, and POC measurements.
Each data stream has its own reformatting function within the BIO-MATE R software (UWY_to_WHPE, PROF_to_WHPE, PIG_to_WHPE, POC_to_WHPE). The software requires physical (underway sensor and profiling sensor) data streams to be reformatted before biological (pigment and POC) data streams, to accommodate a biological-physical matching algorithm within the PIG_to_WHPE and POC_to_WHPE functions. The algorithm links biological data in the pigment and POC data streams to the physical data in the profiling sensor and underway sensor data streams. Biological data records are given a profiling sensor identification tag (CTD_ID) if matched to physical data in BIO-MATE.
To match biological data to physical data, the algorithm first uses EXPOCODES to find relevant physical data in profiling sensor data streams. It then matches biological and physical data records by comparing station number (STNBR) and cast number (CASTNO) records. If matches are detected using STNBR and CASTNO, the validity of these matches is checked by comparing time and position information, but if position and time were not recorded in biological datasets (4157 pigment and 1948 POC records) it is assumed that the STNNBR and CASTNO records are correct if they match between data streams (e.g. in the JGOFS records). If position or time was recorded, a check on identified matches is performed to see if both the biological and physical data record data either within 24 hours of each other or within 8 km^507^. This quick check catches cases where STNNBR and CASTNO are used in similar ways within physical and biological sampling, but exact matches do not correspond to the same sampling event.
If matches couldn’t be identified using STNBR and CASTNO between datasets a more rigorous search was performed using a database of time and position information from all profiling sensor data relating to the EXPOCODE. Matches were then found for biological data, if it contains position information, by finding the closest profiling sensor record within 1km in the database. If time information exits, matches are identified as the closest profiling sensor record within 6 hours, otherwise only matching date information is required. These position and time constraints are tighter than if STNNBR and CASTNBR records were matched. Using this process all biological sampling events had matching physical sampling events. Matching has only been implemented with physical profiling sensor data and not to physical underway data. Underway surface data do not require station IDs and are more simply found with EXPOCODE and position and/or time.
Quality assurance
Limited quality assurance has been performed on the BIO-MATE data product and is variable across published datasets. As a supplement we include some insights into the quality of pigment data and chlorophyll fluorescence profiles which has been obtained through visual inspection (Supplementary QA/QC). The initial integrity of these data records lies with the Principal Investigators of the published data record. As a result, reformatted data have varying levels of quality control and post-processing. We have included cruise report citations in our product to aid in further data quality assurance efforts.
This allows a range of users to benefit from the BIO-MATE aggregate product and ensures data quality remains at the standard it was published. The quality assurance required of physical and biological ocean data varies according to application and is up to the user to confirm the data is suitable for their application. Future versions of BIO-MATE could implement quality assurance metrics under community consensus. The data can now be easily ingested by other data synthesis efforts, like GLODAP^466,467^ and the World Ocean Database (WOD), which implement established QA/QC protocols.
Data Records
The BIO-MATE data product^9^ is stored on the IMAS data portal (https://data.imas.utas.edu.au) and available on the AODN (https://portal.aodn.org.au/), formatted as four data streams linked through unique EXPOCODES. Supporting data contains a metadata table and BibTeX citation files. The spatial extent of the data records is confined largely to the Southern Ocean and was collected from 1985–2018 (Fig. 4). A summary of the data records in the BIO-MATE aggregate data product is presented in Tables 1–2.Fig. 4. The spatiotemporal distribution of different data streams and bio-physical matches in the BIO-MATE data compilation.Table 1. Summary of the pigment data records contained in the first version of BIO-MATE.StatisticAll pigment recordsSubsurface profile records (>4 depth samples above 75 m)Surface records (<10 m)Number of voyages17494146Number of records65,83438,45818,025Unique samples (no replicates)62,02036,09515,916Unique samples in lat and lon (not depth)14,9814,72610,432Bio-physical matches50,04838,45812,003HPLC and fluorometry matches3,0081,429851Number of HPLC records27,29913,6677,513Number of Fluorometry records38,71724,99310,520Matches with CTDFLUOR records25,78720,0735,862Matches with CTDBBP700 records2,8292,460355Matches with CTDBEAMCP records6,9805,777917Table 2Summary of the profiling sensor data contained within the first version of BIO-MATE.Number of voyages127.00Number of profiles11,818.00Profiles with pressure records (%)100.00Profiles with salinity records (%)99.87Profiles with temperature records (%)99.90Profiles with oxygen records (%)42.44
Underway sensor data stream
The underway sensor data stream contains a comma delimited WHP-Exchange file for each voyage ([EXPOCODE]_UWY.csv). The format of this file consists of headers to store metadata, followed by a data table that reports records collected by underway sensors mounted on the vessel (Data Records Table 1).
Profiling sensor data stream
The profiling sensor data stream contains a comma delimited WHP-Exchange file for each unique profiling cast conducted on each voyage ([EXPOCODE][station number][cast number]_ctd1.csv). The file is formatted to store metadata as headers which is followed by the data table that reports records from profiling sensors mounted on a sampling rosette (Data Records Table 2).
Pigment data stream
The pigment data stream contains a comma delimited WHP-Exchange file for each voyage (named [EXPOCODE]PIG[SOURCED_FROM]_[METHOD].csv). The format of this file consists of headers to store supporting information, followed by a data table that records measurements from the laboratory analysis of seawater samples for pigments performed by principal investigators (Data Records Table 3). The laboratory analyses considered are fluorometric determination and high-performance liquid chromatography (HPLC).
Particulate organic carbon data stream
The POC data stream contains a comma delimited WHP-Exchange file for each voyage (named [EXPOCODE]POC[SOURCED_FROM]_[METHOD].csv). The format of this file consists of headers to store supporting information, followed by a data table that records measurements from the lab analysis of seawater samples for particulate organic carbon performed by principal investigators (Data Records Table 4).
Supporting data
Supporting data are included in the BIO-MATE aggregate data product to support the correct citation of data and guide user access to data. This data includes (1) A BibTeX file, that contains information to reference all BIO-MATE data records (2) An index table indicating data availability and citation tags against data records listed by EXPOCODE, data stream, method and source, (3) A records table for all data repositories from which BIO-MATE data was sourced and (4) A records table for all pigment and POC analysis methods used in BIO-MATE data.
Technical Validation
We validated the quality of the BIO-MATE data compilation, by displaying a number of key data distributions and trends. This validation does not confirm the quality of individual data points, in which the authors have placed no additional quality assurance to the published datasets.
The location data associated with the published datasets has been interpreted correctly by the software. This is evident from the success of the biophysical matching algorithm, along with the spatial distribution of the data and recorded sampling depths (Fig. 4). The data are predominantly collected in the month of January between 1991–2010. This is consistent with the fact that ship-based sampling in the Southern Ocean is conducted during Austral summer and displays a lag time in publishing most recent datasets to data repositories. All data are in the ocean, not on land, confirming the absence of spurious location data, and most samples are located in the Southern Ocean which is consistent with our search constraints. Finally information on sampling time of ship-based biological data is as expected, and CTD sampling times (start, bottom and end) are sequential and follow a trend with sampling depth (Fig. 5).Fig. 5. The time difference between the bottom depth (i.e. deepest position on the cast) and end depth (i.e last sampling position) of a profiling sensor cast versus the bottom depth of the cast. Outliers with a bottom depth close to 0, likely represent shallow testing or calibration casts.
The biological ocean data associated with the published datasets has been interpreted correctly by the software. Overall, fluorometrically derived chlorophyll (FCHLORA), HPLC derived chlorophyll a (Chl a) and HPLC derived total chlorophyll (TCHLA) measurements show a log-normal distribution, as expected. High values (>10 μg/l) are constrained to the coastal zones as expected (Fig. 6).Fig. 6. The (a) distribution of chlorophyll-a derived from high-performance liquid chromatography (Chla), total chlorophyll-a derived from high-performance liquid chromatography (TCHLA) and chlorophyll-a derived from fluorometric determination (FCHLORA) in the BIO-MATE data compilation and (b) the location of high (>10 μg/l) Chla, TCHLA and FCHLA measurements.
There is a linear relationship between chlorophyll-a derived from HPLC methods and chlorophyll derived from fluorometric methods (Fig. 7). Five fluorometric methods to derive chlorophyll have coincident HPLC measurements. Briefly, the ANTXVIII^492^_and JGOFS^491^ methods shows good correlation between the fluorometric and HPLC. The PALMER_LTER^497^ method shows considerable variability, which may be due to the coastal location of most samples and the influence of accessory pigments, but further investigation is needed. Only a small number of coincident HPLC measurements were collected alongside other fluorometric methods (<11), making it difficult to assess their quality.Fig. 7A comparison of fluorometrically derived chlorophyll (FCHLORA) methods against total chlorophyll-a derived from HPLC measurements (TCHLA). The methods presented in this figure are ANTXVII_2^491^, JGOFS^490^ and PALMER_LTER^496^ which are widely used in the dataset.
Our validation plots show that fluorometric determination of chlorophyll tends to overestimate chlorophyll in the Southern Ocean. However, considerable variability is observed as the over-estimation or underestimation of chlorophyll-a by fluorometry is regionally dependant with changing phytoplankton assemblages^508–510^. A recent international intercomparison has also highlighted higher uncertainties, possibly due to low filtration volumes and different extraction and storage methods and suggests new standards for these measurements^511^. Despite these uncertainties, visual inspection of the profiles show that distributions of chlorophyll with depth are often well captured by fluorometric measurements.
The physical ocean data associated with published datasets has been interpreted correctly by the software. Temperature and salinity ranges fall within expected vales for the ocean and display expected trends with latitude (Fig. 8).Fig. 8. The distribution of temperature and salinity data measured at 10m by profiling sensors in the BIO-MATE data compilation.
Usage Notes
The community is welcome to contribute to the development of BIO-MATE software and to contribute published data to the aggregation, by following a user guide (Fig. 3).
Contributing to BIO-MATE software development
It is recommended that changes to BIO-MATE software be made through Git Hub. Contributors can fork the existing repository (https://github.com/KimBaldry/BIOMATE-Rpackage) and make changes directly to the source code. Once changes are made, they can be directed back to the BIO-MATE R package repository and released as an updated version of the BIO-MATE software. If the BIO-MATE source code is to be significantly developed, we suggest that the corresponding author is contacted and a hand-over of the software is negotiated. We encourage the addition of new data streams to BIO-MATE, the expansion of BIO-MATE capabilities, the addition of quality assurances and increases in software efficiency.
Contributing data to BIO-MATE
Users can create their own workflows using the BIO-MATE R package to reformat data and information (Fig. 3; https://github.com/KimBaldry/BIO-MATE/blob/main/BIO-MATE.Rmd). Once data have been reformatted, they can be submitted to the corresponding author via Git Hub (https://github.com/KimBaldry/BIOSHARE-submissions) or direct communication. We ask that all data submitted to BIO-MATE are published elsewhere and that users enter an accurate citation for the data they are submitting.
Currently, BIO-MATE only supports data files stored in delimited text formats, with structured headers and columns in a data table, and NetCDF format. The user is required to enter in some metadata to inform the software on input formats (Supplementary Processing Metadata Table).
Recommended use in data analyses
We encourage the use of the data aggregate product as a new integrated database of biological and physical data. Data files from selected voyages can be identified using unique EXPOCODES and CTD_IDs. This makes it easy to use multiple data streams in analysis, by indexing files across these EXPOCODES. Alternatively, the selection tool on the IMAS repository helps users to select voyages using spatial bounds.
Supplementary information
Processing Metadata Supplementary QA/QC Tables refered to in the Data Records Section
The reference list from the paper itself. Each links out to its DOI / PubMed record.
- 1Raymond WS The ocean’s role in climate Oceanography 201831324010.5670/oceanog.2018.225 · doi ↗
- 2Ainley DG Fraser WR Smith WO Hopkins TL Torres JJ The structure of upper level pelagic food webs in the Antarctic: Effect of phytoplankton distribution J. Mar. Syst.1991211112210.1016/0924-7963(91)90017-O · doi ↗
- 3Basu S Mackey KRM Phytoplankton as key mediators of the biological carbon pump: Their responses to a changing climate Sustainability 20181086910.3390/su 10030869 · doi ↗
- 4Carranza MM When mixed layers are not mixed. Storm-driven mixing and bio-optical vertical gradients in mixed layers of the Southern Ocean J. Geophys. Res. Oceans 20181237264728910.1029/2018 JC 014416 · doi ↗
- 5Prairie JC Sutherland KR Nickols KJ Kaltenberg AM Biophysical interactions in the plankton: A cross-scale review Limnol. and Oceanogr. Fluids and Environments 2012212114510.1215/21573689-1964713 · doi ↗
- 6Wihsgott JU Observations of vertical mixing in autumn and its effect on the autumn phytoplankton bloom Prog. Oceanogr.201917710205910.1016/j.pocean.2019.01.001 · doi ↗
- 7Brody SR Lozier MS Characterizing upper-ocean mixing and its effect on the spring phytoplankton bloom with in situ data ICES J. Mar. Sci.2015721961197010.1093/icesjms/fsv 006 · doi ↗
- 8Mignot AD’Ortenzio F Taillandier V Cossarini G Salon S Quantifying observational errors in biogeochemical-argo oxygen, nitrate, and chlorophyll a concentrations Geophys. Res. Lett.2019464330433710.1029/2018 GL 080541 · doi ↗