Obesity- and lipid-related indices as a predictor of type 2 diabetes in a national cohort study
Ying Wang, Xiaoyun Zhang, Yuqing Li, Jiaofeng Gui, Yujin Mei, Xue Yang, Haiyang Liu, Lei-lei Guo, Jinlong Li, Yunxiao Lei, Xiaoping Li, Lu Sun, Liu Yang, Ting Yuan, Congzhi Wang, Dongmei Zhang, Jing Li, Mingming Liu, Ying Hua, Lin Zhang

TL;DR
This study shows that obesity- and lipid-related indices can help predict type 2 diabetes in middle-aged and elderly Chinese adults.
Contribution
The study identifies TyG-WHtR as the best predictor of type 2 diabetes among various obesity- and lipid-related indices in Chinese adults.
Findings
The prevalence of type 2 diabetes in middle-aged and elderly Chinese adults was 9.02% in males and 9.15% in females.
TyG-WHtR had the highest predictive power for type 2 diabetes with AUC values of 0.600 in males and 0.664 in females.
All 13 obesity- and lipid-related indices showed modest but significant predictive power for type 2 diabetes.
Abstract
Type 2 diabetes mellitus (T2DM) remains a major and widespread public health concern throughout the world. The prevalence of T2DM in the elderly has risen to the top of the list of public health concerns. In this study, obesity- and lipid-related indices were used to predict T2DM in middle-aged and elderly Chinese adults. The data came from the China Health and Retirement Longitudinal Study (CHARLS), including 7902 middle-aged and elderly participants aged 45 years or above. The study assessed the association of obesity- and lipid-related indices and T2DM by measuring 13 indicators, including body mass index (BMI), waist circumference(WC), waist-height ratio (WHtR), conicity index(CI), visceral adiposity index (VAI), Chinese visceral adiposity index (CVAI), lipid accumulation product (LAP), a body shape index (ABSI), body roundness index (BRI), triglyceride glucose index (TyG-index)…
Genes, proteins, chemicals, diseases, species, mutations and cell lines named across the full text — each resolved to its canonical identifier and authoritative record.
Click any figure to enlarge with its caption.
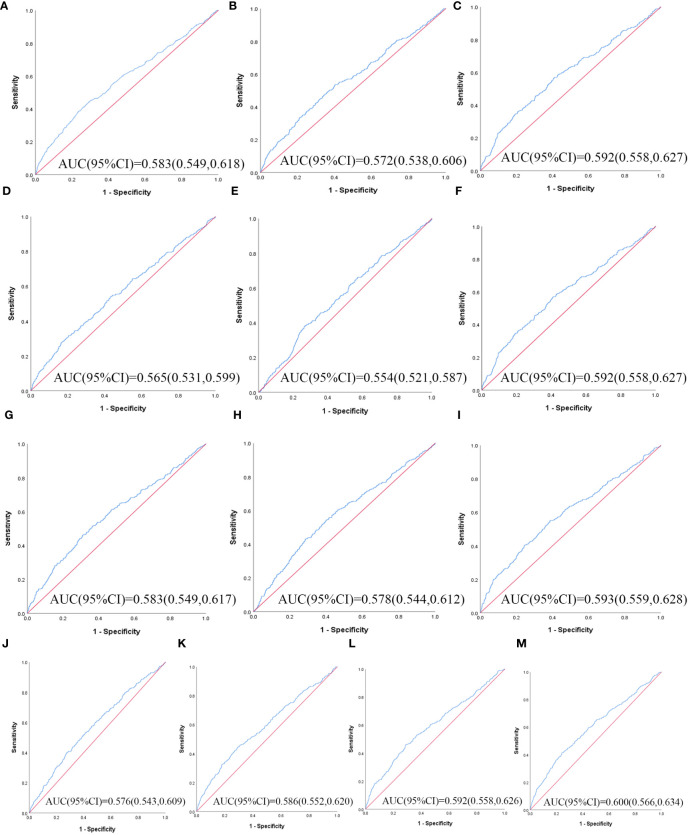 Figure 1
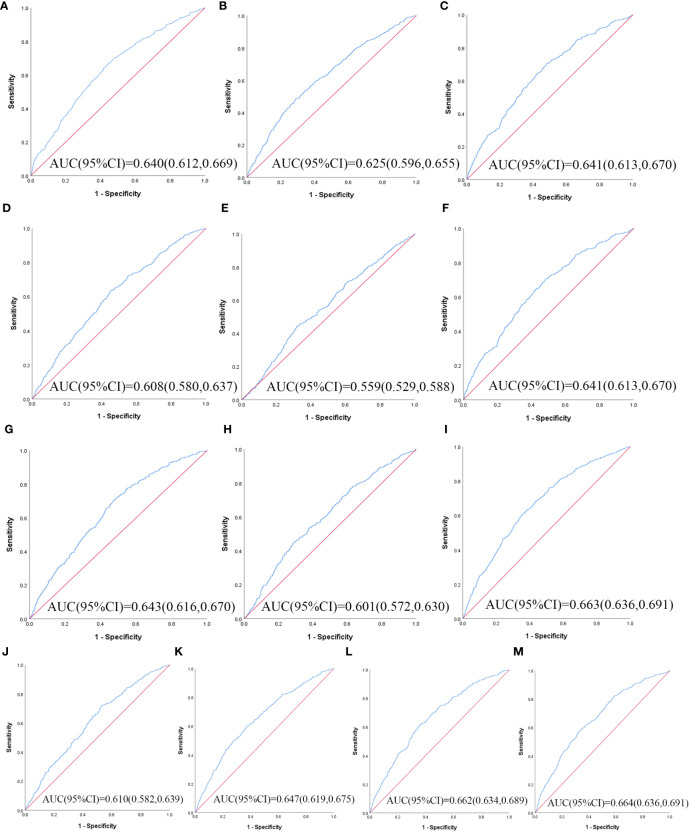 Figure 2
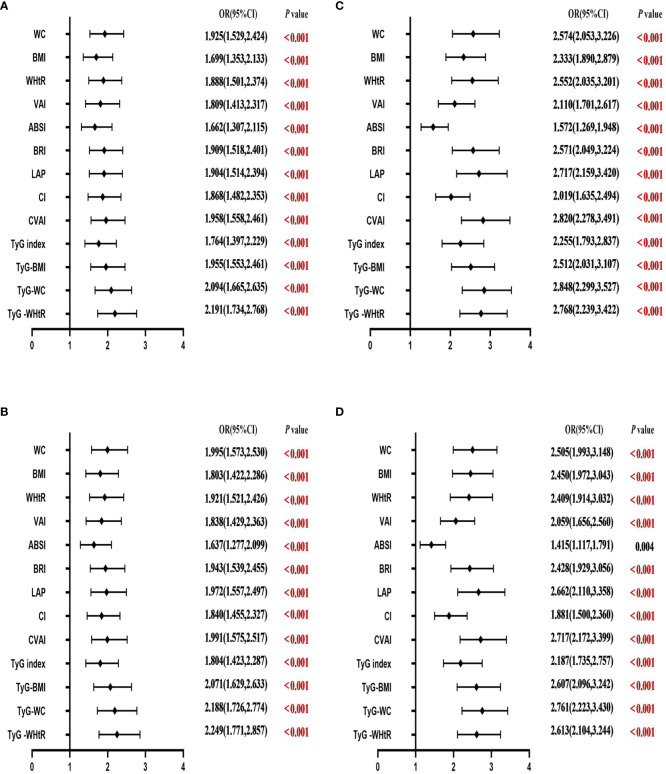 Figure 3
| Variables | Male | Female | Total |
|
|
|---|---|---|---|---|---|
| N (%) | N (%) | N (%) | |||
| N | 3638 (46.04) | 4264 (53.96) | 7902 (100) | ||
| Age(years) | |||||
| 45-54 | 1107 (30.43) | 167 3(39.24) | 2780 (35.18) | 79.602 | < 0.001 |
| 55-64 | 1420 (39.03) | 1562 (36.63) | 2982 (37.74) | ||
| 65-74 | 814 (22.37) | 716 (16.79) | 1530 (19.36) | ||
| ≥75 | 297 (8.16) | 313 (7.34) | 610 (7.72) | ||
| Education | |||||
| Illiterate | 501 (13.77) | 1807 (42.38) | 2308 (29.21) | 796.902 | < 0.001 |
| Less than elementary school | 2669 (73.36) | 2173 (50.96) | 4842 (61.28) | ||
| High school | 306 (8.41) | 212 (4.97) | 518 (6.56) | ||
| Above vocational school | 162 (4.45) | 72 (1.69) | 234(2.96) | ||
| Marital status | |||||
| Single | 337(9.26) | 645 (15.13) | 982 (12.43) | 62.013 | < 0.001 |
| Married | 3301(90.74) | 3619 (84.87) | 6920 (87.57) | ||
| Current residence | |||||
| Rural | 3363(92.44) | 3968 (93.06) | 7331 (92.77) | 1.116 | 0.291 |
| Urban | 275(7.56) | 296 (6.94) | 571 (7.23) | ||
| Current smoking | |||||
| No | 893(24.55) | 3937 (92.33) | 4830 (61.12) | 3796.205 | < 0.001 |
| Former smoke | 585(16.08) | 77 (1.81) | 662(8.38) | ||
| Current smoke | 2160(59.37) | 250 (5.86) | 2410 (30.50) | ||
| Alcohol drinking | |||||
| No | 1592(43.76) | 3730 (87.48) | 5322 (67.35) | 1771.074 | < 0.001 |
| Less than once a month | 403(11.08) | 215 (5.04) | 618 (7.82) | ||
| More than once a month | 1643(45.16) | 319 (7.48) | 1962 (24.83) | ||
| Taking activities | |||||
| No | 1801(49.51) | 2161 (50.68) | 3962 (50.14) | 1.084 | 0.298 |
| Yes | 1837(50.49) | 2103 (49.32) | 3940 (49.86) | ||
| Having regular exercises | |||||
| No exercise | 2245(61.71) | 2596 (60.88) | 4841 (61.26) | 1.028 | 0.598 |
| Less than exercises | 686(18.86) | 842 (19.75) | 1528 (19.34) | ||
| egular exercises | 707(19.43) | 826 (19.37) | 1533 (19.40) | ||
| Chronic diseases(counts) | |||||
| 0 | 1267(34.83) | 1322 (31.00) | 2589 (32.76) | 13.892 | 0.001 |
| 01-Feb | 1820(50.03) | 2226 (52.20) | 4046 (51.20) | ||
| Mar-14 | 551(15.15) | 716 (16.79) | 1267 (16.03) | ||
| WC | 84.22 ± 9.49 | 84.99 ± 10.05 | 84.63 ± 9.80 | -3.487 | < 0.001 |
| BMI | 22.72 ± 3.48 | 23.78 ± 3.92 | 23.29 ± 3.76 | -12.738 | < 0.001 |
| WHtR | 0.51 ± 0.06 | 0.56 ± 0.07 | 0.54 ± 0.06 | -31.109 | < 0.001 |
| VAI | 3.49 ± 3.35 | 5.47 ± 4.77 | 4.56 ± 4.29 | -21.566 | < 0.001 |
| ABSI | 0.08 ± 0.01 | 0.08 ± 0.01 | 0.08 ± 0.01 | -9.591 | < 0.001 |
| BRI | 3.69 ± 1.10 | 4.57 ± 1.41 | 4.16 ± 1.35 | -31.091 | < 0.001 |
| LAP | 27.05 ± 26.61 | 39.83 ± 30.87 | 33.95 ± 29.67 | -19.758 | < 0.001 |
| CI | 1.27 ± 0.08 | 1.30 ± 0.10 | 1.28 ± 0.09 | -14.182 | < 0.001 |
| CVAI | 91.47 ± 45.25 | 102.64 ± 42.06 | 97.49 ± 43.91 | -11.295 | < 0.001 |
| TyG index | 8.50 ± 0.56 | 8.60 ± 0.54 | 8.56 ± 0.55 | -8.467 | < 0.001 |
| TyG-BMI | 193.63 ± 35.46 | 205.10 ± 39.08 | 199.82 ± 37.89 | -13.677 | < 0.001 |
| TyG-WC | 717.41 ± 106.25 | 732.57 ± 108.26 | 725.59 ± 107.60 | -6.26 | < 0.001 |
| TyG -WHtR | 4.38 ± 0.62 | 4.80 ± 0.71 | 4.61 ± 0.70 | -27.746 | < 0.001 |
| Variables | Male (N=3638) |
|
| Female (N=4264) |
|
| ||
|---|---|---|---|---|---|---|---|---|
| N (%) | With T2DM | Without T2DM | With T2DM | Without T2DM | ||||
| N | 328 (9.02) | 3310 (90.98) | 390 (9.15) | 3874 (90.85) | ||||
| Age(years) | ||||||||
| 45-54 | 85 (25.91) | 1022 (30.88) | 3.745 | 0.290 | 126(32.31) | 1547 (39.93) | 15.792 | 0.001 |
| 55-64 | 140 (42.68) | 1280 (38.67) | 142 (36.41) | 1420 (36.65) | ||||
| 65-74 | 75 (22.87) | 739 (22.33) | 90 (23.08) | 626 (16.16) | ||||
| ≥75 | 28 (8.54) | 269(8.13) | 32 (8.21) | 281 (7.25) | ||||
| Education | ||||||||
| Illiterate | 38 (11.59) | 463 (13.99) | 3.632 | 0.304 | 177 (45.38) | 1630 (42.08) | 6.344 | 0.096 |
| Less than elementary school | 255 (77.74) | 2414 (72.93) | 198 (50.77) | 1975 (50.98) | ||||
| High school | 22 (6.71) | 284 (8.58) | 10 (2.56) | 202 (5.21) | ||||
| Above vocational school | 13 (3.96) | 149 (4.50) | 5 (1.28) | 67 (1.73) | ||||
| Marital status | ||||||||
| Single | 32 (9.76) | 305 (9.21) | 0.104 | 0.747 | 68(17.44) | 577 (14.89) | 1.783 | 0.182 |
| Married | 296 (90.24) | 3005 (90.79) | 322 (82.56) | 3297 (85.11) | ||||
| Current residence | ||||||||
| Rural | 300 (91.46) | 3063 (92.54) | 0.493 | 0.483 | 373 (95.64) | 3595 (92.80) | 4.433 | 0.035 |
| Urban | 28 (8.54) | 247 (7.46) | 17 (4.36) | 279 (7.20) | ||||
| Current smoking | ||||||||
| No | 75 (22.87) | 818 (24.71) | 0.647 | 0.724 | 359 (92.05) | 3578 (92.36) | 0.638 | 0.727 |
| Former smoke | 52 (15.85) | 533 (16.10) | 9 (2.31) | 68 (1.76) | ||||
| Current smoke | 201 (61.28) | 1959 (59.18) | 22 (5.64) | 228 (5.89) | ||||
| Alcohol drinking | ||||||||
| No | 156 (47.56) | 1436 (43.38) | 2.117 | 0.347 | 352 (90.26) | 3378 (87.20) | 3.036 | 0.219 |
| Less than once a month | 34 (10.37) | 369 (11.15) | 15 (3.85) | 200 (5.16) | ||||
| More than once a month | 138 (42.07) | 1505 (45.47) | 23 (5.90) | 296 (7.64) | ||||
| Taking activities | ||||||||
| No | 158 (48.17) | 1643 (49.64) | 0.257 | 0.612 | 205 (52.56) | 1956 (50.49) | 0.610 | 0.435 |
| Yes | 170 (51.83) | 1667 (50.36) | 185 (47.44) | 1918 (49.51) | ||||
| Having regular exercises | ||||||||
| No exercise | 199 (60.67) | 2046 (61.81) | 0.173 | 0.917 | 231 (59.23) | 2365 (61.05) | 1.801 | 0.406 |
| Less than exercises | 64 (19.51) | 622 (18.79) | 87 (22.31) | 755 (19.49) | ||||
| Regular exercises | 65 (19.82) | 642 (19.40) | 72 (18.46) | 754 (19.46) | ||||
| Chronic diseases(counts) | ||||||||
| 0 | 106 (32.32) | 1161 (35.08) | 4.123 | 0.127 | 91 (23.33) | 1231 (31.78) | 13.312 | 0.001 |
| 1-2 | 160 (48.78) | 1660 (50.15) | 218 (55.90) | 2008 (51.83) | ||||
| 3-14 | 62 (18.90) | 489 (14.77) | 81 (20.77) | 635 (16.39) | ||||
| WC | 87.06 ± 10.68 | 83.94 ± 9.32 | -5.113 | < 0.001 | 89.61 ± 10.43 | 84.52 ± 9.89 | -9.631 | < 0.001 |
| BMI | 23.70 ± 4.28 | 22.62 ± 3.38 | -4.417 | < 0.001 | 25.31 ± 3.96 | 23.63 ± 3.89 | -8.107 | < 0.001 |
| WHtR | 0.53 ± 0.06 | 0.51 ± 0.05 | -5.489 | < 0.001 | 0.59 ± 0.07 | 0.55 ± 0.06 | -9.528 | < 0.001 |
| VAI | 4.39 ± 4.34 | 3.41 ± 3.22 | -4.010 | < 0.001 | 6.79 ± 5.28 | 5.34 ± 4.70 | -5.201 | < 0.001 |
| ABSI | 0.08 ± 0.01 | 0.08 ± 0.01 | -2.120 | 0.034 | 0.08 ± 0.01 | 0.08 ± 0.01 | -2.868 | 0.004 |
| BRI | 4.06 ± 1.28 | 3.65 ± 1.07 | -5.559 | < 0.001 | 5.22 ± 1.51 | 4.50 ± 1.39 | -9.613 | < 0.001 |
| LAP | 36.06 ± 37.00 | 26.16 ± 25.18 | -4.738 | < 0.001 | 52.43 ± 35.78 | 38.56 ± 30.05 | -7.395 | < 0.001 |
| CI | 1.29 ± 0.09 | 1.27 ± 0.08 | -4.016 | < 0.001 | 1.32 ± 0.09 | 1.29 ± 0.10 | -5.943 | < 0.001 |
| CVAI | 106.66 ± 51.51 | 89.96 ± 44.31 | -5.669 | < 0.001 | 124.29 ± 40.84 | 100.45 ± 41.56 | -10.813 | < 0.001 |
| TyG index | 8.64 ± 0.60 | 8.49 ± 0.55 | -4.380 | < 0.001 | 8.79 ± 0.52 | 8.58 ± 0.54 | -7.249 | < 0.001 |
| TyG-BMI | 205.33 ± 42.58 | 192.47 ± 34.47 | -5.299 | < 0.001 | 222.74 ± 38.60 | 203.33 ± 38.69 | -9.447 | < 0.001 |
| TyG-WC | 754.21 ± 122.30 | 713.76 ± 103.83 | -5.787 | < 0.001 | 788.49 ± 107.94 | 726.94 ± 106.70 | -10.847 | < 0.001 |
| TyG -WHtR | 4.61 ± 0.72 | 4.36 ± 0.61 | -6.127 | < 0.001 | 5.16 ± 0.69 | 4.76 ± 0.70 | -10.813 | < 0.001 |
| N=7902 | WC | BMI | WHtR | VAI | ABSI | BRI | LAP | CI | CVAI | TyG index | TyG-BMI | TyG-WC | TyG -WHtR |
|---|---|---|---|---|---|---|---|---|---|---|---|---|---|
| Male | |||||||||||||
| Area under curve | 0.583 | 0.572 | 0.592 | 0.565 | 0.554 | 0.592 | 0.583 | 0.578 | 0.593 | 0.576 | 0.586 | 0.592 | 0.600 |
| Std. Error | 0.018 | 0.017 | 0.017 | 0.017 | 0.017 | 0.017 | 0.017 | 0.017 | 0.018 | 0.017 | 0.017 | 0.017 | 0.017 |
| 95%CI | 0.549,0.618 | 0.538,0.606 | 0.558,0.627 | 0.531,0.599 | 0.521,0.587 | 0.558,0.627 | 0.549,0.617 | 0.544,0.612 | 0.559,0.628 | 0.543,0.609 | 0.552,0.620 | 0.558,0.626 | 0.566,0.634 |
|
| < 0.001 | < 0.001 | < 0.001 | < 0.001 | 0.001 | < 0.001 | < 0.001 | < 0.001 | < 0.001 | < 0.001 | < 0.001 | < 0.001 | < 0.001 |
| Optimal cutoffs | 88.850 | 23.082 | 0.520 | 4.573 | 0.085 | 3.739 | 28.333 | 1.307 | 99.429 | 8.762 | 207.797 | 765.677 | 4.769 |
| J-Youden | 0.151 | 0.135 | 0.160 | 0.113 | 0.114 | 0.160 | 0.151 | 0.145 | 0.166 | 0.126 | 0.154 | 0.171 | 0.173 |
| Sensitivity (%) | 44.21% | 53.70% | 57.01% | 31.70% | 38.41% | 57.01% | 46.34% | 42.99% | 55.18% | 39.94% | 44.51% | 46.04% | 41.46% |
| Specificity (%) | 70.85% | 59.80% | 59.03% | 79.60% | 72.99% | 59.03% | 68.79% | 71.45% | 61.39% | 72.66% | 70.91% | 71.06% | 75.80% |
| (+) Likelihood ratio | 1.516 | 1.336 | 1.392 | 1.554 | 1.422 | 1.392 | 1.485 | 1.506 | 1.429 | 1.461 | 1.530 | 1.591 | 1.713 |
| (-) Likelihood ratio | 0.788 | 0.774 | 0.728 | 0.858 | 0.844 | 0.728 | 0.780 | 0.798 | 0.730 | 0.827 | 0.783 | 0.759 | 0.772 |
| Female | |||||||||||||
| Area under curve | 0.640 | 0.625 | 0.641 | 0.608 | 0.559 | 0.641 | 0.643 | 0.601 | 0.663 | 0.610 | 0.647 | 0.662 | 0.664 |
| Std. Error | 0.015 | 0.015 | 0.014 | 0.015 | 0.015 | 0.014 | 0.014 | 0.015 | 0.014 | 0.014 | 0.015 | 0.014 | 0.014 |
| 95%CI | 0.612,0.669 | 0.596,0.655 | 0.613,0.670 | 0.580,0.637 | 0.529,0.588 | 0.613,0.670 | 0.616,0.670 | 0.572,0.630 | 0.636,0.691 | 0.582,0.639 | 0.619,0.675 | 0.634,0.689 | 0.636,0.691 |
|
| < 0.001 | < 0.001 | < 0.001 | < 0.001 | < 0.001 | < 0.001 | < 0.001 | < 0.001 | < 0.001 | < 0.001 | < 0.001 | < 0.001 | < 0.001 |
| Optimal cutoffs | 84.950 | 25.422 | 0.553 | 4.277 | 0.086 | 4.416 | 30.835 | 1.341 | 114.005 | 8.516 | 212.290 | 759.606 | 5.031 |
| J-Youden | 0.224 | 0.198 | 0.223 | 0.183 | 0.123 | 0.223 | 0.234 | 0.163 | 0.253 | 0.191 | 0.228 | 0.256 | 0.248 |
| Sensitivity (%) | 70.30% | 48.72% | 70.51% | 63.33% | 44.40% | 70.51% | 72.05% | 44.90% | 60.51% | 72.10% | 59.70% | 61.28% | 58.72% |
| Specificity (%) | 52.10% | 71.09% | 51.83% | 55.01% | 67.90% | 51.83% | 51.34% | 71.40% | 64.79% | 47.00% | 63.10% | 64.27% | 66.06% |
| (+) Likelihood ratio | 1.468 | 1.685 | 1.464 | 1.408 | 1.383 | 1.464 | 1.481 | 1.570 | 1.719 | 1.360 | 1.618 | 1.715 | 1.730 |
| (-) Likelihood ratio | 0.570 | 0.721 | 0.569 | 0.667 | 0.819 | 0.569 | 0.544 | 0.772 | 0.609 | 0.594 | 0.639 | 0.602 | 0.625 |
| T2DM | WC | BMI | WHtR | VAI | ABSI | BRI | LAP | CI | CVAI | TyG index | TyG-BMI | TyG-WC | TyG -WHtR |
|---|---|---|---|---|---|---|---|---|---|---|---|---|---|
| Male | |||||||||||||
| Unadjusted OR (95% CI) | 1.925(1.529,2.424) ** | 1.699(1.353,2.133) ** | 1.888(1.501,2.374) ** | 1.809(1.413,2.317) ** | 1.662(1.307,2.115) ** | 1.909(1.518,2.401) ** | 1.904(1.514,2.394)** | 1.868(1.482,2.353) ** | 1.958(1.558,2.461)** | 1.764(1.397,2.229) ** | 1.955(1.553,2.461)** | 2.094(1.665,2.635) ** | 2.191(1.734,2.768) ** |
|
| < 0.001 | < 0.001 | < 0.001 | < 0.001 | < 0.001 | < 0.001 | < 0.001 | < 0.001 | < 0.001 | < 0.001 | < 0.001 | < 0.001 | < 0.001 |
| Adjusted OR (95% CI) | 1.995(1.573,2.530) ** | 1.803(1.422,2.286) ** | 1.921(1.521,2.426) ** | 1.838(1.429,2.363) ** | 1.637(1.277,2.099) ** | 1.943(1.539,2.455) ** | 1.972(1.557,2.497) ** | 1.840(1.455,2.327) ** | 1.991(1.575,2.517) ** | 1.804(1.423,2.287) ** | 2.071(1.629,2.633) ** | 2.188(1.726,2.774) ** | 2.249(1.771,2.857)** |
|
| < 0.001 | < 0.001 | < 0.001 | < 0.001 | < 0.001 | < 0.001 | < 0.001 | < 0.001 | < 0.001 | < 0.001 | < 0.001 | < 0.001 | < 0.001 |
| Female | |||||||||||||
| Unadjusted OR (95% CI) | 2.574(2.053,3.226) ** | 2.333(1.890,2.879) ** | 2.552(2.035,3.201) ** | 2.110(1.701,2.617) ** | 1.572(1.269,1.948) ** | 2.571(2.049,3.224) ** | 2.717(2.159,3.420) ** | 2.019(1.635,2.494) ** | 2.820(2.278,3.491) ** | 2.255(1.793,2.837) ** | 2.512(2.031,3.107) ** | 2.848(2.299,3.527) ** | 2.768(2.239,3.422) ** |
|
| < 0.001 | < 0.001 | < 0.001 | < 0.001 | < 0.001 | < 0.001 | < 0.001 | < 0.001 | < 0.001 | < 0.001 | < 0.001 | < 0.001 | < 0.001 |
| Adjusted OR (95% CI) | 2.505(1.993,3.148) ** | 2.450(1.972,3.043)** | 2.409(1.914,3.032) ** | 2.059(1.656,2.560) ** | 1.415(1.117,1.791) * | 2.428(1.929,3.056) ** | 2.662(2.110,3.358) ** | 1.881(1.500,2.360) ** | 2.717(2.172,3.399)** | 2.187(1.735,2.757) ** | 2.607(2.096,3.242) ** | 2.761(2.223,3.430) ** | 2.613(2.104,3.244) ** |
|
| < 0.001 | < 0.001 | < 0.001 | < 0.001 | 0.004 | < 0.001 | < 0.001 | < 0.001 | < 0.001 | < 0.001 | < 0.001 | < 0.001 | < 0.001 |
Peer Reviews
No public reviews on file for this paper yet. If you reviewed it on a platform where reviews are public (OpenReview, ICLR, NeurIPS, ICML), you can paste yours below so the community can read it here.
Videos
No videos yet. Explain this paper in a talk, walkthrough, or lecture? Add one.
Taxonomy
TopicsSpanish Literature and Culture Studies
Introduction
The percentage of older adults (defined as those 60 years of age or older) is expected to increase and reach >20% by the year 2050. China has the world’s largest elderly population, 201 million in 2015, which is expected to rise to 479 million by 2050 (1). Type 2 diabetes mellitus(T2DM) is a worldwide problem and the most prevalent metabolic disease affecting about 1 in 10 adults (10.5% of adults worldwide) (2). Over the last two years, the prevalence of T2DM has increased by 16%, which is an alarming increase (2). Without taking into account the risk of death associated with COVID-19, in 2021, approximately 12.2% of adult all-cause deaths worldwide will be due to diabetes and its complications (3). In addition, 10.6% of adults in the world have poor glucose tolerance, which puts them at high risk of developing T2DM (3). In parallel with the rise in prevalence, the economic costs of T2DM have also increased dramatically. Controlling the incidence of T2DM is the key to reducing the cost of global economic development and improving the health of individuals and communities.
T2DM is associated with a variety of factors. The increase in the incidence of T2DM is mainly due to changes in living conditions and habits, such as a sedentary lifestyle (4), physical inactivity (5), smoking (6), and alcohol consumption (7). Several epidemiological investigations have shown that obesity is the most important risk factor for T2DM, and it has a certain impact on the production of insulin resistance and disease progression (8). The epidemic of obesity contributes to the burden of T2DM in worldwide. In a meta-analysis of Mendelian randomization studies, the easiest and most generally used indicator of obesity, body mass index (BMI), was linked to a higher risk of T2DM (9). However, BMI is not entirely inclusive. Such as WC (waist circumference), waist-height ratio (WHtR), and lipid accumulation index (LAP) have been widely used in epidemiology to measure obesity or central obesity (10–13). We can use these indicators to explore the risk of developing T2DM.
It should be noted that no agreement has been reached on the association of obesity and lipid-associated indices with T2DM. For instance, the BMI is frequently used to estimate the likelihood of contracting chronic diseases including diabetes, hypertension, depression, and cancer (14–17). However, compared to other measurements like WC, WHR, and WHtR, BMI was the least accurate predictor for cardiovascular risk factors such as diabetes, hypertension, and dyslipidemia in the study conducted by Lee et al. (18). Some studies have suggested that WC appears to be a stronger predictor of diabetes than BMI in Western populations (19, 20), while the evidence on this remains contradictory in Asian populations (21, 22). Previous studies reported that the Chinese visceral adiposity index (CVAI) was superior to BMI, WC, or visceral adiposity index (VAI) for the diagnosis of diabetes and prediabetes (23, 24). Another study in Japan found that triglyceride glucose index (TyG-index) was linearly associated with the risk of T2DM in the population (25). From these studies, it can be concluded that obesity and lipid-related indices are closely related to T2DM. However, it is not clear which index performs better in predicting diabetes risk. Moreover, most of the research is carried out based on the West, and the results are different because of the differences in nationality and culture. Therefore, it is of great significance to further determine the correlation and predictive value between obesity and lipid-related indicators and T2DM in middle-aged and elderly people for guiding the prevention and treatment of T2DM in elderly people.
Currently, only a small number of cross-sectional studies have investigated the relationship between obesity and T2DM in elderly Chinese adults, but few studies have explored multiple indicators to predict T2DM risk, so to fill these gaps, we conducted a national retrospective cohort study in older Chinese adults. The longitudinal effects of 13 indicators on the incidence of T2DM were examined to predict the incidence of T2DM. This study provides a theoretical basis for early detection of T2DM, advanced and scientific medical prevention, and avoiding the occurrence of complications of T2DM, significantly improving the living standards of the elderly and prolonging life.
Method
Study design and setting
For this national cohort study, we used data from the China Wave2011 Longitudinal Study of Health and Retirement, a national longitudinal study of middle-aged and older Chinese people and their spouses, who were evaluated at baseline and followed up for two years (26). Individuals without T2DM in baseline from the China Health and Retirement Longitudinal Study (CHARLS) Wave 2011 study were included in our analysis after excluding subjects with missing data. Data gathering was then carried out in 2015. We enrolled 7902 individuals over 45 years of age in our nationwide cohort. The CHARLS project received approval from Peking University’s Biomedical Ethics Review Board, and each participant signed an informed consent form. The data and relevant data for this study are available at the CHARLS project website (http://charls.pku.edu.cn/).
Individuals
The subjects of this survey were selected from the CHARLS, Wave 1 (2011). The CHARLS Wave 2011 was used to select participants. Cohort studies are used in this investigation. In 2011, patients with undiagnosed T2DM were included in our follow-up cohort. Four years later, in 2015, the incident rate of those affected by 13 indicators was assessed.
Baseline characteristics
At baseline, trained researchers used a structured questionnaire to acquire sociodemographic status information and health-related indicators, including age, education, marriage, residence, drinking, smoking, activities, exercise, and chronic diseases. The majority of factors were based on our earlier research investigations (27–32).
Data collection and definitions
Fasting plasma glucose (FPG), HbA1c, TC, triglycerides (TG), high-density lipoprotein-cholesterol (HDL-c), and low-density lipoprotein-cholesterol (LDL-c) were measured by fasting blood samples. FPG, TG, TC, HDL-c, and LDL-c were determined by enzyme colorimetric assay, while the HbA1c test was carried out by high-performance liquid chromatography (HPLC) (33). T2DM was defined as 1) self-reported doctor-diagnosed diabetes, 2) fasting plasma glucose ≥7.0mmol/L, 3) 2-h plasma glucose ≥11.1mmol/L, or 4) HbA1c ≥6.5% (34). Participants with a diagnosis of T2DM at baseline were excluded from this analysis.
Measurements
The BMI was calculated based on the weight and height of the participants. According to the Chinese standard, BMI was classified into three categories: obesity (BMI ≥ 28 kg/m2), overweight (24 ≤ BMI< 28 kg/m2), and underweight and normal (BMI< 24 kg/m2) (35). The lower rib margin and the middle of the flexible measuring tape were used to determine the WC (32). Conicity Index (CI) was measured by WC, weight, and height (36). When calculating the Body shape Index (BSI), body roundness index (BRI), and VAI, it should be noted that VAI is not gender-specific like other measurements (37–39). WHtR is defined as the WC (m) divided by the height (m) (40). The LAP is calculated somewhat differently by subtracting from the WC (men: 65 cm, women: 58 cm) and multiplying it with TG (41). In order to create a more suitable metric for Chinese people, CVAI is built on VAI (42). The following formulas were used to measure the other anthropometric indexes (Equations 1-12).
Statistical analysis
All the statistical analyses were analyzed using STATA software version 25.0. Continuous variables were applied by mean (standard deviation, SD) depending on normal distribution or not, while the frequency with percentage was presented for categorical variables. A chi-squared test was run to compare dichotomous or categorical variables. Results from studies that were gender-specific are also included because the relationship between T2DM and obesity status varies between the sexes. The odds ratios (OR) and 95% confidence intervals (CI) for each of the 13 obesity- and lipid-related indices were calculated by binary logistic regression after adjusting for age, education, marital status, current residence, current smoking, alcohol consumption, activity participation, regular exercise, and chronic disease. The 13 indices were divided into two categories based on their optimal cutoff values. The P-value obtained by the statistical significance test is usually regarded as the statistical significance when P< 0.05, and the P< 0.001 is very significant. The ability of these indices to distinguish T2DM was tested by drawing the receiver operating curve (ROC curve) and AUC calculation. The ROC curve can be used to calculate the sensitivity, specificity, positive, negative, positive, positive, and negative. A Youden index (sensitivity + specificity 1) was used to select the cut-off points to evaluate classification accuracy.
Results
Table 1 shows the characteristics of the participants with complete samples. This study included 7902 patients, of which 3638 (46. 04%) were male, and 4 264 (53.96%) were female. Most of them were 45-64 years old, there were significant differences between men and women in age, education, marital status, current smoking, alcohol drinking, number of chronic diseases, WC, BMI, WHtR, VAI, ABSI, BRI, LAP, CI, CVAI, TyG index, TyG-BMI, TyG-WC and TyG-WHtR (P< 0.05). However, there was no statistical significance in the distribution of current residence, taking activities, and having regular exercises between the two groups (P > 0.05). Due to these marked gender differences (P< 0.05), the main analysis was conducted separately by gender.
Table 2 presents the baseline characteristics of T2DM and non-diabetic subjects by gender. Based on the findings, the percentage of women with T2DM was significantly higher (9.15% versus 9.02% for males). There were significant differences in WC, BMI, WHtR, VAI, ABSI, BRI, LAP, CI, CVAI, TyG, TyG-BMI, TyG-WC, and TyG-WHtR in men with T2DM (P< 0.05); There were significant differences in age, current residence, chronic illness, WC, BMI, WHtR, VAI, ABSI, BRI, LAP, CI, CVAI, CVAI, TyG-BMI, TyG-WC, and TyG-WHtR in women with T2DM (P< 0.05). There were no significant differences among T2DM subgroups, male or female, in terms of educational background, marital status, current smoking, alcohol drinking, taking activities, and having regular exercises (P > 0.05).
Table 3 illustrates the evaluation of the prediction using ROC curves and AUC. The ROC curves of each parameter for predicting the risk of T2DM are presented in Figures 1, 2. In men, the TyG -WHtR was the best predictor of T2DM in the middle-aged and elderly male population (AUC=0.600, SE=0.017, 95% CI=0.566-0.634, and optimal cut-off=4.769). Meanwhile, it can be observed from the table that WC (AUC = 0.583, S E = 0.018, 95% CI = 0.549-0.618, and optimal cut-off =88.850) and LAP (AUC = 0.583, S E = 0.017, 95% CI = 0.549-0.617, and optimal cut-off =28.333) had similar predictive values. Similarly, the predictive values were similar for the WHtR (AUC = 0.592, SE = 0.017, 95% CI =0.558-0.627, and optimal cut-off = 0.520), BRI (AUC = 0.592, SE = 0.017, 95% CI =0.558-0.627, and optimal cut-off =3.739) and TyG-WC (AUC = 0.592, SE = 0.017, 95% CI =0.558-0.626, and optimal cut-off = 765.677). In addition, in female patients, TyG -WHtR was also the best predictor of T2DM (AUC=0.664, SE=0.015, 95%CI 0.636-0.691, and optimal cut-off=5.031). Similarly, the predictive values were similar for the WHtR (AUC = 0.641, SE = 0.014, 95% CI =0.613-0.670, and optimal cut-off = 0.553), BRI (AUC = 0.641, SE = 0.014, 95% CI =0.613-0.670, and optimal cut-off =4.416). There was a statistical difference in all the indexes (P< 0.05). The results showed that the AUC of these 13 indexes was above 0.5, suggesting that they could predict the development of T2DM.
The ROC curves of each indicator in the prediction of T2DM risk in males. (A) WC, (B) BMI, (C) WHtR, (D) VAI, (E) ABSI, (F) BRI, (G) LAP, (H) CI, (I) CVAI, (J) TyG-index, (K) TyG-BMI, (L) TyG-WC, (M) TyG-WHtR.
The ROC curves of each indicator in the prediction of T2DM risk in females. (A) WC, (B) BMI, (C) WHtR, (D) VAI, (E) ABSI, (F) BRI, (G) LAP, (H) CI, (I) CVAI, (J) TyG-index, (K) TyG-BMI, (L) TyG-WC, (M) TyG-WHtR.
Table 4 shows the associations of obesity- and lipid-related indices with T2DM. In this survey, 13 obesity and lipid indices were converted into two categories according to the figures in Table 3. Table 4 is based on the transformed variables. In general, the greater the OR, the higher the risk. After adjusting for factors such as age, education, marital status, current residence, current smoking, alcohol drinking, taking activities, having regular exercises, and chronic diseases, both men’s and women’s odds of developing T2DM gradually increased with increasing obesity and lipid measurement units. After adjusting for all covariates, each unit rise in TyG -WHtR, for example, was related to a 2.249-fold (95% CI=1.771-2.857) increase in the likelihood of developing T2DM in males. Each unit increase in TyG-WC was linked to a 2.761-fold (95% CI=2.223-3.430) increase in the likelihood of developing T2DM in females. Among the 13 indicators, the correlation between ABSI and T2DM was weakest in males (OR=1.637, 95% CI: 1.277-2.099) and females (OR=1.415, 95% CI: 1.117-1.791). After adjusting for confounding factors, all indicators were statistically significant (P< 0.05). Figure 3 illustrates the forest plot or values before and after adjustment for the confounding factors for men and women.
Forest diagram of OR before and after adjustment of confounding factors for males and females. (A) Male unadjusted; (B) male adjusted; (C) female unadjusted; (D) female adjusted. Adjusted OR: Adjusted for age, educational levels, marital status, live place, current smoking, alcohol drinking, activities, exercises, and chronic diseases.
Discussion
T2DM has been identified as a major public health problem with significant implications for people’s lives and health spending. A significant risk factor for T2DM is obesity. Finding a quick and easy way to test for diabetes can therefore serve as a foundation for an early diagnosis of T2DM. This study evaluated the predictive power of 13 obesity- and lipid-related indices in identifying the risk of T2DM in middle-aged and old adults in China. In our study, a total of 7902 people participated in the study. After adjusting for population factors in our population-based cohort analysis, we found a statistically significant relationship between obesity and lipid-related indices and T2DM.
This study revealed that 13 obesity and lipid-related indicators are all related to the risk of T2DM. Similar to other studies, all 13 indicators play an important role in different populations (43–45). After adjusting for multiple covariates, as the 13 indicators increase, the prevalence of T2DM increases. Among them, TyG-WHtR and CVAI have a stronger correlation with the prevalence of T2DM.
As far as we know, insulin resistance (IR) and islet β-cell dysfunction are the main pathophysiology of T2DM (46–48). A great deal of hormones and cytokines are produced in adipose and adipose tissue, which are important in glucose metabolism and lipid metabolism (49). A characteristic of several metabolic diseases, including hyperglycemia and hypertriglyceridemia, is IR (50). Ahn et al. have shown that the TyG index is composed of factors related to fat and blood sugar, and it is a reliable indicator that has a good reflection of human IR (10). Studies have shown that the TyG index can be a cheap and reliable indicator for the diagnosis of IR, which is important for the early diagnosis of T2DM high-risk people (51). The TyG index, a new measure based on TG and FBG, has been shown to be a useful predictor of metabolic disorders and T2DM (52–54). Several studies have suggested that TyG index is significantly linked to the chance of acquiring T2DM in Singapore (55), Japan (56), Korea (57), and Thailand (58). Ferreira, J.R.S (59). has shown that the TyG-related factors are a useful tool to predict metabolic syndrome. So far, the majority of studies (60–62) have also demonstrated a strong relationship between the TyG-related factors and pre-diabetes/diabetes.
In fact, factors related to TyG played a far greater role in this study than other factors. In our study, TyG-related factors such as TyG-WHtR, TyG-BMI, and TyG-WC can provide a broader basis for obesity- and lipid-related indices to estimate T2DM. TyG-WHtR (AUC=0.600 in males and 0.664 in females) had greater efficacy in predicting T2DM symptoms than the TyG index alone. Many earlier several studies share similar views to our findings (63, 64). As the TyG index is a reliable and alternate indicator of IR, it may be used to assess the risk of T2DM. It is easy to get and calculate it in the clinic or large-scale epidemiological survey.
In addition, our study showed that women have a higher risk of developing T2DM than men. This may be because women lose more height than men and have more subcutaneous fat storage. One study showed that increased visceral fat levels were associated with about a threefold increased risk of T2DM in women, and a modest 20% increased risk in men (65). The central distribution of adipose tissue has a greater impact on the incidence of non-insulin-dependent T2DM in women than in men and may lead to an increased risk of T2DM (65, 66). Together, consistent with our study, older women have a higher risk of new-onset T2DM than men and are more sensitive to predicting the prevalence of T2DM in women with a higher area under the curve for most indicators.
Interestingly, in our study, women were 2.761 times more likely to develop T2DM for each unit increase in TyG-WC (95% CI=2.223-3.430), and a similar study reported a stronger correlation between visceral adiposity and serum TG in women than in men (67). This may be because women generally show higher hepatocyte lipids on an empty stomach and after a glucose and lipid load (68). Several studies (64, 69) have jointly shown that TyG-WC can be used as the main monitoring parameter for diabetes screening and clinical assessment/prediction of diabetes risk in the population, which also has certain reference value for our research.
BMI and WC are safe, easy, and cheap tools to evaluate a person’s health status and make a rough estimate of the risk of obesity, including T2DM. In a retrospective study of 41, 242 people aged 45 or older, the relationship between BMI and WC and T2DM was higher than that of WHtR or TyG index (70). Qiwei Ge et al. (71) also found that WC was the best predictor of T2DM in elderly men. However, these studies’ indicators differed from those in our analysis. In our research, BMI and WC were relatively weak in predicting T2DM. A Japanese cohort study (72) showed that BRI was superior to BMI and WC in predicting T2DM. Moreover, it is noteworthy that Jayedi et al.’s recent meta-analysis of 216 cohort studies, which was published in the BMJ, demonstrated that WHtR was more closely linked to T2DM in routine assessments than WC, waist-to-hip ratio, and BMI (73). With some reports demonstrate that WHtR had higher predictive power than WC and BMI (74, 75). The cut-off values for BMI and WC are greatly impacted by gender differences, and both BMI and WC have various limits (76). Perhaps in the future, BMI can be combined with WHtR and WC, which can improve the risk phenotype of T2DM and screen diabetic patients.
VAI is the visceral obesity index (77), which was often used in the past in Caucasians, and the correlation with the area of adipose tissue in the Chinese body is low, and the difference may be related to the different distribution of adipose tissue in the body of Caucasians and Asians, and Asians may be more prone to have visceral fat accumulation, which may be related to different lifestyles. Therefore, in order to find an index that better represents the characteristics of body fat distribution and has a higher predictive value, CVAI is a new index for the evaluation of visceral adipose. Research indicates that among Chinese individuals, CVAI positively correlates with the risk of T2DM (23, 24, 78). The Japanese study indicated a significant association between CVAI and T2DM risk, which further confirmed the efficacy of CVAI in Asia, and was superior to BMI and WC in predicting T2DM. This could be due to the fact that CVAI is a composite of age, BMI, WC, and blood lipids. Therefore, it is superior to a single index. In our study, the AUC of CVAI was smaller than that of TyG-WHtR in middle-aged and older adults in both males (AUC = 0.593, Std. Error = 0.018, 95% CI = 0.559–0.628, and optimal cutoff value = 99.429) and female (AUC = 0.663, Std. Error = 0.014, 95% CI = 0.636–0.691, and optimal cutoff value = 114.005), making CVAI the second-best indicator after TyG-WHtR in this group. A 5-year prospective study in China showed that it was superior to VAI and anthropometric indicators in assessing metabolic risk (79). Similarly, Wei In reviewer al. also found that CVAI outperformed WC, BMI, and ABSI in T2DM screening among Chinese adults (22).
Similarly, LAP is a good predictor of metabolic synthesis. LAP was found to be a strong predictor of insulin resistance (80, 81), indicating a significant relationship between LAP and T2DM. The greatest component in this study’s ROC analysis of obesity- and lipid-associated measurements for females was the AUC of LAP (AUC = 0.643, Std. Error = 0.014, 95% CI = 0.616-0.670, and optimal cut-off = 30.835), which was excepted for the TyG related factors and CVAI.
In this study, 13 obesity- and lipid-related indices were transformed into two categories based on the optimum cut-off point in Table 3. Table 4 is based on the transformed variables. In general, a higher OR indicates a greater risk factor. In Table 4, the ABSI OR was significantly lower than the other 12 indices (OR=1.637 in males and 1.415 in females), after adjustment for all confounding factors. According to ROC analysis, the AUC value of ABSI is lower than the other 12 indices (AUC=0.554 in males and 0.559 in females). Consistent with our research results, Chang et al. also found that in terms of predicting the existence of T2DM among the rural population in Northeast China, compared with BRI, ABSI has the weakest predictive ability (82).
In this study, the relationship between obesity and lipid-associated index and T2DM was discussed. These straightforward and easily measured indicators can assist middle-aged and elderly individuals in implementing early intervention measures, such as lifestyle modifications (balanced diet and appropriate physical activity), to prevent the occurrence of T2DM. Because T2DM is a chronic disease, early detection of potential risk factors and maintaining a healthy lifestyle are key to preventing it. In the field of public health, the results can be used as a reference for clinical practice, public health consultation, and for identifying high-risk groups for prevention.
Strengths and limitations of the study
Our research is based on a nationally representative longitudinal dataset. As far as we know, aging-related diseases are rapidly expanding among the elderly in China, and this is the first cohort study to evaluate the association between 13 obesity and lipid-related indicators and the prevalence of T2DM among the elderly in China. Secondly, the measurement methods of most indicators are simple to operate and can be popularized in clinical practice. In addition, this study included 7902 people aged 45 years and older, a large sample size, which provides a scientific basis and theoretical basis for the prevention and treatment of T2DM. The study does have some limitations. First of all, this study focuses on middle-aged and elderly people in China, and it is difficult to apply the conclusions of this study to elderly people in other countries when there are differences between the East and the West. Second, although we adjusted for multiple influencing factors such as education level, smoking status, drinking status, and chronic diseases, undetected residual factors may alter the relationship between obesity and T2DM or hinder its development.
Conclusions
In conclusion, our findings revealed that T2DM was connected to overall obesity- and lipid-related indicators. Additionally, the TyG-WHtR is the most accurate marker for detecting T2DM in both males and females. CVAI was a good predictor of T2DM in males and females. Our findings highlight the importance of increasing knowledge about T2DM and improving health care.
Data availability statement
The datasets presented in this study can be found in online repositories. The names of the repository/repositories and accession number(s) can be found in the article/supplementary material.
Ethics statement
All data are openly published as microdata at http://opendata.pku.edu.cn/dataverse/CHARLS with no direct contact with all participants. Approval for this study was given by the medical ethics committee of Wannan medical college (approval number 2021–3).
Author contributions
YW: Writing – original draft, Writing – review & editing. XZ: Writing – review & editing. YQL: Writing – review & editing. JG: Writing – review & editing. YM: Writing – review & editing. XY: Writing – review & editing. HL: Writing – review & editing. L-LG: Writing – review & editing. JLL: Writing – review & editing. YXL: Writing – review & editing. XL: Writing – review & editing. LS: Writing – review & editing. LY: Writing – review & editing. TY: Writing – review & editing. CW: Writing – review & editing. DZ: Writing – review & editing. JL: Writing – review & editing. ML: Writing – review & editing. YH: Writing – review & editing. LZ: Methodology, Writing – review & editing.
The reference list from the paper itself. Each links out to its DOI / PubMed record.
- 1Aiken-Morgan AT Capuano AW Arvanitakis Z Barnes LL. Changes in body mass index are related to faster cognitive decline among african american older adults. J Am Geriatrics Society (2020) 68(11):2662–7. doi: 10.1111/jgs.16814 PMC 804265632978794 · doi ↗ · pubmed ↗
- 2Diabetes is "a pandemic of unprecedented magnitude" now affecting one in 10 adults worldwide. Diabetes Res Clin practice (2021) 181:109133. doi: 10.1016/j.diabres.2021.109133 34801177 · doi ↗ · pubmed ↗
- 3Nishi SK Viguiliouk E Kendall CWC Jenkins DJA Hu FB Sievenpiper JL. Nuts in the prevention and management of type 2 diabetes. Nutrients (2023) 15(4):878. doi: 10.3390/nu 15040878 36839236 PMC 9965730 · doi ↗ · pubmed ↗
- 4Li M Jeeyavudeen MS Arunagirinathan G Pappachan J. Is type 2 diabetes mellitus a behavioural disorder? An evidence review for type 2 diabetes mellitus prevention and remission through lifestyle modification. Touch REVIEWS endocrinology (2023) 19(1):7–15. doi: 10.17925/EE.2023.19.1.7 PMC 1025862437313234 · doi ↗ · pubmed ↗
- 5Wu J Wang Y Xiao X Shang X He M Zhang L. Spatial analysis of incidence of diagnosed type 2 diabetes mellitus and its association with obesity and physical inactivity. Front endocrinology (2021) 12:755575. doi: 10.3389/fendo.2021.755575 PMC 858129834777252 · doi ↗ · pubmed ↗
- 6Jeong SM Yoo JE Park J Jung W Lee KN Han K. Smoking behavior change and risk of cardiovascular disease incidence and mortality in patients with type 2 diabetes mellitus. Cardiovasc diabetology (2023) 22(1):193. doi: 10.1186/s 12933-023-01930-4 PMC 1038721337516874 · doi ↗ · pubmed ↗
- 7Cullmann M Hilding AÖstenson CG. Alcohol consumption and risk of pre-diabetes and type 2 diabetes development in a Swedish population. Diabetic Med J Br Diabetic Assoc (2012) 29(4):441–52. doi: 10.1111/j.1464-5491.2011.03450.x 21916972 · doi ↗ · pubmed ↗
- 8Tong Y Xu S Huang L Chen C. Obesity and insulin resistance: Pathophysiology and treatment. Drug Discovery Today (2022) 27(3):822–30. doi: 10.1016/j.drudis.2021.11.001 34767960 · doi ↗ · pubmed ↗