Epicardial placement of human MSC-loaded fibrin sealant films for heart failure: Preclinical efficacy and mechanistic data
Laura Fields, Tomoya Ito, Kazuya Kobayashi, Yuki Ichihara, Mihai-Nicolae Podaru, Mohsin Hussain, Kizuku Yamashita, Vanessa Machado, Fiona Lewis-McDougall, Ken Suzuki

Abstract
Genes, proteins, chemicals, diseases, species, mutations and cell lines named across the full text — each resolved to its canonical identifier and authoritative record.
Click any figure to enlarge with its caption.
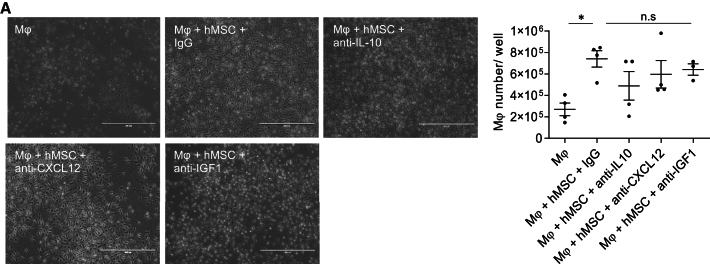 Figure 1
Peer Reviews
No public reviews on file for this paper yet. If you reviewed it on a platform where reviews are public (OpenReview, ICLR, NeurIPS, ICML), you can paste yours below so the community can read it here.
Videos
No videos yet. Explain this paper in a talk, walkthrough, or lecture? Add one.
Taxonomy
TopicsTissue Engineering and Regenerative Medicine · Electrospun Nanofibers in Biomedical Applications · Cardiac Structural Anomalies and Repair
Main text
(Molecular Therapy 29, 2554–2570; August 2021)
In the originally published version of this article, there were errors in the cell culture images of Figure S8A. The corrected version is shown below. This correction does not alter the graph, result, or conclusion of the study. The authors would like to apologize for any inconvenience caused.Figure S8. Inhibition of hAM-MSC-secreted PGE2, IL-10, CXCL12 or IGF1 did not affect Mφ proliferation (corrected)(A) Mouse bone marrow-derived Mφ were co-cultured for 48 with hAM-MSCs in the presence of neutralizing antibodies for human IL-10 (Mφ + hMSC + anti-IL-10), IGF1 (Mφ + hMSC + anti-IGF1), CXCL12 (Mφ + hMSC + anti-CXCL12) or IgG antibody controls (Mφ + hMSC + IgG). Cells were collected and the numbers were quantified. Representative phase contrast images and a chart showing the cell number counted are presented. This experiment was carried out in conjunction with the Figure 7C study. The same images and data of the control groups (Mφ group and Mφ + hMSC + IgG group) are presented in Figure 7 and Figure S8. Scale bar = 400 µm. n = 3–4 per group.