Unraveling implicit human behavioral effects on dynamic characteristics of Covid-19 daily infection rates in Taiwan
Ting-Li Chen, Elizabeth P. Chou, Min-Yi Chen, Fushing Hsieh

TL;DR
This study explores how human behaviors influenced the spread of Covid-19 in Taiwan by analyzing infection rate patterns across different districts and age groups.
Contribution
The paper introduces a data-driven approach to uncover implicit behavioral effects on disease transmission dynamics at a fine scale.
Findings
Distinct asymmetric growth and decline patterns were observed in infection rate curves across districts.
Conditional entropy and mutual information identified key factors influencing peak values and curvature of infection rates.
Behavioral effects related to living, traveling, and working were found to implicitly influence transmission dynamics.
Abstract
We investigate the dynamic characteristics of Covid-19 daily infection rates in Taiwan during its initial surge period, focusing on 79 districts within the seven largest cities. By employing computational techniques, we extract 18 features from each district-specific curve, transforming unstructured data into structured data. Our analysis reveals distinct patterns of asymmetric growth and decline among the curves. Utilizing theoretical information measurements such as conditional entropy and mutual information, we identify major factors of order-1 and order-2 that influence the peak value and curvature at the peak of the curves, crucial features characterizing the infection rates. Additionally, we examine the impact of geographic and socioeconomic factors on the curves by encoding each of the 79 districts with two binary characteristics: North-vs-South and Urban-vs-Suburban.…
Genes, proteins, chemicals, diseases, species, mutations and cell lines named across the full text — each resolved to its canonical identifier and authoritative record.
Click any figure to enlarge with its caption.
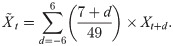 Figure 1
 Figure 2
 Figure 3
 Figure 4
 Figure 5
 Figure 6
 Figure 7
 Figure 8
 Figure 9
 Figure 10
 Figure 11
 Figure 12
 Figure 13
 Figure 14
 Figure 15
 Figure 16
 Figure 17
 Figure 18
 Figure 19
 Figure 20
 Figure 21
 Figure 22
 Figure 23
 Figure 24
 Figure 25
 Figure 26
 Figure 27
 Figure 28
 Figure 29
 Figure 30
 Figure 31
 Figure 32
 Figure 33
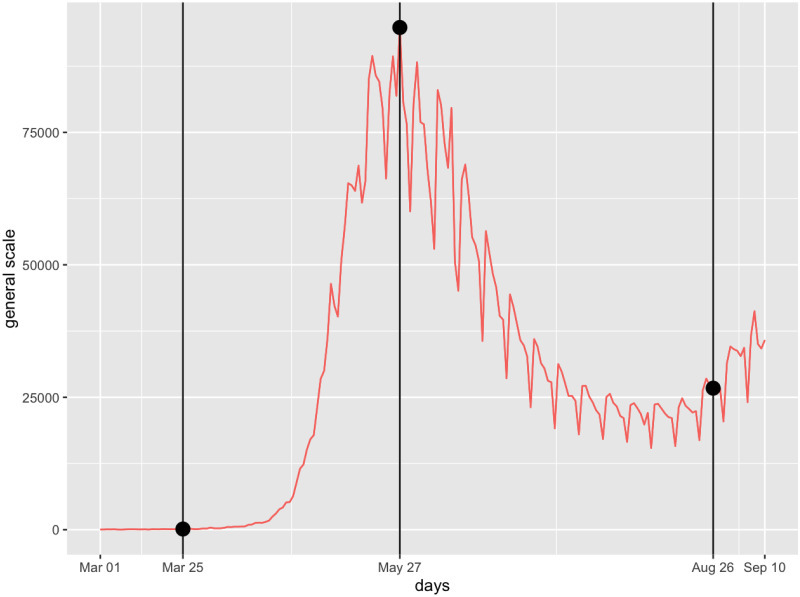 Figure 34
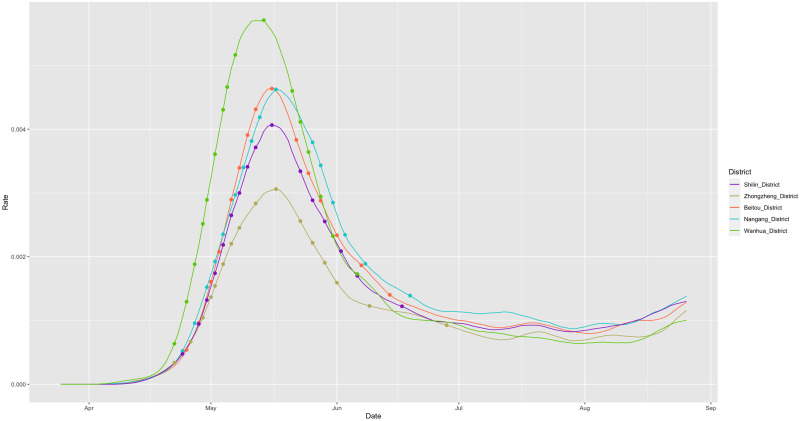 Figure 35
 Figure 36
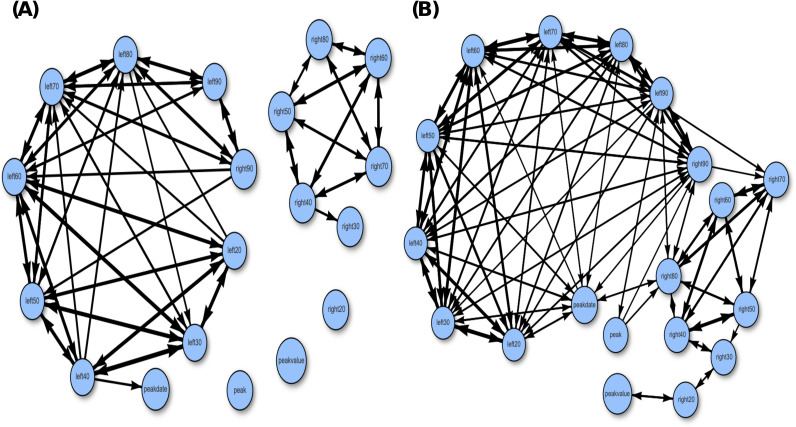 Figure 37
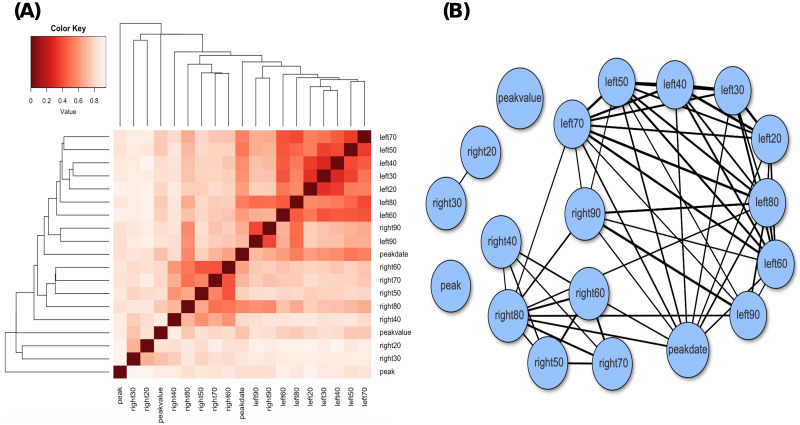 Figure 38
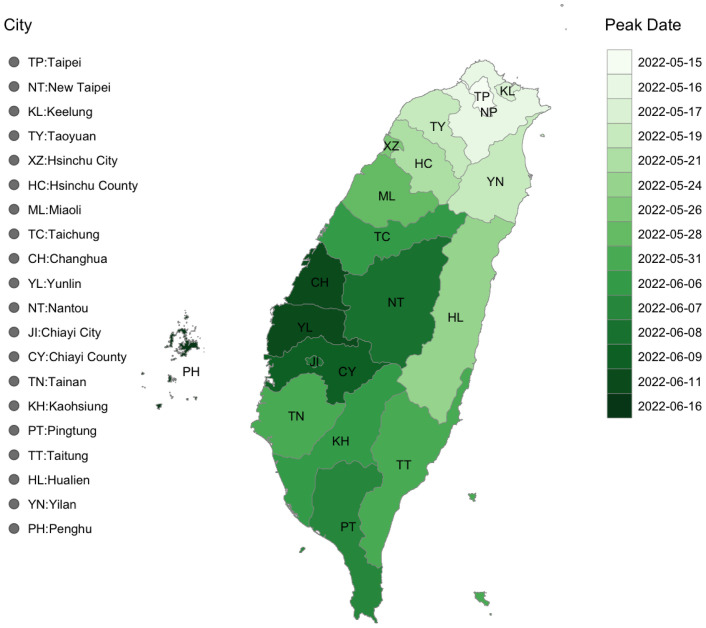 Figure 39
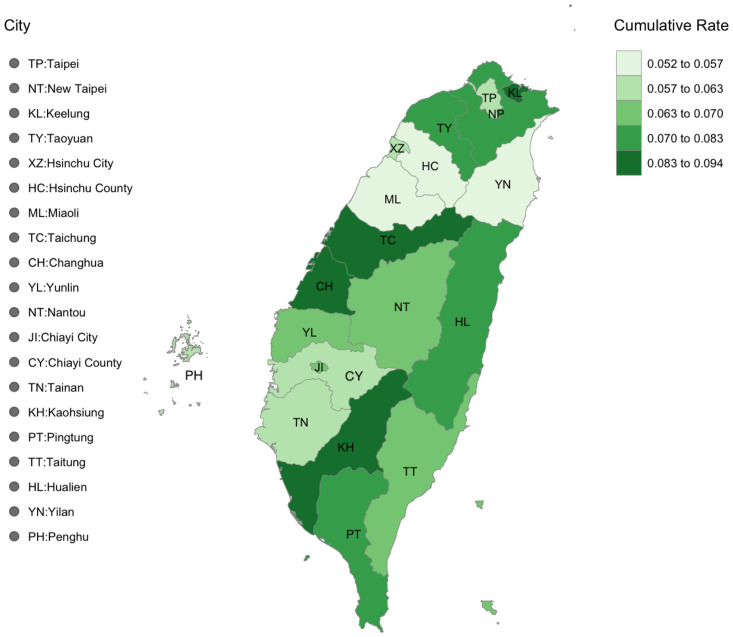 Figure 40
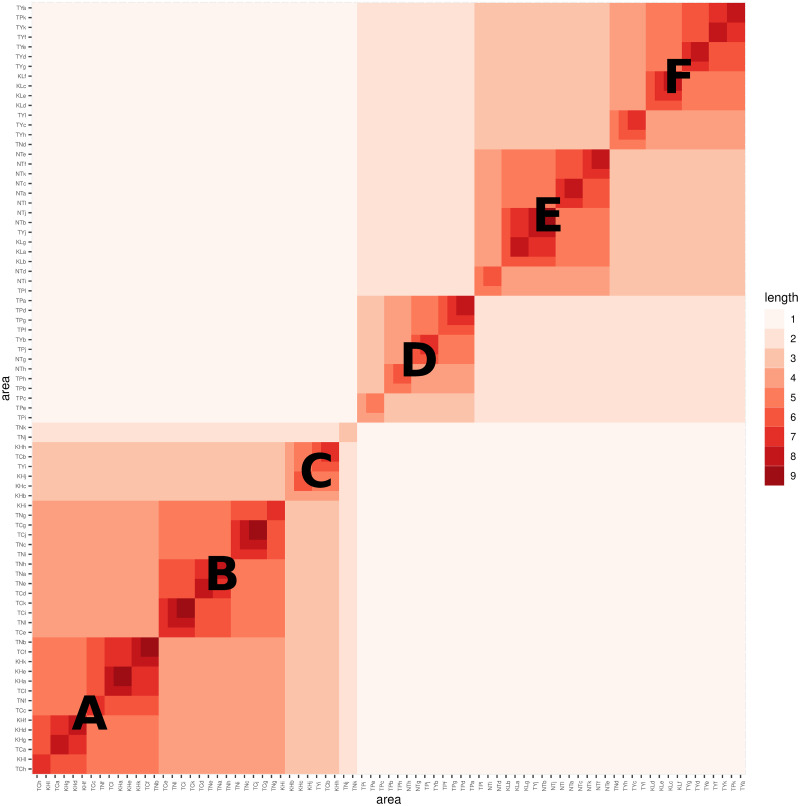 Figure 41
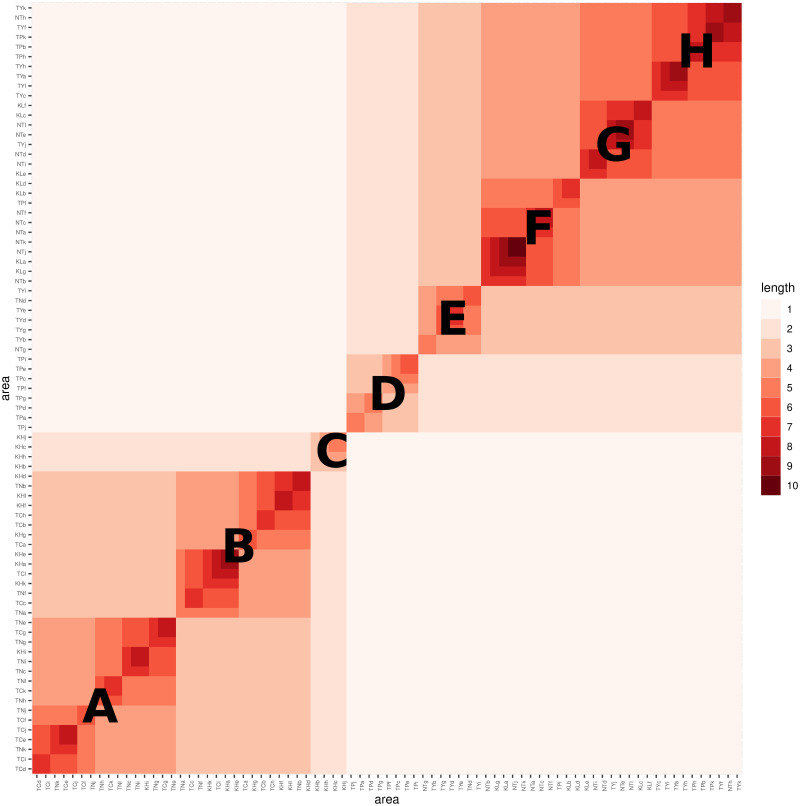 Figure 42
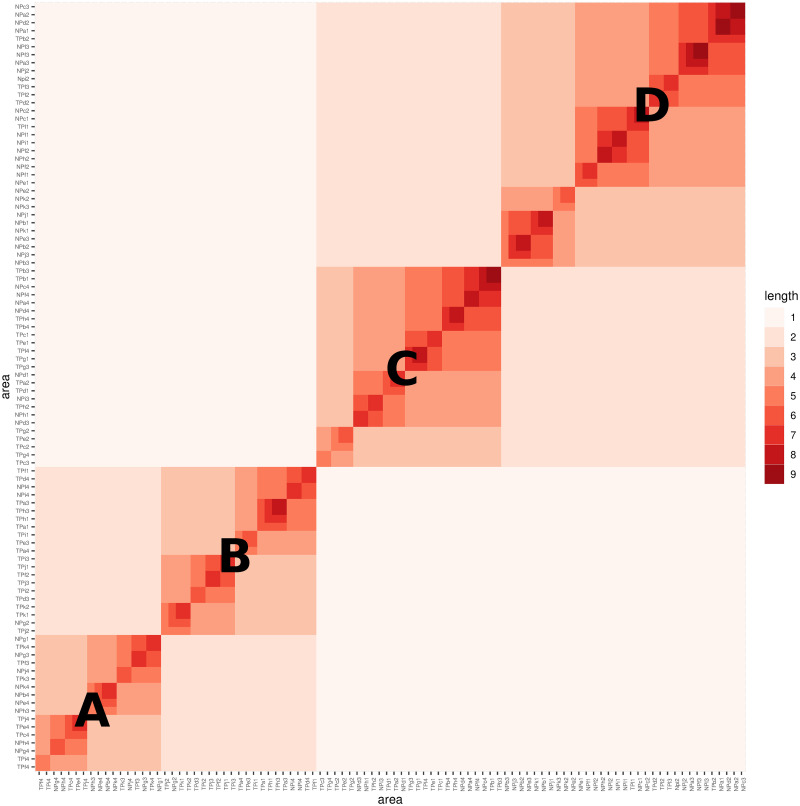 Figure 43
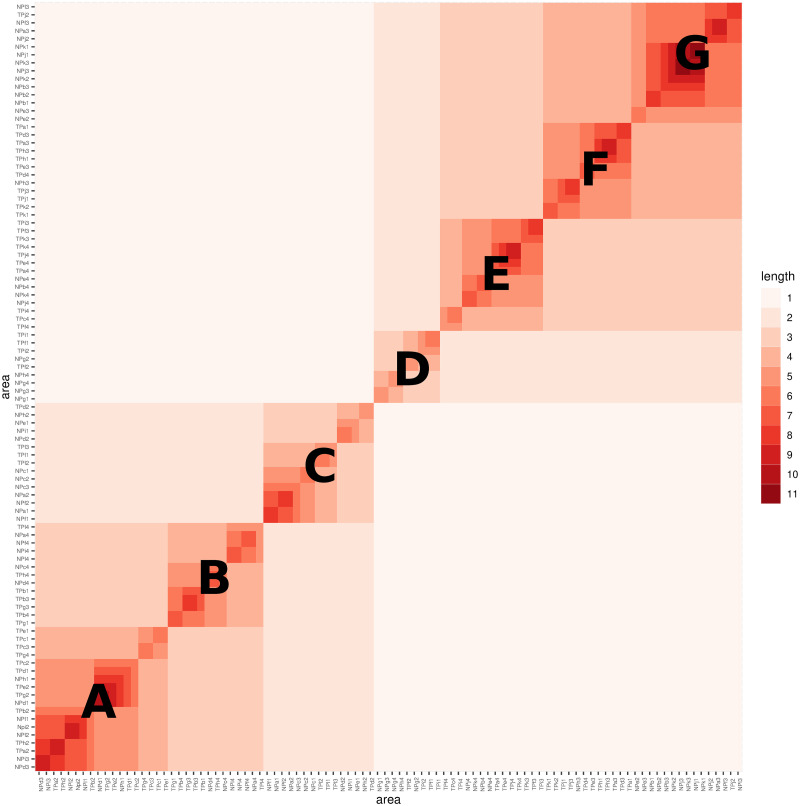 Figure 44
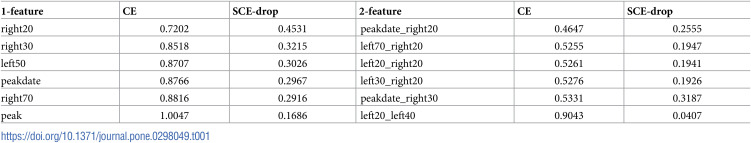 Figure 45
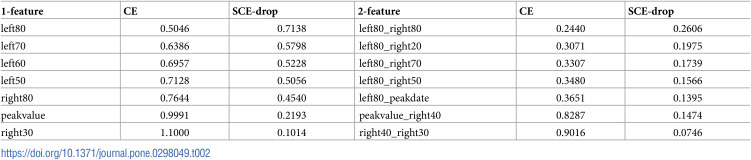 Figure 46
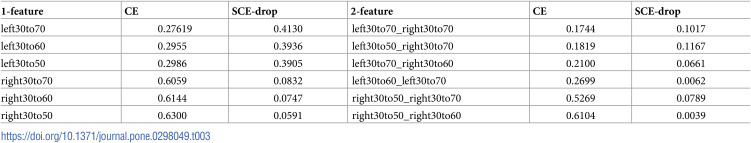 Figure 47
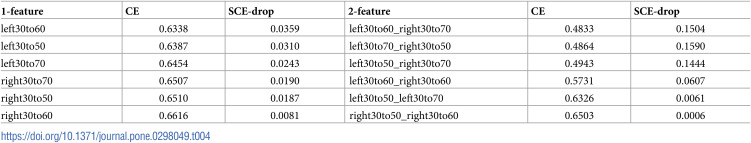 Figure 48
 Figure 49
Peer Reviews
No public reviews on file for this paper yet. If you reviewed it on a platform where reviews are public (OpenReview, ICLR, NeurIPS, ICML), you can paste yours below so the community can read it here.
Videos
No videos yet. Explain this paper in a talk, walkthrough, or lecture? Add one.
Taxonomy
TopicsCOVID-19 epidemiological studies · Data-Driven Disease Surveillance · Mental Health Research Topics