Interaction between birth characteristics and CRHR1, MC2R, NR3C1, GLCCI1 variants in the childhood lymphoblastic leukemia risk
Vitoria Müller de Carvalho, Alython Araujo Chung-Filho, Flávio Henrique Paraguassu Braga, Paulo Chagas-Neto, Sheila Coelho Soares-Lima, Maria S. Pombo-de-Oliveira

TL;DR
This study explores how birth characteristics and genetic variants in stress-related genes may influence the risk of childhood leukemia.
Contribution
The study identifies specific gene-environment interactions involving birth factors and glucocorticoid-related gene variants in childhood ALL risk.
Findings
Low birthweight, C-section, and low maternal schooling were linked to increased ALL risk.
MC2R rs1893219 A>G was associated with reduced ALL risk, while GLCCI1 rs37972 C>T increased it.
The combination of MC2R AA and GLCCI1 TT genotypes increased ALL risk significantly.
Abstract
The incidence rate of childhood acute lymphoblastic leukemia (ALL) differs worldwide, and the interplay between hemostasis actors and the maladaptive responses to environmental exposures has been explored. It has been proposed that endogenous cortisol, induced by different triggers, would eliminate pre-leukemic clones originated in utero. Herein, we tested if the interaction between CRHR1rs242941 C>A, MC2Rrs1893219 A>G, NR3C1rs41423247 G>C, and GLCCI1rs37972 C>T (players in glucocorticoid secretion) and birth characteristics would be associated with ALL risk. Children aged <10 years were enrolled within the EMiLI project (period: 2012 to 2020). The study had three steps: (1) observational analysis of birth characteristics (n = 533 cases and 1,603 controls); (2) genotyping to identify single-nucleotide variants (n = 756 cases and 431 controls); and (3) case-only to test gene–environment…
Genes, proteins, chemicals, diseases, species, mutations and cell lines named across the full text — each resolved to its canonical identifier and authoritative record.
Click any figure to enlarge with its caption.
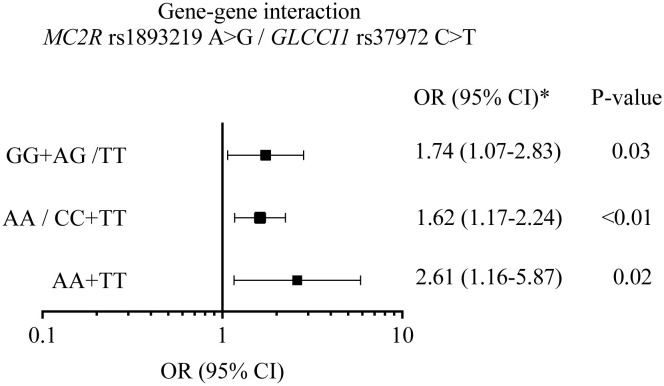 Figure 1
| Variables | Total | Cases | Controls |
|
|---|---|---|---|---|
| Leukemia Subtypes | ||||
| BCP-ALL | – | 484 (90.8) | – | |
| T-ALL | – | 49 (9.2) | – | |
| Child's age (years) | 0.001 | |||
| 0-5 | 1570 (73.5) | 431 (80.9) | 1139 (71.1) | |
| ≥ 6 | 566 (26.5) | 102 (19.1) | 464 (28.9) | |
|
| 3.7 (0.0-10) 2.8 | 3.5 (0.0-10) 2.5 | 3.0 (0.0-10) 2.9 | |
| Sex | 0.85 | |||
| Females | 950 (44.5) | 239 (44.8) | 711 (44.4) | |
| Males | 1186 (55.5) | 294 (55.2) | 892 (55.6) | |
| Child´s Ethnicity | 0.99 | |||
| Whites | 1058 (49.5) | 264 (49.5) | 794 (49.5) | |
| Multiracial | 1078 (50.5) | 269 (50.5) | 809 (50.5) | |
| Mode of delivery | 0.60 | |||
| Vaginal | 976 (45.7) | 242 (45.4) | 734 (45.8) | |
| C-Section | 1157 (54.2) | 291 (54.6) | 866 (54.0) | |
| MI | 3 (0.1) | 0 (0.0) | 3 (0.2) | |
| Birth Weight (grams) | 0.001 | |||
| ≤ 2500 | 87 (4.1) | 40 (7.5) | 47 (2.9) | |
| 2501-3500 | 1246 (58.3) | 323 (60.6) | 923 (57.6) | |
| > 3500 | 777 (36.4) | 145 (27.2) | 632 (39.4) | |
| MI | 26 (1.2) | 25 (4.7) | 1 (0.1) | |
|
| 3362(1153-6125) 492,1 | 3250(1153-5200) 523,6 | 3398(1805-6125)473,2 | |
| Maternal Schooling (years) | 0.001 | |||
| < 9 | 223 (10.4) | 139 (26.1) | 84 (5.2) | |
| ≥ 9 | 1413 (66.1) | 375 (70.4) | 1038 (64.8) | |
| MI | 500 (23.4) | 19 (3.5) | 279 (17.4) | |
|
| 10.7 (0.0-26) 3.48 | 10.9 (0.0-26) 4.29 | 10.6 (0.0-25) 3.03 | |
| Maternal age | 0.001 | |||
| < 25 | 783 (36.7) | 228 (42.8) | 555 (34.6) | |
| 25-34 | 1009 (47.2) | 228 (42.8) | 781 (48.7) | |
| ≥ 35 | 325 (15.2) | 64 (12.0) | 261 (16.3) | |
| MI | 19 (0.9) | 13 (2.4) | 6 (0.4) | |
|
| 27.1 (13.0-51.0) 6.2 | 26.3 (13.0-43.0) 6.8 | 27.0(18.0-51.0) 6.1 |
| Variables | ALL | Controls | Crude OR 95% CI |
| adj OR 95%CI |
|
|---|---|---|---|---|---|---|
| Child’s ethnicity | ||||||
| White | 250 (50.8) | 559 (50.5) | 1.00* | 1.00* | ||
| Multiracial | 242 (49.2) | 547 (49.5) | 0.91 (0.73–1.13) | 0.400 | 1.11 (0.82–1.50) | 0.514 |
| Birth weight (g) | ||||||
| ≤2,500 | 36 (7.3) | 24 (2.2) | 2.87 (1.64–4.91) | 0.001 | 2.11 (1.02–4.33) | 0.044 |
| 2,501–3,500 | 313 (63.6) | 635 (57.4) | 1.00* | 1.00* | ||
| >3,550 | 143 (29.1) | 447 (40.4) | 0.65 (0.51–0.83) | 0.001 | 0.45 (0.32–0.65) | 0.002 |
| Mode of delivery | ||||||
| Vaginal | 226 (45.9) | 547 (49.5) | 1.00* | 1.00* | 0.004 | |
| C-section | 266 (54.1) | 559 (50.5) | 1.14 (0.92–1.43) | 0.230 | 1.59 (1.16–2.17) | |
| Maternal schooling (years) | ||||||
| <9 | 129 (26.2) | 84 (7.6) | 4.22 (3.12–5.72) | 0.001 | 3.78 (2.47–5.83) | 0.001 |
| ≥9 (ref) | 363 (73.8) | 1,022 (92.4) | 1.00* | 1.00* | ||
| Variables | ALL | Controls |
| |
|---|---|---|---|---|
| Sex | ||||
| Male | 428 (56.6) | 233 (54.1) | 0.39 | |
| Female | 328 (43.4) | 198 (45.9) | ||
| Race/skin color | ||||
| Multiracial | 407 (53.8) | 240 (55.7) | 0.53 | |
| White | 349 (46.2) | 191 (44.3) | ||
| ALL subtypes | ||||
| BCP-ALL | 654 (86.5) | – | – | |
| T-ALL | 102 (13.5) | – | ||
| Variant frequencies* | ||||
|
| 0.38 | 0.40 | – | |
|
| 0.48 | 0.55 | ||
|
| 0.23 | 0.23 | ||
|
| 0.37 | 0.32 | ||
| Genotype | Cases | Controls | Crude OR | AdjOR |
|
|---|---|---|---|---|---|
|
| 683 (100) | 379 (100) | |||
| CC | 264 (38.7) | 136 (35.9) | 1.0* | ||
| CA | 315 (46.1) | 185 (48.8) | 0.88 (0.67–1.16) | 0.89 (0.68–1.18) | 0.42 |
| AA | 104 (15.2) | 58 (15.3) | 0.92 (0.63–1.35) | 0.80 (0.56–1.14) | 0.22 |
| DM | 0.89 (0.68–1.15) | 0.94 (0.64–1.37) | 0.74 | ||
| RM | 0.99 (0.70–1.41) | 1.01 (0.71–1.43) | 0.97 | ||
|
| 608 (100) | 401 (100) | |||
| AA | 180 (29.6) | 85 (21.2) | 1.0* | ||
| AG | 275 (45.2) | 192 (47.9) | 0.68 (0.49–0.93) | 0.68 (0.50–0.94) | 0.02 |
| GG | 153 (25.2) | 124 (30.9) | 0.58 (0.41–0.83) | 0.60 (0.42–0.85) | <0.001 |
| DM | 0.64 (0.48–0.86) | 0.65 (0.48–0.87) | <0.001 | ||
| RM | 0.75 (0.57–0.99) | 0.76 (0.57–1.00) | 0.05 | ||
|
| 693 (100) | 407 (100) | |||
| GG | 410 (59,2) | 244 (60.0) | 1.0* | ||
| GC | 243 (35,1) | 136 (33.4) | 1.06 (0.82–1.38) | 1.05 (0.81–1.37) | 0.71 |
| CC | 40 (5,8) | 27 (6.6) | 0.88 (0.53–1.47) | 0.88 (0.52–1.47) | 0.62 |
| DM | 1.03 (0.81–1.33) | 1.02 (0.80–1.31) | 0.86 | ||
| RM | 0.86 (0.52–1.43) | 0.85 (0.51–1.41) | 0.52 | ||
|
| 678 (100) | 410 (100) | |||
| CC | 273 (40.3) | 187 (45.6) | 1.0* | ||
| CT | 305 (45.0) | 184 (44.9) | 1.14 (0.87–1.47) | 1.13 (0.87–1.47) | 0.35 |
| TT | 100 (14.7) | 39 (9.5) | 1.76 (1.16–2.66) | 1.75 (1.16–2.65) | 0.01 |
| DM | 1.24 (0.97–1.59) | 1.24 (0.97–1.59) | 0.09 | ||
| RM | 1.65 (1.11–2.44) | 1.64 (1.11–2.43) | 0.01 | ||
| Variable |
|
| ||||||||
|---|---|---|---|---|---|---|---|---|---|---|
| AA, | AG+GG, | iOR (95% CI) | AjiOR |
| TT, | CC+CT, | iOR (95% CI) | AjiOR |
| |
| Birth weight (g) | ||||||||||
| 2,501–3,500 | 53 (66.3) | 113 (57.1) | 1.0* | 1.0* | 30 (62.5) | 172 (62.5) | 1.0* | 1.0* | ||
| ≤2,500 | 9 (11.2) | 11 (5.5) | 2.05 (0.80–5.24) | 2.15 (0.84–5.54) | 0.11 | 3 (6.3) | 22 (8.0) | 0.78 (0.22–2.78) | 0.78 (0.22–2.77) | 0.70 |
| >3,500 | 18 (22.5) | 74 (37.4) | 0.61 (0.33–1.12) | 0.59 (0.32–1.09) | 0.09 | 15 (31.2) | 81 (29.5) | 1.06 (0.54–2.08) | 1.05 (0.54–2.07) | 0.88 |
| Mode of delivery | ||||||||||
| Vaginal | 44 (49.4) | 97 (41.5) | 1.0* | 1.0* | 20 (39.2) | 132 (44.4) | 1.0* | |||
| C-Section | 45 (50.6) | 137 (58.5) | 0.72 (0.44–1.18) | 0.72 (0.44–1.18) | 0.20 | 31 (60.8) | 165 (55.6) | 1.24 (0.68–2.28) | 1.23 (0.67–2.26) | 0.50 |
| Maternal education | ||||||||||
| ≥9 years | 56 (67.5) | 177 (79.4) | 1.0* | 1.0* | 38 (76.0) | 207 (74.2) | 1.0* | 1.0* | ||
| <9 years | 27 (32.5) | 46 (20.6) | 1.86 (1.06–3.26) | 1.99 (1.11–3.55) | 0.02 | 12 (24.0) | 72 (25.8) | 0.91 (0.45–1.83) | 0.93 (0.46–1.88) | 0.83 |
Peer Reviews
No public reviews on file for this paper yet. If you reviewed it on a platform where reviews are public (OpenReview, ICLR, NeurIPS, ICML), you can paste yours below so the community can read it here.
Videos
No videos yet. Explain this paper in a talk, walkthrough, or lecture? Add one.
Taxonomy
TopicsChildhood Cancer Survivors' Quality of Life · Acute Lymphoblastic Leukemia research · Neonatal Respiratory Health Research
Introduction
1
The causal mechanism for leukemia gathers environmental factors, inherited susceptibility from polygenic variants, and chances of interactions. Models for interplay of such chances have been proposed for childhood acute lymphoblastic leukemia (ALL) mainly concerning B-cell precursor-ALL (Bcp-ALL), in which chromosomal translocations can arise in utero (1–3). Greaves and collaborators have unraveled the clonal evolution of Bcp-ALL endorsing the model of multiple gene–environment factors in the causal mechanisms of ALL pathogenesis (4–6). One of the pillars supporting the Greaves hypothesis is the epidemiological association of birth characteristics, the first year of the child’s life hygiene and socialization, as well as immune responses to early infections (3, 7). This biological evidence has opened avenues to the so-called “adrenal hypothesis” that has also emerged from observational studies of global differences on ALL incidence rate and environmental exposures in less developed societies (8). These differences led to the speculation that the hypothalamic–pituitary–adrenal (HPA) axis decreases the kinetics of disappearance of pre-leukemic clone through qualitative and quantitative plasma cortisol levels in populations with deprivation and infection exposures (8). Differences in the reactivity of the HPA axis have been proposed at genomic levels and its setting occurs during the intrauterine life, although it can also be reset by stressful experiences in early life or chronic stress as individuals go through threatening experiences (9, 10).
Physiologically, cortisol and cortisone, the so-called endogenous glucocorticoids (GCs), are released according to a cascade of interacting signals and actions from different organs of the HPA axis, initiated by corticotrophin-releasing hormone (CRH). CRH acts through the interaction with the CRHR1 receptor in the hypothalamus, leading to the release of the adrenocorticotropic hormone (ACTH). In the adrenal cortex, ACTH binds its receptor MC2R (melanocortin type 2 receptor), stimulating cortisol secretion. Cortisol will ultimately bind to its receptor NR3C1 (receptor nuclear subfamily 3, group C, member 1) in the target cell and stimulate the expression of target genes (11, 12). Glucocorticoid Induced 1 (GLICCI1) is one of these genes and, although its functions are not completely elucidated, it seems to both modulate glucocorticoid efficiency and regulate apoptosis (13). Based on their key functions in the HPA axis as well as on our interest of evaluating the different steps in this pathway, CRHR1, MC2R, NR3C1, and GLICCI1 were selected to evaluate the possible contribution of genetic variants to the variability in GC secretion levels. The specific variants were selected based on their frequencies and on previous studies suggesting their association with GC-associated outcomes (14–16).
In addition, we have recently described the association between being born through Cesarean-section (C-S), being the first child, and low birth weight (LBW) with increased risk for ALL, although the biological plausibility remains speculative and deserve further studies (17). Researchers claim that mode of delivery through C-S and children with LBW would present low epinephrine, cortisol, and cytokine levels, elements necessary to establish a healthy microbiome and a harmonic immune system (10). Herein, we hypothesized that gene variants may impact the GCs’ endogenous levels, subsequently allowing the expansion of possible leukemic clone that arose in utero, contributing to ALL development. Therefore, the aim of the study was to investigate whether ALL risk is associated with child’s birth characteristics and genetic susceptibility involving the HPA axis.
Materials and methods
2
Study design and subjects
2.1
Children with less than 10 years of age at diagnosis of Bcp-ALL and T-ALL, from a hospital-based case–control study, were included over the period of 2012 to 2020. The present study was part of the project “Epidemiology of Multi-institutional Study Group of Acute Leukemia (EMiLI)”, for which the enrollment of cases and controls was recently fully described (17). Herein, the analysis was carried out in three steps:
(1) Case–control study (n = 2136) to revisit the birth characteristic’s risk estimate adjusted by maternal schooling. The variables for the models included leukemia subtypes (484 Bcp-ALL and 49 T-ALL), race/ethnicity, child sex, mode of child delivery, and birth weight, while maternal age at childbirth and maternal schooling were the covariates. The maternal schooling was assessed as a proxy for the child’s socioeconomic level.(2) Genotyping study. Genomic DNA from cases (n = 756) and controls (n = 431) was obtained from peripheral blood cells, using the salting-out method (15). To identify CRHR1 rs242942 C>T, MC2R rs1893219, and GLCCI1 rs37972 C>T variants, polymerase chain reactions followed by high-resolution melting (HRM) were performed. The oligonucleotides were designed to each region of interest and the protocol conditions are shown in Supplementary Table 1. Approximately 10 to 15 samples genotyped for each variant were randomly selected to validate the HRM results using Sanger direct sequencing. The electropherogram analysis was performed using the Mutation Survey software (SoftGenetics, Pennsylvania, USA). NR3C1 rs41423247 G>C allelic discrimination was performed using a TaqMan assay (C:86507873_10, Thermo Fisher) and TaqMan Genotyping Master MixTM (Thermo Fisher), in Rotor-gene 6000 (QIAGEN, Germany). The variables included in this step of the study were leukemia subtypes, racial/ethnicity, child sex, allele status, and genotype frequencies.(3) Case-only. In this step, the impact of the multiplicative interaction between genotypes and environmental exposures on ALL risk was estimated (18). For this, cases with and without the risk allele were compared with respect to exposure (19). The validity of this design to estimate the interaction odds ratio (IOR) depends on the assumption that among controls, genotype and exposure are independent, i.e., the fact of having the gene variant will not influence the exposure variable.
Statistical analysis
2.2
The sample size was calculated considering controls per case (ALL subtypes; ratio: 1:3), α = 0.05, β = 0.2 for power = 0.80. To explore the impact of the birth characteristics (C-S and LBW) considering the hypothesis of the intrauterine origin of ALL and the peak incidence, we have stratified the cases into two age strata: (1) children who were up to 5 years of age and (2) children aged older than 6 up to 10 years at the diagnosis. The association between C-S and LBW and ALL risk was estimated using multiple logistic regression (MLR) adjusted for the mother’s age at childbirth [adjusted odds ratio (adjOR) and 95% confidence interval (95% CI)]. The core model with variables of interest consisted of mode of delivery (C-S vs. vaginal), child’s ethnicity (White versus multiracial, as reference), birth weight [ ≤ 2,500, 2,500 to 3,500 (reference); >3,550], gestational age (<37; ≥37 weeks), maternal ages [<25; 25–34 (reference); ≥35 years old], and maternal schooling (≤9, >9 years).
Genotyping: The genotype frequency distribution in controls was analyzed to test the Hardy–Weinberg equilibrium (HWE) by Pearson’s χ^2^ test; p > 0.05 was in accordance with HWE. Frequency differences between cases and controls were assessed through logistic regression test, the OR and 95% CI were calculated in the codominant (heterozygous versus wild type and variant homozygous versus wild type), dominant (variant homozygous + heterozygous versus wild type), and recessive (variant homozygous versus heterozygous + wild type) models. Variants associated with ALL risk were also analyzed for gene–gene interactions. In the additive model, the relative excess risk due to interaction (RERI), attributable proportion (AP), and synergy index (SI) were measured. These values and their respective delta-method 95% CI were calculated as published by Anderson et al. (20).
Case-only: We used unconditional logistic regression to calculate the IOR 95% CI controlled by the child’s ethnicity (Whites as reference). Only genetic variants associated with ALL risk in step 2 were included in the model, and the non-risk alleles were used as reference. The risk factors analyzed included the mode of delivery (vaginal as reference), birth weight (2,500–3,499 as reference), and mother education (>9 years as reference). All statistical analyses were performed using R studio version R4.1.1 and IBM SPSS Statistics version 26.
Ethical aspects: All collaborating Brazilian institutions approved the study and written informed consents were obtained from mothers or relatives responsible for the enrolled children. The Ethics and Scientific Committees of Instituto Nacional de Cancer approved this study (INCA/CAEE #626.268; CEP/CONEP 1.394.043).
Results
3
Birth characteristics
3.1
In this study, a total of 2,136 children, including 533 ALL cases and 1,603 controls, were included in the initial phase. The case:control ratio was 1:3. Among cases, 484 (90.8%) were Bcp-ALL and 49 (9.2%) were T-ALL (Table 1). Most cases were children up to 5 years of age at diagnosis (mean age: 3.5 years). Missing information (MI) was less than 4.7% for both cases and controls in the variables of interest, notably mode of delivery, birth weight, and maternal age. Cases’ mothers have reported lower schooling than controls (p = 0.001). The proportion of mode of delivery was similar between the groups, while LBW (≤2,500) was more prevalent among ALL cases (p = 0.001).
In the multiple logistic regression model (Table 2), both in the crude analysis and after adjustment by maternal age, LBW, C-section, and low maternal schooling were associated with increased risk for ALL, adjOR 2.11, 95% CI, 1.02–4.33; adjOR 1.59 95% CI, 1.16–2.17; and adjOR 3.78, 95% CI, 2.47–5.83, respectively.
Genotyping
3.2
A total of 756 cases and 431 controls were genotyped for CRHR1rs242941 C>A, MC2Rrs1893219 A>G, NR3C1rs41423247 G>C, and GLCCI1rs37972 C>T variants, using only samples of optimal DNA quality (Table 3). There was no statistically significant difference between cases and controls regarding the variables included in the models. The controls’ genotypic frequencies for all variants were in HWE. A null result was found regarding the variants CRHR1rs242941 C>A and NR3C1rs41423247 G>C in all models assessed, while MC2R rs1893219 A>G and GLCCI1 rs37972 C>T were associated with genetic predisposition to ALL development (Table 4). MC2R rs1893219 A>G showed an inverse association in models adjusted by race (DM: adjOR, 0.65, 95% CI, 0.48–0.87), demonstrating a significant protective role, while GLCCI1 rs37972 C>T was positively associated in the recessive model (RM) (adjOR, 1. 64, 95% CI, 1.11–2.43). The analysis according to race, sex, ALL subtypes, and age strata are shown in the Supplementary Material. Among white children, the MC2Rrs1893219 A>G variant was negatively associated with ALL in the dominant model (DM) (OR, 0.58, 95% CI, 0.38–0.88) while GLCCI1rs37972 C>T was positively associated in the RM (OR, 1.83, 95% CI, 1.01–3.34) (Supplementary Table 2). The same risk association pattern was found in Bcp-ALL and T-ALL subtypes (Supplementary Table 3) and among male children (Supplementary Table 4).
The combination of wild-type homozygous genotype for MC2R (AA) and variant homozygous genotype for GLCCI1 (TT), risk genotypes for the respective genes, showed a stronger association with ALL if compared to the individual effect of each variant (OR = 2.61; 95% CI = 1.16–5.87). The sum of the interaction analysis shown in Figure 1, however, revealed no synergistic or inhibitory effect between the variants (RERI, 0.26; 95% CI, −2.01–2.54).
A graphic plot summarizing the effect of the interaction of MC2R rs1893219 and GLCCI1 rs37972 variants in acute lymphoblastic leukemia risk. The association between genotypic combinations of the MC2R rs1893219 A>G and GLCCI1 rs37972 C>T variants tested with adjusted odd ratio (adjOR) 95% confidence interval (CI) by race; GG+AG/TT, genotype of protection risk; AA/CC+TT, genotype of protection risk, AA+TT, genotype of high risk. The relative excess risk in the additive model was RERI=0.26 (-2.01-2.54), AP, attributable proportion=0.10 (-0.70-0.90) and SI, synergy index=1.19(0.7-5.19) (20).
Epidemiologic–genotyping assessment
3.3
Finally, the effect of MC2R rs1893219 A>G AA and GLCCI1 rs37972 C>T was tested for interactions with birth weight, mode of delivery, and maternal education (Table 5). The model adjusted by race did not show interaction with GLCCI1 rs37972 C>T risk, although an estimate risk factor was attributed to children with mothers of less than 9 years of schooling (iOR, 1.86, 95% CI = 1.06–3.26; Adj OR, 1.99; 95% CI = 1.11–3.55).
Discussion
4
This is the first study that explores the HPA axis and childhood ALL through the effect of germline variants and a gene–environment interaction study model (8, 19). In the observational assessment, LBW, C-S, and low maternal schooling were positively associated with ALL risk. Worldwide, low education level is a proxy for socioeconomic status, and it has been associated with the functioning of the maternal HPA axis during pregnancy, impacting the health of the fetus. In populations with low human development index (HDI), LBW was associated with higher maternal cortisol levels at pregnancy, in turn leading to an LBW offspring with severe GC secretion deficiency (21, 22). However, the impact of gene variants in the HPA axis function has not been fully assessed. Within the complexity of ALL multifactorial etiopathogenesis, a role for genetic susceptibility involving genes responsible for GCs’ secretion cannot be dismissed (8, 23, 24).
This study focused on CRHR1, MC2R, NR3C1, and GLICCI1, four genes within the HPA axis, and the association of their variants with C-S, birthweight, and ALL. CRHR1 and NR3C1 variants did not show any association with birth weight and ALL. This result is in line with Schneider et al. (2020), who have found no association between genetic variants in the GC receptor gene and LBW (25). However, NR3C1 seems to be crucial to the induction of apoptosis mediated by GCs in lymphoblasts and its regulation is essential in ALL treatment. Therefore, the null results found here regarding the risk association with ALL do not exclude its relevance in investigations related to resistance to GC therapy.
MC2R, another key receptor in the HPA axis, is much less studied. The variant MC2R rs1893219 A>G, mapped to MC2R promoter region, is the most frequent variant (44%) worldwide and has been previously associated with decreased risk of cerebral hemorrhage and with clinical outcomes in ALL (15). In addition, the MC2R rs1893219 A>G variant was associated with better response to glucocorticoid treatment in infantile spasms (23). Herein, the MC2R rs1893219 A>G variant was found inversely associated with the risk of childhood ALL in both subtypes (Bcp-ALL and T-ALL), and a gene–environment interplay was observed in children whose mothers had low schooling. Low education is an important risk factor for the mother and the newborn, being associated with infant mortality, less prenatal care, preterm delivery, LBW, and lower breastfeeding (26–28). Since several of these characteristics are associated with maternal stress, they could lead to increased GC levels in the intrauterine environment (29, 30) . Therefore, these potential variations in GC production by the mother together with the potential modulation of MC2R expression levels by its genetic variant could affect the development and the response of the HPA axis in the fetus and modulated ALL risk.
Interestingly, the genetic variant of GLCCI1, another gene less explored in the literature, was positively associated with ALL risk. A literature review discloses only 52 articles exploring this gene, and the great majority evaluated the role of GLICC1 in the treatment response of inflammatory and immunological diseases (31). No studies in leukemias were found, even though GCs are crucial for ALL treatment and relapse prediction (32). The effects of GCs on lymphocytes are translated by the reduction of peripheral circulating lymphocytes through interaction with the GC receptor (GR). Initially, GlCCI1 was described to bind to specific GRs in the cytoplasm forming complexes and being transferred to the nucleus, thus regulating the transcriptional activity of GC response genes (33). However, recently, Kiuchi and colleagues showed that GLCCI1 is an early marker of apoptosis in murine thymocytes (34), corroborating the study of Tantisira and collaborators (14). In this context, since GLCCI1 rs37972 C>T leads to lower gene expression, a reduction of apoptosis of inflammatory cells is expected to take place. Thus, based on the biological mechanisms summarized above, we hypothesize that the effect of GLCCI1 rs37972 C>T in B and T cells in concert with environmental factors could facilitate the expansion of clonal cells of intrauterine origin. This is in accordance with the biological network proposed by Greaves and the adrenal hypothesis proposed by Schmiegelow regarding less fortunate societies and ALL incidence rates (3, 8).
Although the results found here are novel and shed light on the etiopathogenesis of ALL of intrauterine origin, limitations include the lack of knowledge of the functional effects of all genetic variants analyzed as well as the lack of evaluation of known environmental risk factor for ALL development, such as exposure to ionizing radiation and pesticides. Moreover, we encourage further research to explore additional common variants in the HPA axis pathway along with other modulators of the immune response, such as the history of early-life infections.
Conclusion
5
Our study has demonstrated a significant association between MC2Rrs1893219 A>G (protective) and GLCCI1 rs37972 C>T variants (increased risk) and childhood ALL susceptibility. Based on these lines of evidence, genes controlling the HPA axis activity may play a role in leukemogenesis and further investigation is needed to substantiate our findings.
Data availability statement
The original contributions presented in the study are included in the article/Supplementary Material. Further inquiries can be directed to the corresponding author.
Ethics statement
The studies involving humans were approved by National Cancer Institute Ethics Committee: CEP/CONEP:1.394.043. The studies were conducted in accordance with the local legislation and institutional requirements. Written informed consent for participation in this study was provided by the participants’ legal guardians/next of kin.
Author contributions
VMC: conceptualization, methodology, formal analysis, writing the original draft, reviews, and editing. AACF: methodology, statistical analysis and writing the original draft, reviews. PCN: data curation, statistical analysis. FHPB: collaboration, data curation, reviews the manuscript. SCSL: conceptualization, methodology, formal analysis, writing and reviews. MSPO: conceptualization, data curation, writing and editing, funding acquisition. All authors contributed to the article and approved the submitted version.
The reference list from the paper itself. Each links out to its DOI / PubMed record.
- 1Enciso-Mora V Hosking FJ Sheridan E Kinsey SE Lightfoot T Roman E. Common genetic variation contributes significantly to the risk of childhood B-cell precursor acute lymphoblastic leukemia. Leukemia (2012) 26:2212–5. doi: 10.1038/leu.2012.89 22456626 · doi ↗ · pubmed ↗
- 2Evans T-J Milne E Anderson Dde Klerk NH Jamieson SE Talseth-Palmer BA. Confirmation of childhood acute lymphoblastic leukemia variants, ARID 5B and IKZF 1, and interaction with parental environmental exposures. Plo S One (2014) 9:e 110255. doi: 10.1371/journal.pone.0110255 25310577 PMC 4195717 · doi ↗ · pubmed ↗
- 3Greaves M. A causal mechanism for childhood acute lymphoblastic leukaemia. Nat Rev Cancer (2018) 18:471–84. doi: 10.1038/s 41568-018-0015-6 PMC 698689429784935 · doi ↗ · pubmed ↗
- 4Swaminathan S Klemm L Park E Papaemmanuil E Ford A Kweon S-M. Mechanisms of clonal evolution in childhood acute lymphoblastic leukemia. Nat Immunol (2015) 16:766–74. doi: 10.1038/ni.3160 PMC 447563825985233 · doi ↗ · pubmed ↗
- 5Schäfer D Olsen MLähnemann D Stanulla M Slany R Schmiegelow K. Five percent of healthy newborns have an ETV 6-RUNX 1 fusion as revealed by DNA-based GIPFEL screening. Blood (2018) 131:821–6. doi: 10.1182/blood-2017-09-808402 PMC 590988529311095 · doi ↗ · pubmed ↗
- 6Ford AM Colman S Greaves M. Covert pre-leukaemic clones in healthy co-twins of patients with childhood acute lymphoblastic leukaemia. Leukemia (2023) 37:47–52. doi: 10.1038/s 41375-022-01756-1 36536099 PMC 9883163 · doi ↗ · pubmed ↗
- 7Marcotte EL Ritz B Cockburn M Yu F Heck JE. Exposure to infections and risk of leukemia in young children. Cancer Epidemiol Biomarkers Prev (2014) 23:1195–203. doi: 10.1158/1055-9965.EPI-13-1330 PMC 410047124793957 · doi ↗ · pubmed ↗
- 8Schmiegelow K Vestergaard T Nielsen SM Hjalgrim H. Etiology of common childhood acute lymphoblastic leukemia: the adrenal hypothesis. Leukemia (2008) 22:2137–41. doi: 10.1038/leu.2008.212 18719616 · doi ↗ · pubmed ↗