A Comparative Study of Deaths Due to the COVID-19 Pandemic During the First and Second Waves in a Tertiary Care Center of a Rural Area in South India
Rahul Navab, Anil R, Uma M A, Dhananjaya P E, Sangeetha Kamatchi, Visweswara Reddy Yeragudi jangamareddy

TL;DR
This study compares deaths from the first and second waves of the COVID-19 pandemic in a rural South Indian hospital, highlighting demographic and geographic factors.
Contribution
The study provides insights into how demographic and geographic factors influenced mortality during different pandemic waves in a rural Indian setting.
Findings
Mortality was higher during the second wave compared to the first wave.
Age group 50-75 years and male gender were significant factors in both waves.
Comorbid conditions like diabetes were more prevalent in the second wave.
Abstract
Background The coronavirus disease 2019 (COVID-19) pandemic affected life and livelihood worldwide, including India, with over five million deaths recorded over two years. In the present study, our objective was to analyze the COVID-19 deaths during the first and second waves in relation to demographic factors and comorbid conditions. Methods This was a hospital-based, retrospective comparative study of COVID-19 deaths that occurred in our hospital during the first and second waves of the COVID-19 pandemic. A total of 210 (6.69%) deaths recorded during both waves of the pandemic were analyzed. Microsoft Excel sheets (Microsoft Corporation, Redmond, WA, USA) were used to collect data from the medical records section, and the data were compiled. Descriptive statistics were used and analyzed using SPSS version 21 (IBM Corp., Armonk, NY, USA). Results Out of 3136 inpatients, mortality…
Genes, proteins, chemicals, diseases, species, mutations and cell lines named across the full text — each resolved to its canonical identifier and authoritative record.
Click any figure to enlarge with its caption.
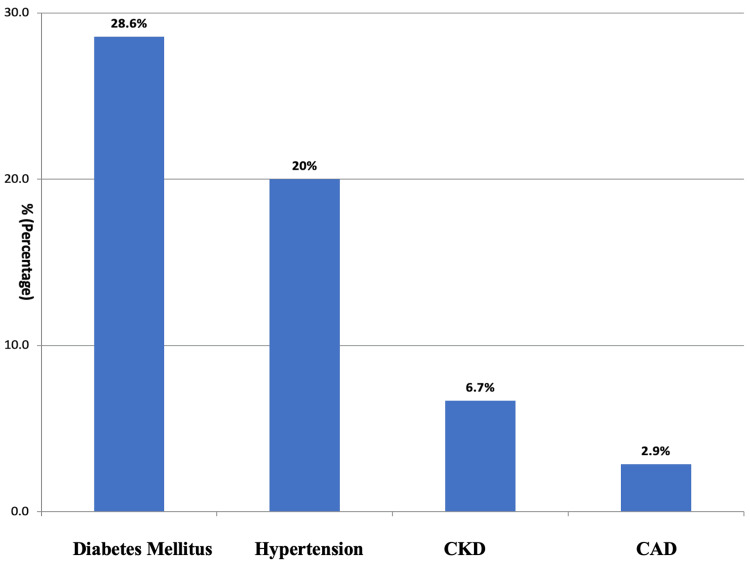 Figure 1
| Gender | N | % | |
| Female | 57 | 27.1 | |
| Male | 153 | 72.8 | |
| Age group (in years) | |||
| <25 | 8 | 3.8 | |
| 26-50 | 75 | 35.7 | |
| 51-75 | 107 | 50.9 | |
| >76 | 20 | 9.5 | |
| Region | |||
| Rural | 134 | 63.8 | |
| Urban | 76 | 36.1 | |
| Comorbidities | |||
| Present | Hypertension | 42 | 34.4 |
| Diabetes mellitus | 62 | 50.8 | |
| Chronic kidney disease | 14 | 11.5 | |
| Coronary artery disease | 4 | 3.3 | |
| Absent | 88 | 41.9 | |
| Duration of hospital stay | |||
| <7 days | 147 | 70 | |
| 7-14 days | 53 | 25.2 | |
| >14 days | 10 | 4.7 | |
| Death occurrence | |||
| <24 hours | 25 | 11.9 | |
| 24-48 hours | 37 | 17.6 | |
| >48 hours | 148 | 70.4 | |
| Total | 210 | 100 | |
| Associated Factors | 1st Wave Number (Percentage) | 2nd Wave Number (Percentage) | Total Number (Percentage) | Chi-Square Score (P-value) |
| Gender | ||||
| Male | 22 (64.7%) | 131 (74.4%) | 153 (72.8%) | 1.3630 (0.243) |
| Female | 12 (35.2%) | 45 (25.5%) | 57 (27.1%) | |
| Age group in years | ||||
| <25 | 1 (2.9%) | 7 (3.9%) | 8 (3.8%) | 11.6256 (0.009)* |
| 26-50 | 4 (11.7%) | 71 (40.3%) | 75 (35.7%) | |
| 51-75 | 23 (67.6%) | 84 (47.7%) | 107 (50.9%) | |
| >76 | 6 (17.6%) | 14 (7.9%) | 20 (9.5%) | |
| Locality | ||||
| Rural | 16 (47%) | 118 (67%) | 134 (63.8%) | 4.9291 (0.026)* |
| Urban | 18 (52.9%) | 58 (32.9%) | 76 (36.1%) | |
| Duration of stay | ||||
| <7 days | 24 (70.5%) | 123 (69.8%) | 147 (70%) | 0.1559 (0.925) |
| 7-14 days | 8 (23.5%) | 45 (25.5%) | 53 (25.2%) | |
| >14 days | 2 (5.8%) | 8 (4.5%) | 10 (4.7%) | |
| Time lapse from admission to death | ||||
| <24 hours | 3 (8.8%) | 22 (12.5%) | 25 (11.9%) | 0.5266 (0.768) |
| 24-48 hours | 7 (20.5%) | 30 (17%) | 37 (17.6%) | |
| >48 hours | 24 (70%) | 124 (70%) | 148 (70.4%) | |
| Comorbidities | ||||
| Present | 18 (52.9%) | 104 (59%) | 122 (58.1%) | 0.4427 (0.506) |
| Absent | 16 (47%) | 72 (40.9%) | 88 (41.9%) | |
| Diabetes mellitus | ||||
| Absent | 28 (82.3%) | 122 (69.3%) | 150 (71.4%) | 2.372 (0.305) |
| Present | 6 (17.6%) | 54 (30.6%) | 60 (28.6%) | |
| Hypertension | ||||
| Absent | 26 (76.4%) | 142 (80.6%) | 168 (80%) | 0.3158 (0.574) |
| Present | 8 (23.5%) | 34 (19.3%) | 42 (20%) | |
| CKD | ||||
| Absent | 32 (94.1%) | 164 (93.1%) | 196 (93.3%) | 0.0401 (0.841) |
| Present | 2 (5.8%) | 12 (6.8%) | 14 (6.7%) | |
| CAD | ||||
| Absent | 32 (94%) | 172 (97.7%) | 204 (97.1%) | 3.118 (0.210) |
| Present | 2 (5.8%) | 4 (2.2%) | 6 (2.9%) | |
| Total | 34 | 176 | 210 | |
Peer Reviews
No public reviews on file for this paper yet. If you reviewed it on a platform where reviews are public (OpenReview, ICLR, NeurIPS, ICML), you can paste yours below so the community can read it here.
Videos
No videos yet. Explain this paper in a talk, walkthrough, or lecture? Add one.
Taxonomy
TopicsCOVID-19 epidemiological studies · COVID-19 Clinical Research Studies · COVID-19 and healthcare impacts
Introduction
A global pandemic caused by the coronavirus wasn’t known to the world until December 2019, when a cluster of pneumonia-like symptoms was reported from Wuhan, China [1]. India reported its first confirmed case of severe acute respiratory syndrome coronavirus-2 (SARS-CoV-2) on January 30, 2020 [2]. By January 2022, there were 4.13 crore cases and 4,95,050 deaths reported in India [3]. There were about 14,460 causalities reported in the state of Andhra Pradesh, India, by December 2021 [4]. A study regarding the coronavirus disease 2019 (COVID-19) pandemic during March-October 2020 in India, which included nine states (Delhi, Gujarat, West Bengal, Uttar Pradesh, Andhra Pradesh, Maharashtra, Karnataka, Tamil Nadu, and Telangana) recorded 80% of all infected cases and 61% of all deaths [5]. There was little variation in the rate of fatalities between the first and second waves of the pandemic, according to the Indian Council of Medical Research Director General [6]. Factors such as economic condition, diabetes, hypertension, overweight, obesity, and literacy were significantly associated with COVID-19 mortality [7].
Therefore, this study was undertaken to analyze deaths due to the COVID-19 pandemic during the first and second waves; it focused on demographic factors and comorbid conditions, which may guide and prepare us for the future.
Materials and methods
This was a single-center retrospective study and data were collected from February 2020 to January 2022.
The study was carried out at a government-recognized center for the management of COVID-19 patients in the southern area of Chittoor district; treatment was provided free of cost to all health cardholders between February 2020 and January 2022. A total of 3136 cases of COVID-19 were treated (first wave = 1506 and second wave = 1630), 2926 (93.3%) patients recovered, and 210 deaths (6.69%) were recorded.
All 210 (6.69%) deaths due to COVID-19 across all age groups were included in the study, with 34 (2.25%) occurring during the first wave of the pandemic (February to December 2020) and 176 (10.7%) during the second wave (March to January 2022). Data were obtained from the medical records department section of our institution after getting the necessary permissions from the college and hospital authorities. A Microsoft Excel sheet (Microsoft Corporation, Redmond, WA, USA) was prepared to collect data, including factors like gender, age, region, co-morbidities like diabetes mellitus, hypertension, chronic kidney disease, coronary artery disease, duration of hospital stay, and outcome.
The data were compiled and analyzed using SPSS version 21. Descriptive statistics were used for categorical data in the form of percentages. Inferential statistics, such as the chi-square test, were used for analyzing statistical associations. A P-value of <0.05 was considered statistically significant.
Ethical clearance was provided by the institutional ethical committee of PES Institute of Medical Sciences and Research (approval number: PESIMSR/IHEC/129-21).
Results
The total number of patients admitted and treated was 3136, among which 210 (6.69%) deaths were recorded. Out of 210 deaths in the study, 34 (2.25%) were during the first wave of the COVID-19 pandemic, from February to December 2020, and 176 (10.7%) died during the second wave of the pandemic, from March to January 2022. Among the 210 deaths, 72.8% (n=153) were males and 27.1% (n=57) were females. The majority (50.9%; n=107) of the deaths were seen in the age group of 51-75 years. The median age at death in both waves was 54 years. Deaths were seen more among the subjects from rural areas (63.8%; n=134) than compared to urban areas (36.1%; n=76). Among the total deaths, patients had more comorbid conditions during the second wave (59%; n=104) compared to the first wave(52.9%; n=18). The duration of hospital stay in 70% (n=147) of deaths was less than seven days. Among the 210 (6.69%) deaths in the hospital, 29.5% (n=62) died within 48 hours (Table 1). The different co-morbid conditions present among the deceased are shown in Figure 1.
The different co-morbid conditions present among the deceased% = percentage, CKD = chronic kidney disease, CAD = coronary artery disease
In both waves, deaths were more among the males (64.7% and 74.4%; n=22 & n=131) and there was no statistically significant association between gender and the COVID-19 waves. In the first wave, the majority (85.2%; n=29) of the deaths were noticed in the age group of more than 50 years, whereas in the second wave, only 55.6% (n=98) deaths were in the age group of more than 50 years. The median age at death in the first and second waves was 65 years and 52 years, respectively. A statistically significant association was noted between the age group and the waves of COVID-19 (P=0.009). Almost equal proportions of deaths were seen among the rural (47%) (n=16) & urban area (52.9%) (n=18) subjects during the first wave. During the second wave, deaths were higher (67%) (n=118) in the people who belonged to rural areas, and that was statistically significant (P=0.026). In both waves, the majority (70.5% & 69.8%; n=24 & n=123) of the deaths occurred within seven days.
More than 50% of the deaths that occurred during both waves have an associated comorbid condition, which was 52.9% (n=18) in the first wave and 59% (n=104) in the second wave. Co-morbid conditions like diabetes (28.6%; n=60) and hypertension (20%; n=42) were higher among the people who died during the COVID first and second waves, as shown in (Table 2).
Table 2: A comparison of deaths during the first and second waves of COVID-19n: number, %: percentage, CKD: chronic kidney disease, CAD: coronary artery disease, * P-value of <0.05 is considered statistically significant
Discussion
The number of death cases recorded in our hospital was 34 (2.25%) during the first wave, i.e., February 2020 to December 2020, and 176 (10.7%) during the second wave, i.e., March 2021 to January 2022. During the first wave, many hospitals and healthcare professionals were on a learning curve, as it was a new disease and experience. Although, during the second wave, more hospital admissions were possible, more deaths occurred, possibly due to the different strain, higher burden of admission, and unavailability of oxygen.
The present study was carried out to compare the COVID-19 deaths during the first and second waves in relation to demographic factors and comorbid conditions among various age groups. In both waves, deaths among the males were greater when compared to females (Males: Females = 72.8% (n=153): 27.1% (n=57)). As per the national registry, males were more (65.4% & 63.7%) affected in both waves as seen in this study [8]. In the current study, subjects belonging to the age group of 50-75 years were affected majorly in both waves (67.6% (n=23) & 47.7%(n=84) ). The median age of death due to COVID-19 was 64 years and 52 years during the first and second waves, respectively. The median age group affected was 47-59 years in one of the studies conducted during the first wave of the COVID-19 pandemic [9]. The Indian Council of Medical Research Director General noted that 70% of infected patients were more than 40 years old in both waves [6]. In one of the studies conducted in our neighboring state - Tamil Nadu, the median age of death was found to be 64 years, which is similar to our study [10]. Among the subjects who died during the first wave, 17.6% (n=6) were aged more than 75 years, which is identical to a study conducted in two Indian states (Tamil Nadu and Andhra Pradesh) [11]. There was a statistically significant association seen between the age group and the waves of COVID-19 (P=0.009). In the first wave of the pandemic, subjects from urban backgrounds were affected more (52.9%; n=18) because of high population density [12], whereas, in the second wave, more subjects (67%; n=118) from the rural area succumbed to the deadly virus. Because of the older population, higher comorbidities, and lack of access to healthcare, rural areas were particularly vulnerable [12].
The time interval from admission to the hospital to death was less than seven days in both waves (70.5% (n=24) vs 69.8% (n=123)). A study conducted in the states of Tamil Nadu and Andhra Pradesh revealed that half of the cases of deaths occurred within six days of the testing [11]. In this study, 29.5% (n=62) of the total deaths happened within 48 hours after admission, which is lower by comparison to a study that reported 49.8% of the deaths happened between 48 and 72 hours [10]. This could be attributed to better care given in our institution, as per central and state government guidelines and protocols.
Deaths (52.9% (n=18 and 59% (n=104)) reported during the first and second waves of the pandemic, respectively, had comorbidities. During the first wave of the pandemic, diabetes mellitus (17.6%; n=6) and hypertension (23.5%; n=8) were the most prevalent comorbid conditions, followed by chronic kidney disease (5.8%; n=2) and coronary artery disease (5.8%; n=2). A study conducted by Cunningham JW et al., during the first wave of the pandemic, revealed that there was a higher risk of adverse events associated with comorbid conditions like obesity, hypertension, and diabetes [13]. A study conducted in Tamil Nadu showed that diabetes (66%), followed by hypertension (54%), coronary artery disease (18%), and chronic kidney disease (15%) were the common comorbid conditions reported [10]. A study, on causes of COVID-19 deaths and comorbidities in hospitalized patients, revealed arterial hypertension (65.4%) was the most prevalent comorbid condition during the first wave of the pandemic [14]. In the second wave of the pandemic, diabetes mellitus (30.6%; n=54) was the most prevalent comorbidity, followed by hypertension (19.3%; n=34), chronic kidney disease (6.8%; n=12), and coronary artery disease (2.2%) (n=4) among the 176 deaths. There is not much literature available to compare the comorbidities in the death cases during the second wave of the COVID-19 pandemic. However, among the death cases, multiple comorbidities were noted. Both diabetes mellitus and hypertension were found in 14.7% (n=5) and 13.6% (n=24) during the first and second waves, respectively, and both hypertension and chronic kidney disease were found in 2.9% (n=1) and 3.4% (n=6) during the first and second waves, respectively.
This study was a retrospective and hospital-based single-center study. The center where this study was conducted is situated in a rural area. Considering these limitations, a large sample size covering a huge geographical region will give more valuable insights to this study. This study hasn’t compared the comorbid conditions in patients who did not die.
Conclusions
During the first and second waves of the COVID-19 pandemic, death rates marked a fivefold increase. Both waves highlighted the impact on different adult age groups, with significant regional variations. The prevalence of deaths was high among males, individuals aged 51-75, and urban subjects during the first wave, while the second wave saw a higher toll among males, the same age group, and rural subjects. A majority of deaths occurred more than 48 hours after admission and treatment, highlighting the critical need for timely interventions.
The reference list from the paper itself. Each links out to its DOI / PubMed record.
- 1COVID 19 pandemic testing time - crisis or opportunity in disguise for India?Semin Oncol Shetty O Gurav M Bapat P Karnik N Pai T Wagh G Desai S 1521554820213346833210.1053/j.seminoncol.2020.12.001PMC 7832012 · doi ↗ · pubmed ↗
- 2COVID-19 pandemic in India: through the lens of modeling Glob Health Sci Pract Babu GR Ray D Bhaduri R Halder A Kundu R Menon GI Mukherjee B 220228920213423402010.9745/GHSP-D-21-00233 PMC 8324184 · doi ↗ · pubmed ↗
- 3The Hindu. Coronavirus updates 3 2022 2022 https://www.thehindu.com/news/national/coronavirus-live-updates-january-31-2022/article 38352129.ece
- 4With 0.7% mortality rate, Andhra Pradesh at 31st place in Covid deaths 3 2022 2021 https://timesofindia.indiatimes.com/city/vijayawada/with-0-7-mortality-rate-ap-at-31st-place-in-covid-deaths/articleshow/88285222.cms
- 5District level correlates of COVID-19 pandemic in India during March-October 2020 P Lo S One Tamrakar V Srivastava A Saikia N 016202110.1371/journal.pone.0257533 PMC 848330934591892 · doi ↗ · pubmed ↗
- 6India’s second wave of COVID-19 ‘less severe’, no change in death rate: ICMR DG 3 2022 2021 https://www.hindustantimes.com/india-news/indias-second-wave-of-covid-19-less-severe-no-change-in-death-rate-icmr-dg-101618821805826.html
- 7Factors associated with mortality from COVID 19. Indian perspective Lung India Roy MP 5015023820213447253710.4103/lungindia.lungindia_403_21PMC 8509161 · doi ↗ · pubmed ↗
- 8Clinical profile of hospitalized COVID-19 patients in first & second wave of the pandemic. Insights from an Indian registry based observational study Indian J Med Res Kumar G Mukherjee A Sharma RK 61962815320213425919410.4103/ijmr.ijmr_1628_21PMC 8555588 · doi ↗ · pubmed ↗