Killing capacity analysis of tumor-infiltrating cytotoxic lymphocytes and impact on lymph node metastasis in differentiated papillary carcinoma of thyroid with the BRAF V600E mutation
Xiaogang Liu, Honggang Liu, Lu Wang, Yubing Han, Linghong Kong, Xinpeng Zhang

TL;DR
This study examines how tumor-infiltrating cytotoxic lymphocytes affect lymph node metastasis in thyroid cancer with a specific mutation.
Contribution
The study identifies differences in cytotoxic lymphocyte activity between tumor and healthy thyroid tissues in BRAF V600E-mutated papillary carcinoma.
Findings
CD3+P+ CTLs were more active in paracancerous tissues compared to tumor tissues.
CD8+G+ CTLs showed higher activity in tumor tissues, linked to lymph node metastasis.
CD16-CD56+G+ NK cells in tumor tissues correlated with high metastasis risk.
Abstract
Cytotoxic lymphocytes (CLs) express potent toxins, including perforin (P) and granzyme-B (G), which brings about target cell death. The purpose of this study was to evaluate the killing capacity of tumor-infiltrating CLs by means of P and G analysis, and explore the association with lymph node metastasis in papillary carcinoma of thyroid (PTC) without Hashimoto’s thyroiditis (HT). Infiltration of lymphocytes in PTC was observed in frozen sections. Both fresh tumor tissues and paracancerous tissues with lymphocyte infiltration were collected and prepared into a single cell suspension. Flow cytometry was used to detect the percentages of CD3+P+, CD3+G+, CD8+P+, and CD8+G+ T lymphocytes (TLs) and CD16-CD56+P+ and CD16-CD56+G+ natural killer (NK) cells. Finally, we investigated differential expression of P and G in NK cells and cytotoxic T lymphocytes (CTLs) in paired tumor tissues (group…
Genes, proteins, chemicals, diseases, species, mutations and cell lines named across the full text — each resolved to its canonical identifier and authoritative record.
Click any figure to enlarge with its caption.
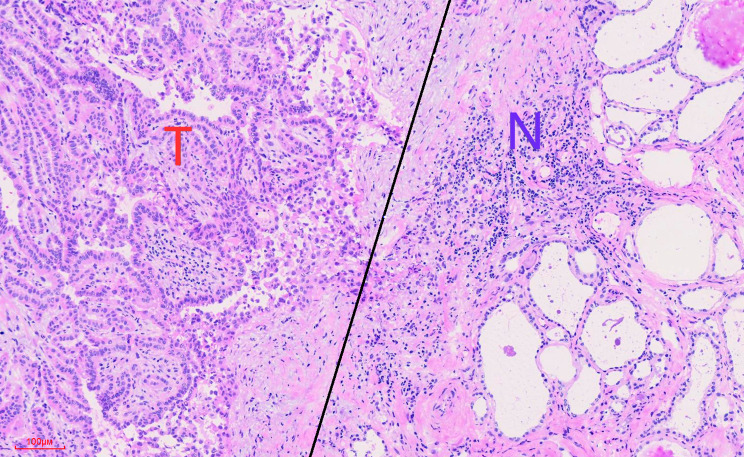 Figure 1
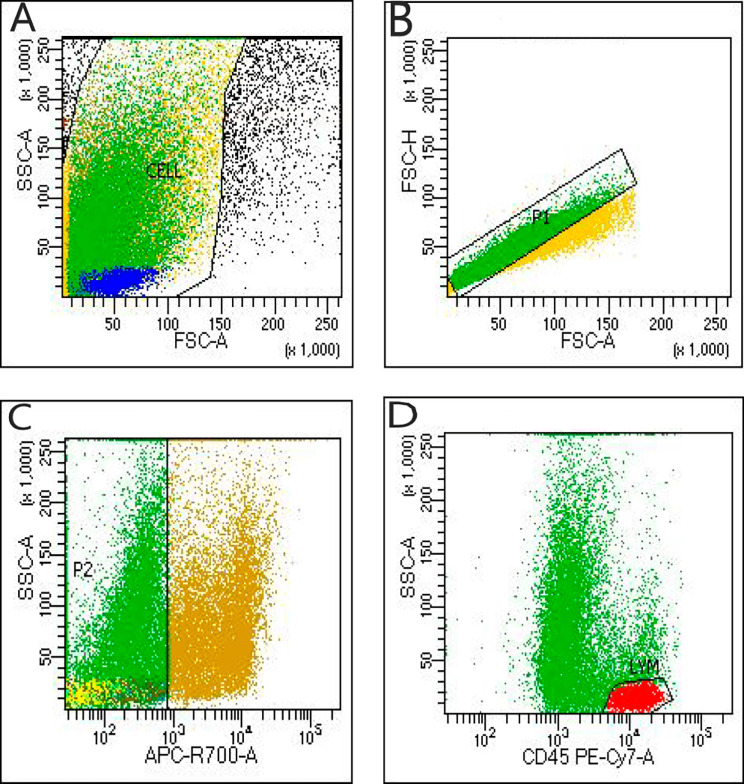 Figure 2
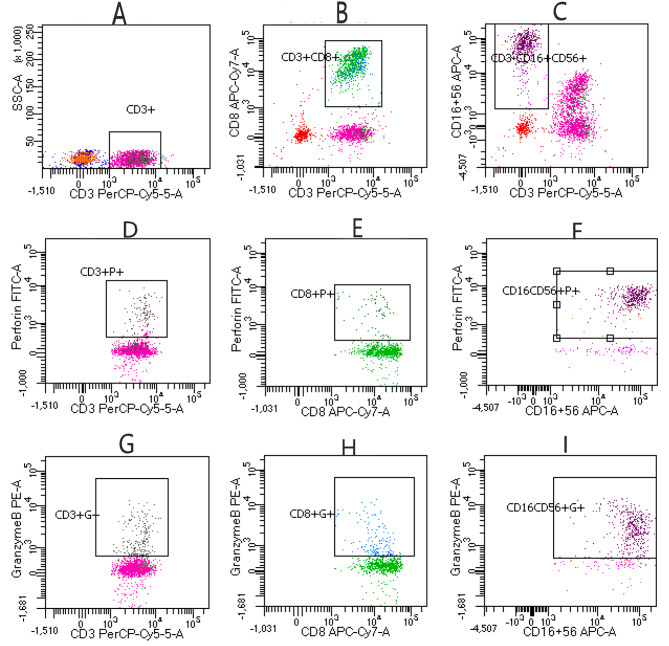 Figure 3
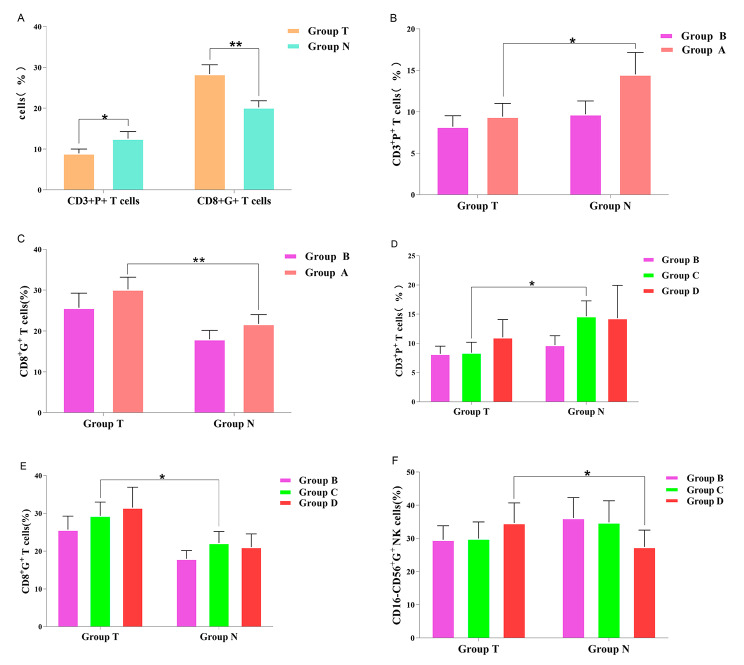 Figure 4
Peer Reviews
No public reviews on file for this paper yet. If you reviewed it on a platform where reviews are public (OpenReview, ICLR, NeurIPS, ICML), you can paste yours below so the community can read it here.
Videos
No videos yet. Explain this paper in a talk, walkthrough, or lecture? Add one.
Taxonomy
TopicsImmunotherapy and Immune Responses · Cancer Immunotherapy and Biomarkers · Cytokine Signaling Pathways and Interactions
Introduce
Tumors derived from the thyroid gland are the most common endocrine tumors [1], and the incidence of PTC has been rising throughout the world [2, 3]. Current studies suggest that immune cells may play an important role in tumor behavior, including tumor initiation, progression, metastasis and immunotherapy effects [4, 5]. Studies about the immune response in PTC have also been increasingly carried out, which may lead to novel immunotherapeutic approaches in thyroid cancer [6–8]. One study showed that expression of PD-1 in T lymphocytes in peripheral blood significantly differed in PTC, nodular goiter (NG) and HP patients. T-cell exhaustion is considered a risk factor for lymph node metastasis [9]. Research has shown that many tumor-infiltrating FoxP3^+^ Treg cells are found in primary PTC and metastatic lymph node tissues. A higher percentage of Treg cells in both peripheral blood and tumor tissues may be related to tumor aggressiveness [10]. In addition, more CD3^+^CD4^−^CD8^−^ double-negative (DN) T lymphocytes infiltrate thyroid cancer tissues more than benign nodules, such as in NG, HT, and Graves’ disease. The cutoff value of > 9.14% DN T lymphocytes has been proposed for early diagnosis of thyroid cancer with 100% specificity [11]. The above results indicate new diagnostic and immunotherapeutic targets for PTC.
The purpose of this study was to research the killing capacity of tumor-infiltrating NK cells and CTLs in the tumor microenvironment (TME) and evaluate the association between CLs and CCLNM in PTC, which may provide a novel immunotherapeutic strategy for PTC patients.
Materials and methods
Patients
The present study was approved by the Beijing Chuiyangliu Hospital ethical committee (Version number: SOP-CYLIRB-2.0). The criteria for inclusion in this study included solitary classic PTC nodules ranging from 1 to 1.8 cm in greatest dimension limited to the thyroid (T1b), a number of cervical central lymph nodes resected of no less than 5, and the BRAF V600E mutation positivity. The exclusion criteria were lack of lymphocyte infiltration in tumor tissues or paracancerous tissues and those with Hashimoto’s thyroid or other malignant tumors.
Tissue preparation
The remaining fresh tissue samples after pathology sampling of classic PTC diagnosed by frozen sectioning were collected in the Department of Pathology of Beijing Chuiyangliu Hospital. Tumor tissues and paracancerous tissues with lymphocyte infiltration confirmed by frozen sections [Fig. 1] were collected separately and immersed in a Petri dish containing phosphate-buffered saline (PBS). Then, the tissue was sheared with phthalmic scissors, transferred with PBS to a 5 mL tissue homogenizer and minced into a small tissue homogenate. The tissue homogenate was filtered through a 300 mesh stainless steel strainer. The cell suspension was collected in a 15 mL centrifuge tube with PBS and centrifuged at 300 × g for 5 min. After the supernatant was removed, the cells were resuspended in 300 µL of PBS, and flow cytometry analysis was performed.
Fig. 1. Lymphocytes infiltrated in both tumor tissues (T) and paracancerous tissues (N) by frozen sectioning
Flow cytometry analysis
Antibodies used for flow cytometry included CD45 (PE-Cy7), CD3 (PerCP), CD8 (APC-Cy7), CD16 (APC), CD56 (APC), perforin and granzyme B, all from RAISE CARE Biotechnology Co. Ltd. (Qingdao, China). Data were analyzed using a BD FACSCanto analyzer. A 50 µL cell suspension and 25 µL premix antibody reagent including CD45, CD3, CD8, CD16, and CD56 were incubated in the dark for 15 min at room temperature. Then, 120 µL fixative and 2 mL membrane break regent were added, and the sample was incubated in the dark for 15 min. The solution was centrifuged at 350 x g for 5 min, and the supernatant was removed. Then, 5 µL of granzyme B and perforin were added and incubated in the dark for 15 min. The samples were suspended in 200 µL of PBS and analyzed with a BD FACSCanto cytometer and BD FASCDiva 8.0.3 software. Selective cell gating by FSC/SSC was performed. In addition, P1 was plotted by using FSC-A/FSC-H to avoid adhesive, and P2 was further plotted by APCR700/SSC to avoid nonspecific dead cells. We plotted lymphocyte subsets with high CD45 and low SSC phenotype characteristics [Fig. 2], and at least 3000 gated events were measured in every sample. We plotted CD3/SSC and selected CD3^+^ cells. By following the percentages of CD3^+^P^+^, CD3^+^G^+^, CD8^+^P^+^, and CD8^+^G^+^ T-cell populations, the percentages of CD3^−^CD16-CD56^+^P^+^ and CD3^−^CD16-CD56^+^G^+^ NK cell populations were obtained [Fig. 3].
Fig. 2(A) Select cell gating by FSC/SSC was performed. (B) P1 was plotted by FSC-A/FSC-H. (C) P2 was plotted by APCR700/SSC. (D) The CD45/SSA gating strategy was used for the next analysis
Fig. 3(A) CD3^+^ T lymphocytes; (B) CD8^+^ T lymphocytes; (C) CD3^−^CD16-CD56^+^ NK cells; (D) CD3^+^Perforin^+^ T lymphocytes; (E) CD8^+^perforin^+^ T lymphocytes; (F) CD16-CD56^+^perforin^+^ NK cells; (G) CD3^+^granzyme-B^+^ T lymphocytes; (H) CD8^+^granzyme-B^+^ T lymphocytes; (I) CD16CD56^+^granzyme-B^+^ NK cells
Molecular analysis
DNA was extracted from the same surgical paraffin-embedded tissue blocks using DNA Sample Preparation Kit (Roche USA) following the manufacturer’s instructions. Exon 15 mutation of the BRAF gene (V600E) was assessed using a Cobus 4800 BRAF V600 Mutation Test Kit (Roche, USA) and a Cobas z480 following the manufacturer’s instructions at the Molecular Pathology Laboratory of Chuiyangliu Hospital.
Statistical analysis
Statistical analysis was performed using GraphPad Prism version 9.5.1 software. The paired sample t test, independent t test and one-way analysis of variance (ANOVA) were used for statistical comparisons. The significance level was set at P < 0.05.
Results
Patient population characteristics
Based on the above criteria, 44 PTC patients (35 female) were included from May to September 2023. The median age was 43.43 (range 23–71) years. All cases were divided into two paired groups: the tumor group (group T, n = 44) and the paracancerous group (group N, n = 44). Patients were divided into two groups according to whether CCLNM existed: group A (with lymph node metastases, n = 27) and group B (with nonlymph node metastases, n = 17). Furthermore, patients were divided into three groups according to the total number of positive CCLNM: group B, group C (with low-level lymph node metastases, less than 5, n = 17) and group D (with high-level lymph node metastases, no less than 5, n = 10).
Flow cytometry results
The killing capacity characteristics of NK cell and CTL subpopulations in the core tumor tissues and paracancerous tissues of PTC
We examined expression of CD3^+^P^+^, CD3^+^G^+^, CD8^+^P^+^, and CD8^+^G^+^ CTL subpopulations and CD16-CD56^+^P^+^ and CD16-CD56^+^G^+^ NK cell subpopulations in group T and group N PTC (Table 1). The results showed that the percentage of CD3^+^P^+^ CTL subpopulations in group T was significantly lower than that in group N (P < 0.05) but that the percentage of CD8^+^G^+^ CTL subpopulations in group T was significantly higher than that in group N (P < 0.05, Fig. 4A) according to a paired sample t test. In addition, expression of CD3^+^G^+^ and CD8^+^P^+^ CTL subpopulations and CD16-CD56^+^P^+^ and CD16-CD56^+^G^+^ NK cell subpopulations between the two groups was not significantly different (P > 0.05).
Fig. 4(A) The percentage of the CD3^+^P^+^ T-cell subset in group T was significantly lower than that in group N, and the percentage of the CD8^+^G^+^ T-cell subset in group T was significantly higher than that in group N (P < 0.05). (B) The percentage of the CD3^+^P^+^ T-cell subset in group A in tumor tissues was significantly lower than that in paracancerous tissues (P < 0.05). (C) The percentage of the CD8^+^G^+^ T-cell subset in group A in tumor tissues was significantly higher than that in paracancerous tissues (P < 0.05). (D) The percentage of the CD3^+^P^+^ T-cell subset in group C in tumor tissues was significantly lower than that in paracancerous tissues (P < 0.05). (E) The percentage of the CD8^+^G^+^ T-cell subpopulation in group C in tumor tissue was significantly higher than that in paracancerous tissues (P < 0.05). (F) The percentage of CD16-CD56^+^G^+^ NK cells subset of the group C in the tumor tissue was significantly higher than that in the paracancerous tissue (P < 0.05)
Relative differential killing capacity of NK cell and CTL subpopulations in core tumor tissues and paracancerous tissues with or without CCLNM in PTC
We examined expression of CD3^+^P^+^, CD3^+^G^+^, CD8^+^P^+^, and CD8^+^G^+^ CTL subpopulations and CD16-CD56^+^P^+^ and CD16-CD56^+^G^+^ NK cell subpopulations in groups A and B of PTC (Table 2). The results showed that the percentage of CD3^+^P^+^ CTL subpopulations in group A in the tumor tissues was significantly lower than that in the paracancerous tissues (P < 0.05, Fig. 4B) but that the percentage of CD8^+^G^+^ CTL subpopulations in group A in the tumor tissues was significantly higher than that in the paracancerous tissues (P < 0.05, Fig. 4C) by a paired sample t test. In addition, the percentages of CD3^+^G^+^ and CD8^+^P^+^ CTLs and CD16-CD56^+^P^+^ and CD16-CD56^+^G^+^ NK cells in group A were not significantly different between the tumor tissues and paracancerous tissues (P > 0.05). No significant differences in any data in group B were observed between the tumor tissues and paracancerous tissues (P > 0.05). There were no significant differences between group A and group B of all indexes in the tumor tissues or paracancerous tissues (P > 0.05) according to the independent samples t test.
Relative differential killing capacity of NK cell and CTL subpopulations in core tumor tissues and paracancerous tissues with varying levels of CCLNM in PTC
We examined expression of CD3^+^P^+^, CD3^+^G^+^, CD8^+^P^+^, and CD8^+^G^+^ CTL subpopulations and CD16-CD56^+^P^+^ and CD16-CD56^+^G^+^ NK cell subpopulations in groups B, C and D of PTC (Table 3). The results showed that the percentage of CD3^+^P^+^ CTL subpopulations in group C in the tumor tissues was significantly lower than that in the paracancerous tissues (P < 0.05, Fig. 4E) but that the percentage of CD8^+^G^+^ CTL subpopulations in group C in the tumor tissues was significantly higher than that in the paracancerous tissues (P < 0.05, Fig. 4E) by a paired sample t test. In addition, the subpolulation of CD16-CD56^+^G^+^ NK cells in group C in the tumor tissues was significantly higher than that in the paracancerous tissues (P < 0.05, Fig. 3F). The results of ANOVA indicated that the percentage of NK cells and CTL subpopulations did not differ significantly in the tumor tissues or the paracancerous tissues among group B, group C and group D.
Molecular analysis
In this study, BRAF V600E mutation positivity in PTC with lymphocyte infiltration characteristics was 83.9% (52/62). Forty-four PTC-positive patients were included in the final analysis.
Table 1. Killing capacity indexes of NK cells and CTLs in tumor tissues and paracancerous tissuesGroup T(n = 44)Group N(n = 44)tPCD3^+^P^+^(%)8.93 ± 1.0712.55 ± 1.71-2.4660.018CD3^+^G^+^(%)20.8 ± 2.0320.78 ± 2.710.010.992CD8^+^P^+^(%)8.75 ± 1.019.13 ± 1.07-0.2930.771CD8^+^G^+^(%)28.36 ± 2.2820.21 ± 1.613.7190.001CD16-CD56^+^P^+^(%)29.35 ± 2.9435.13 ± 3.66-1.8390.073CD16-CD56^+^G^+^(%)30.87 ± 2.8133.69 ± 3.6-1.1590.253Values are expressed as the mean ± standard error of the mean (SEM). Comparisons were madeusing a paired t test. *Represents significant differences (P < 0.05)
Table 2. Relativity indexes of the differential killing capacity of NK cells and CTLs in tumor tissues and paracancerous tissues with or without CCLNM in PTCGroup B(n = 17)Group A(n = 27)tPCD3^+^P^+^(%)_T8.21 ± 1.329.42 ± 1.59-0.5520.584CD3^+^P^+^(%)_N9.71 ± 1.614.52 ± 2.64-1.560.127t-1.068-2.245p0.30.034CD3^+^G^+^(%)_T19.66 ± 3.2621.59 ± 2.63-0.4650.644CD3^+^G^+^(%)_N15.76 ± 2.7524.25 ± 4.09-1.5650.125t1.842-0.799p0.0830.432CD8^+^P^+^(%)_T7.87 ± 1.439.37 ± 1.4-0.7250.472CD8^+^P^+^(%)_N9.56 ± 1.628.84 ± 1.430.3260.746t-0.8770.297p0.3930.769CD8^+^G^+^(%)_T25.71 ± 3.5630.2 ± 2.98-0.9690.338CD8^+^G^+^(%)_N18 ± 2.1621.75 ± 2.26-1.1470.258t1.9633.264p0.0660.003CD16-CD56 + P+(%)_T29.56 ± 4.3829.2 ± 4.010.0580.954CD16-CD56 + P+(%)_N37.49 ± 6.1333.49 ± 4.590.5320.598t-1.761-0.985p0.0960.334CD16-CD56 + G+(%)_T29.58 ± 4.2331.76 ± 3.82-0.3780.708CD16-CD56 + G+(%)_N36.16 ± 6.1331.98 ± 4.440.5650.575t-1.895-0.067p0.0750.947Values are expressed as the mean ± standard error of the mean (SEM). Within-group comparisonswere made using paired t tests, and comparisons between groups were made using independentsamples t test, *represents significant differences (P < 0.05)
Table 3. Relativity indexes of the differential killing capacity of NK cells and CTLs in tumor tissues and paracancerous tissues with varying levels of CCLNM in PTCGroup B(n = 17)Group C(n = 17)Group D(n = 10)FPCD3^+^P^+^(%)_T8.21 ± 1.328.41 ± 1.7811.05 ± 3.040.5670.572CD3^+^P^+^(%)_N9.71 ± 1.614.64 ± 2.6414.32 ± 5.620.9540.394t-1.068-2.249-0.815p0.30.040.436CD3^+^G^+^(%)_T19.66 ± 3.2620.24 ± 3.3723.76 ± 4.350.310.735CD3^+^G^+^(%)_N15.76 ± 2.7520.7 ± 3.229.94 ± 9.362.0970.136t1.842-0.172-0.807p0.0830.8660.441CD8^+^P^+^(%)_T7.87 ± 1.439.69 ± 1.918.85 ± 2.10.3040.74CD8^+^P^+^(%)_N9.56 ± 1.629.82 ± 1.747.28 ± 2.530.4390.648t-0.877-0.0590.519p0.3930.9540.616CD8^+^G^+^(%)_T25.71 ± 3.5629.37 ± 3.6231.54 ± 5.380.5210.598CD8^+^G^+^(%)_N18 ± 2.1622.16 ± 3.0521.08 ± 3.480.6750.515t1.9632.8691.88p0.0660.0120.093CD16-CD56^+^P^+^(%)_T29.56 ± 4.3825.96 ± 5.5734.39 ± 5.340.5650.573CD16-CD56^+^P^+^(%)_N37.49 ± 6.1337.18 ± 6.6527.59 ± 5.30.6120.547t-1.761-1.8851.508p0.0960.0790.166CD16-CD56^+^G^+^(%)_T29.58 ± 4.2329.96 ± 5.0134.64 ± 6.070.2570.775CD16-CD56^+^G^+^(%)_N36.16 ± 6.1334.82 ± 6.5227.45 ± 5.030.4440.645t-1.895-1.0142.559p0.0750.3270.031*Values are expressed as the mean ± standard error of the mean (SEM). Within-group comparisonswere made using paired t tests, and comparisons among groups were made using one-wayANOVA, *represents significant differences (P < 0.05)
Discussion
The tumor microenvironment (TME) comprises all noncancerous host cells in the tumor and its noncellular components, including molecular products [12–14]. Among them, cytotoxic lymphocytes are being investigated in the immune surveillance of cancer and potential immunotherapies, and the role of cytotoxic lymphocytes in defending against cancer has been appreciated [15, 16]. Cytotoxic lymphocytes include natural killer cells and cytotoxic T lymphocytes. NK cells, as innate immunity effector cells, play a significant role in inhibiting tumor progression [17]. Gogali F et al. found that the CD3^−^CD16^+^CD56^dim^ cell subpopulation had significant predominance compared to CD3^−^CD16^−^CD56^bright^ NK cells in blood samples among PTC, NG and healthy donors. The research showed that the CD3^−^CD16^−^CD56^bright^ NK cell subpopulation infiltrating tissue may be associated with PTC progression. CD16^−^CD56^bright^ NK cells with immunoregulatory functions were increased in the tumor microenvironment of PTC [18]. CD8^+^ T cells are a subpopulation of lymphocytes with the potential to kill tumor cells presenting major histocompatibility complex (MHC) class I molecules [19]. Both NK cells and cytotoxic T cells can secrete perforin and granzyme, which play key roles in innate and adaptive immune defense against cancer development [20, 21]. However, studies have found that tumors have specific mechanisms to induce tumor immunological tolerance by interfering with immune cell responses [22]. NK cell and CD8^+^ T-cell dysfunction and exhaustion have been confirmed in various cancers due to immunosuppression within the TME [23, 24], including thyroid cancer [25–27]. In this study, we investigated the killing capability of NK cells and CTLs to produce perforin and granzyme-B in different regions, including the core tumor infiltration region of the TME and the marginal infiltration zone of paracancerous tissues. Expression of CD3^+^P^+^, CD3^+^G^+^, CD8^+^P^+^, and CD8^+^G^+^ CTL subsets and CD16-CD56^+^P^+^ and CD16-CD56^+^G^+^ NK cell subsets was detected by flow cytometry. Our results showed that the percentages of granzyme-B and perforin were different in the TME and paracancerous tissues. The percentage of CD3^+^P^+^ T-cell subsets in the core tumor tissue was significantly lower than that in the paracancerous tissues, but the percentage of CD8^+^G^+^ T-cell subsets in the tumor tissues was significantly higher than that in the paracancerous tissues. Our study demonstrated that infiltrating cytotoxic lymphocytes in different regions of the TME and paracancerous tissues have different killing capacities.
Although PTC has favorable prognosis, CCLNM is common [28]. Indeed, CCLNM is known as a predictive risk factor for lateral lymph node metastasis and poor progression [29–31]. In this study, the CCLNM rate was 61.36%, consistent with a previous report [32].
The cutoff value of the positive number of CCLNMs ranged from 2 to 5 [33–36]. In this study, a positive number of CCLNM > 5 was accepted as a cutoff value for high risk. Patients with CCLNM (group A) were divided into group C (with low-level CCLNM) and group D (with high-level CCLNM). The percentage of the CD3^+^P^+^ T-cell subset in group C in the tumor tissues was significantly lower than that in the paracancerous tissues by a paired t test, though the percentage of the CD8^+^G^+^ T-cell subset in group C in the tumor tissues was significantly higher than that in the paracancerous tissues. In addition, the percentage of the CD16-CD56^+^G^+^ NK cell subset in group C in the tumor tissues was significantly higher than that in the paracancerous tissues. Higher expression of CD16-CD56^+^G^+^ NK cells in the core tumor region of PTC may be associated with a higher risk of lymph node metastasis, which may provide targeted immunotherapy prospects.
Hashimoto’s thyroiditis (HT), also known as chronic lymphocytic thyroiditis, is a common autoimmune disorder of the thyroid gland with lymphoplasmacytic cell infiltration into the stroma [37]. Current studies on the relationship between HT and PTC are controversial regarding whether HT affects PTC tumorigenesis and progression [38–40]. We found that distinguishing tumor-infiltrating immunocytes from innate immunocytes in PTC patients with HT differed. As a result, PTC patients with HT were excluded from this study.
The BRAF V600E mutation is known to be associated with aggressive tumor behavior, recurrence, and poor progression of PTC [41, 42]. Given the significant influence on PTC, in this study, cases with wild-type BRAF were excluded.
In summary, our study demonstrates that infiltration of cytotoxic lymphocytes in different regions of the TME and paracancerous tissues has different killing capacities and is associated with CCLNM. Further studies about the PD1/PD-L1 pathway, immune regulatory mechanism and PTC related to HT are needed, which may contribute to providing immunotherapeutic strategies for predicting progression.
The reference list from the paper itself. Each links out to its DOI / PubMed record.
- 1Baloch ZW Overview of the 2022 WHO classification of thyroid neoplasms Endocr Pathol 2022331276310.1007/s 12022-022-09707-335288841 · doi ↗ · pubmed ↗
- 2Seib CD Sosa JA Evolving understanding of the epidemiology of thyroid Cancer Endocrinol Metab Clin North Am 2019481233510.1016/j.ecl.2018.10.00230717905 · doi ↗ · pubmed ↗
- 3Roman BR Morris LG Davies L The thyroid cancer epidemic, 2017 perspective Curr Opin Endocrinol Diabetes Obes 2017245332610.1097/MED.000000000000035928692457 PMC 5864110 · doi ↗ · pubmed ↗
- 4Gonzalez H Hagerling C Werb Z Roles of the immune system in cancer: from tumor initiation to metastatic progression Genes Dev 20183219–2012678410.1101/gad.314617.11830275043 PMC 6169832 · doi ↗ · pubmed ↗
- 5Oliveira G Wu CJ Dynamics and specificities of T cells in cancer immunotherapy Nat Rev Cancer 202323529531610.1038/s 41568-023-00560-y 37046001 PMC 10773171 · doi ↗ · pubmed ↗
- 6Ji FH Characterization of m 6A methylation modifications and tumor microenvironment infiltration in thyroid cancer Clin Transl Oncol 20232512698210.1007/s 12094-022-02940-636163443 · doi ↗ · pubmed ↗
- 7Egan CECSPG 4 is a potential therapeutic target in anaplastic thyroid Cancer Thyroid 202131101481933407812310.1089/thy.2021.0067 PMC 8917884 · doi ↗ · pubmed ↗
- 8Jin YERBB 2 as a prognostic biomarker correlates with immune infiltrates in papillary thyroid cancer Front Genet 20221396636510.3389/fgene.2022.96636536437939 PMC 9682178 · doi ↗ · pubmed ↗