Assessing 2D visual encoding of 3D spatial connectivity
Benedetta F. Baldi, Jenny Vuong, Seán I. O’Donoghue

TL;DR
This study compares different visual layouts for showing spatial connectivity data and finds that circular layouts work best for small datasets.
Contribution
The paper introduces a crowdsourcing approach to evaluate visual layouts for spatial connectivity data in bioinformatics.
Findings
The circular layout was most accurate and intuitive for Mechanical Turk participants.
Experts found circular and half-matrix layouts more accurate than the matrix layout.
Crowdsourcing can help identify effective visual layouts for bioinformatics data challenges.
Abstract
Introduction: When visualizing complex data, the layout method chosen can greatly affect the ability to identify outliers, spot incorrect modeling assumptions, or recognize unexpected patterns. Additionally, visual layout can play a crucial role in communicating results to peers. Methods: In this paper, we compared the effectiveness of three visual layouts—the adjacency matrix, a half-matrix layout, and a circular layout—for visualizing spatial connectivity data, e.g., contacts derived from chromatin conformation capture experiments. To assess these visual layouts, we conducted a study comprising 150 participants from Amazon’s Mechanical Turk, as well as a second expert study comprising 30 biomedical research scientists. Results: The Mechanical Turk study found that the circular layout was the most accurate and intuitive, while the expert study found that the circular and half-matrix…
Genes, proteins, chemicals, diseases, species, mutations and cell lines named across the full text — each resolved to its canonical identifier and authoritative record.
Click any figure to enlarge with its caption.
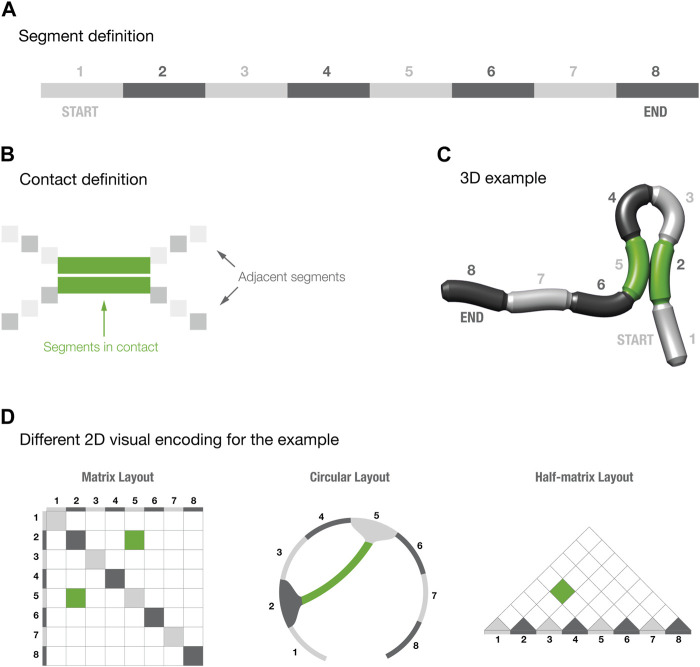 Figure 1
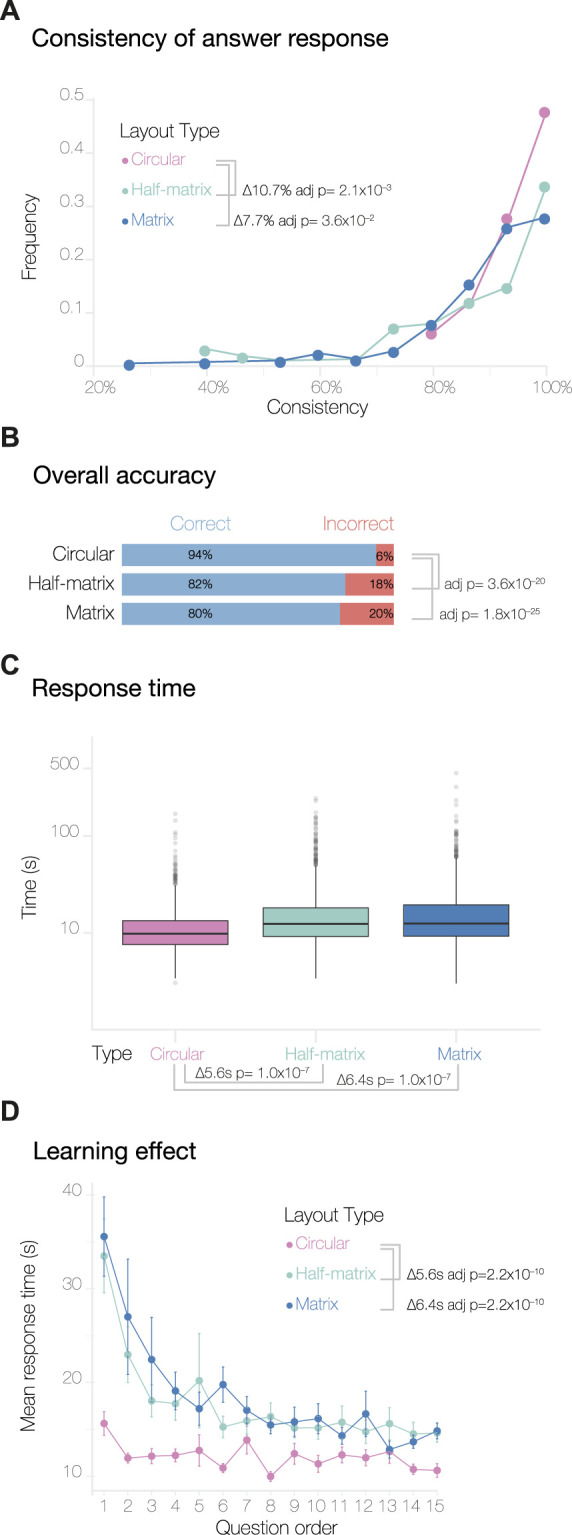 Figure 2
 Figure 3
 Figure 4
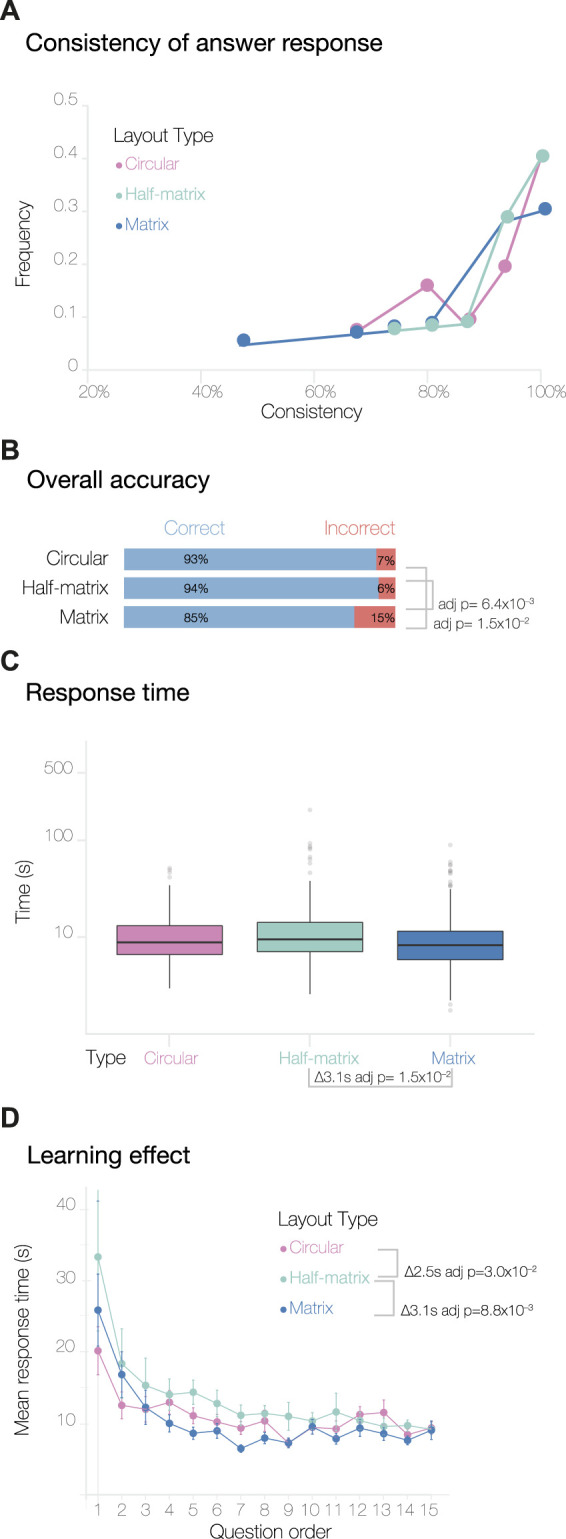 Figure 5
 Figure 6
Peer Reviews
No public reviews on file for this paper yet. If you reviewed it on a platform where reviews are public (OpenReview, ICLR, NeurIPS, ICML), you can paste yours below so the community can read it here.
Videos
No videos yet. Explain this paper in a talk, walkthrough, or lecture? Add one.
Taxonomy
TopicsData Visualization and Analytics · Complex Network Analysis Techniques · Gene expression and cancer classification