TrimTokenator: Towards Adaptive Visual Token Pruning for Large Multimodal Models
Hao Zhang, Mengsi Lyu, Chenrui He, Yulong Ao, Yonghua Lin

TL;DR
This paper introduces TrimTokenator, an adaptive visual token pruning method for large multimodal models that significantly reduces token count and inference time while maintaining performance by selectively removing redundant visual tokens.
Contribution
It proposes a novel visual token pruning strategy based on mutual information and diversity maximization, explicitly preserving cross-modal alignment and intra-modal information.
Findings
Reduces visual tokens by 88.9%
Improves inference speed by 56.7%
Maintains strong model performance
Abstract
Large Multimodal Models (LMMs) have achieved significant success across various tasks. These models usually encode visual inputs into dense token sequences, which are then concatenated with textual tokens and jointly processed by a language model. However, the increased token count substantially raises computational and memory costs during inference. Token pruning has emerged as a promising approach to address this issue. Existing token pruning methods often rely on costly calibration or suboptimal importance metrics, leading to redundant retained tokens. In this paper, we analyze the redundancy differences between visual and textual tokens and propose pruning exclusively on visual tokens. Based on this, we propose a visual token pruning strategy that explicitly preserves both cross-modal alignment and intra-modal informational diversity. We introduce a mutual information-based token…
Click any figure to enlarge with its caption.
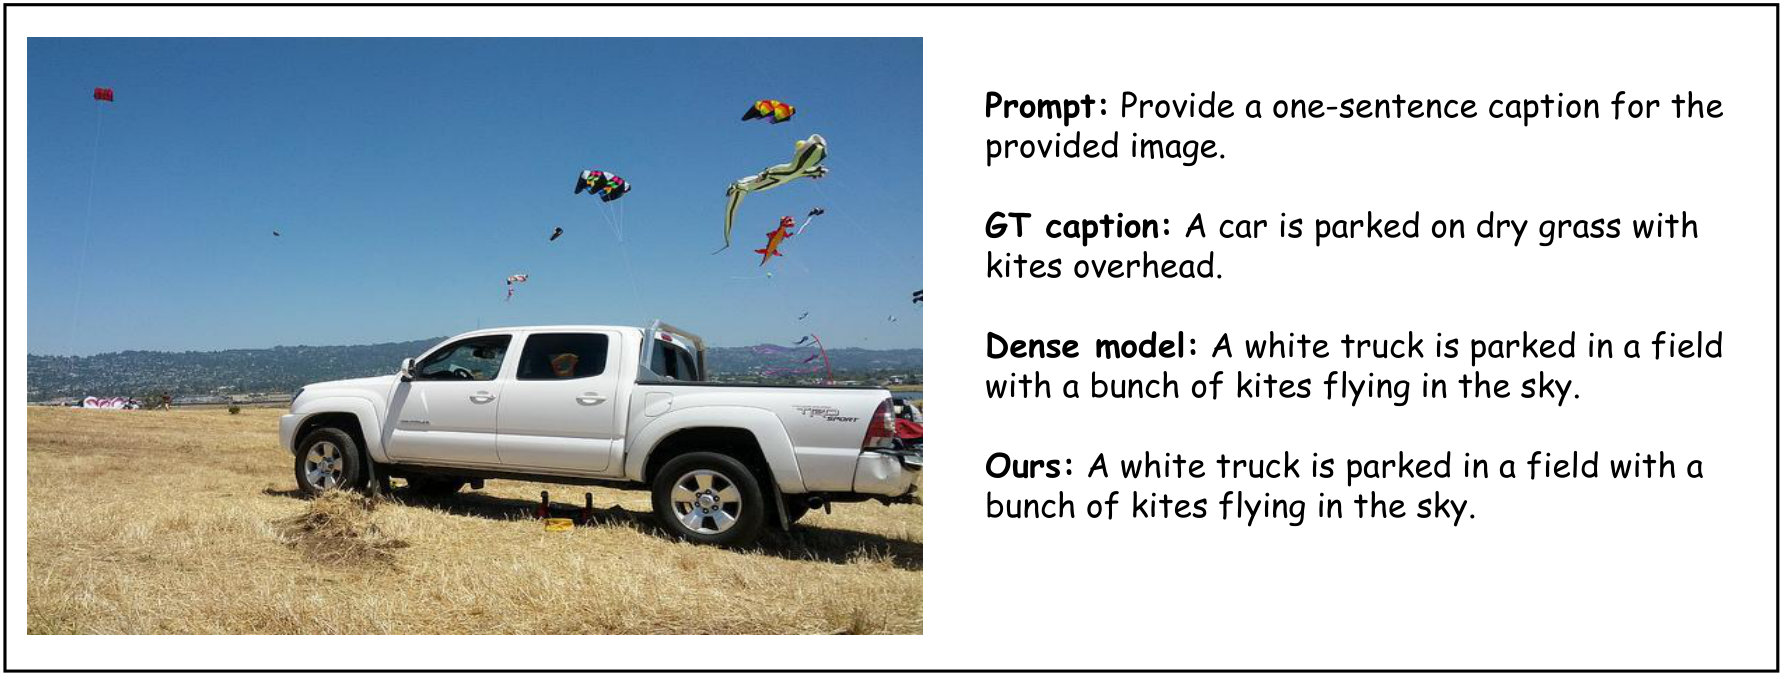 Figure 1
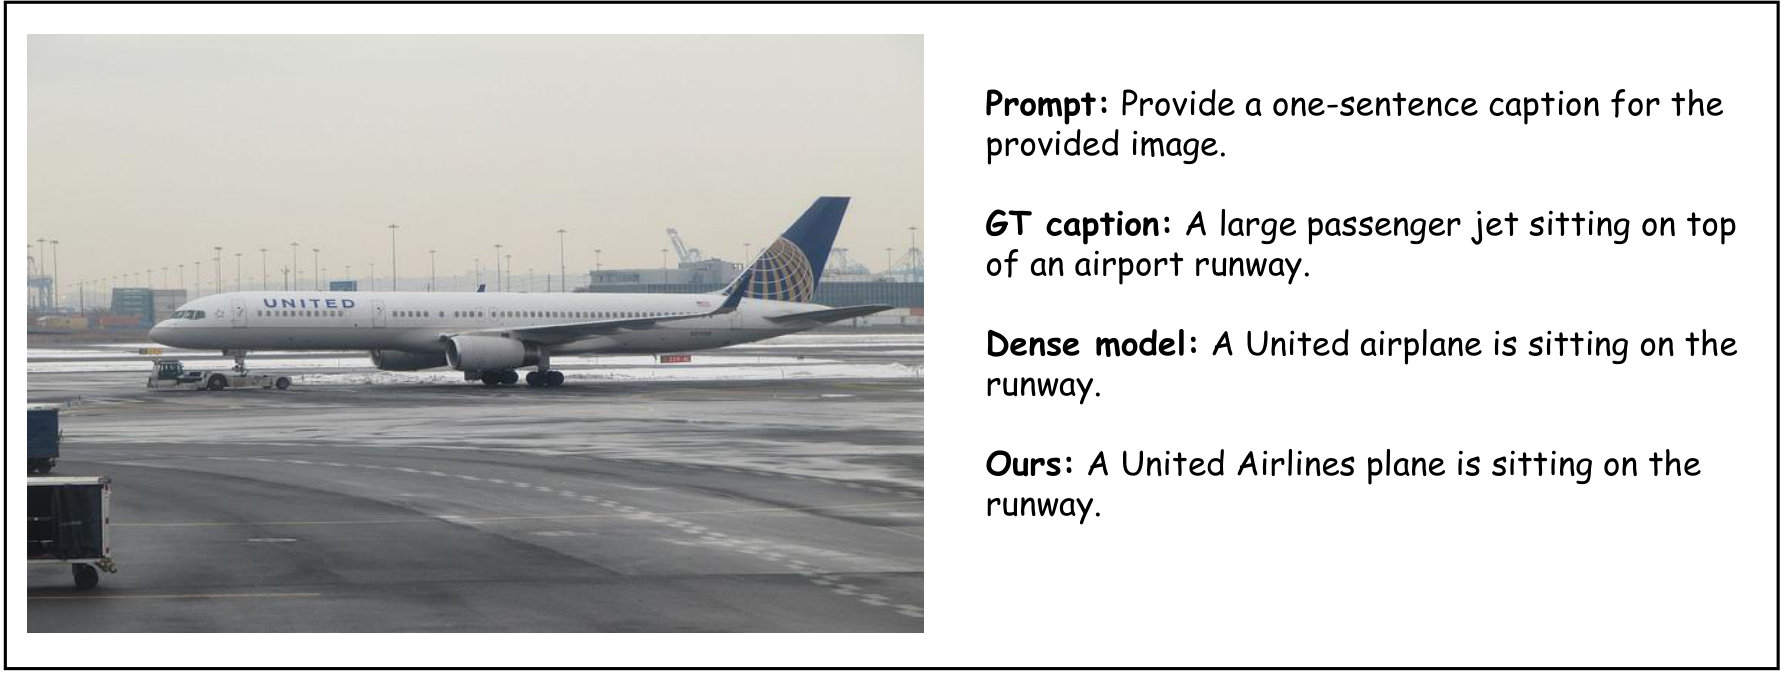 Figure 2
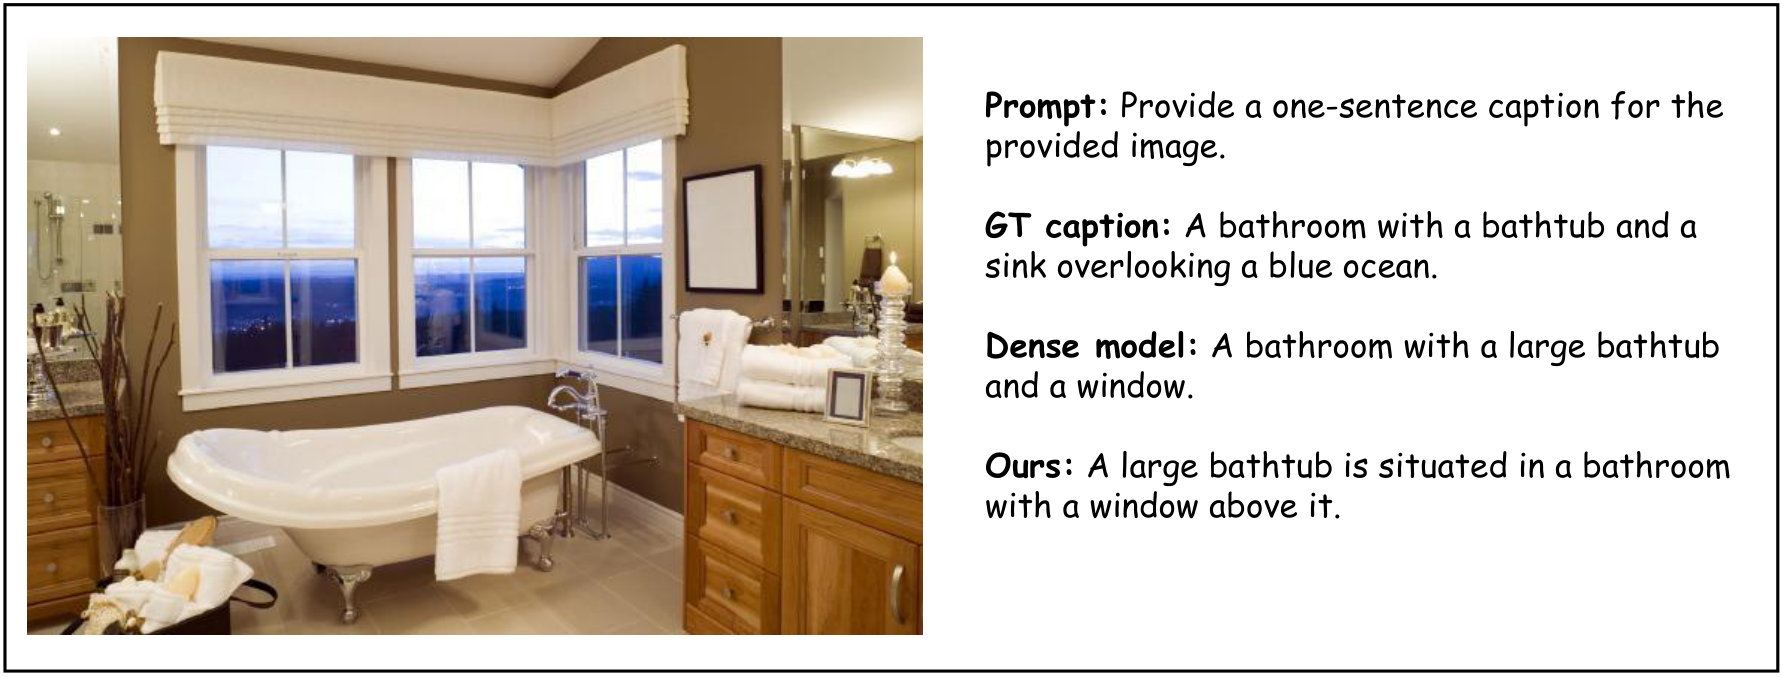 Figure 3
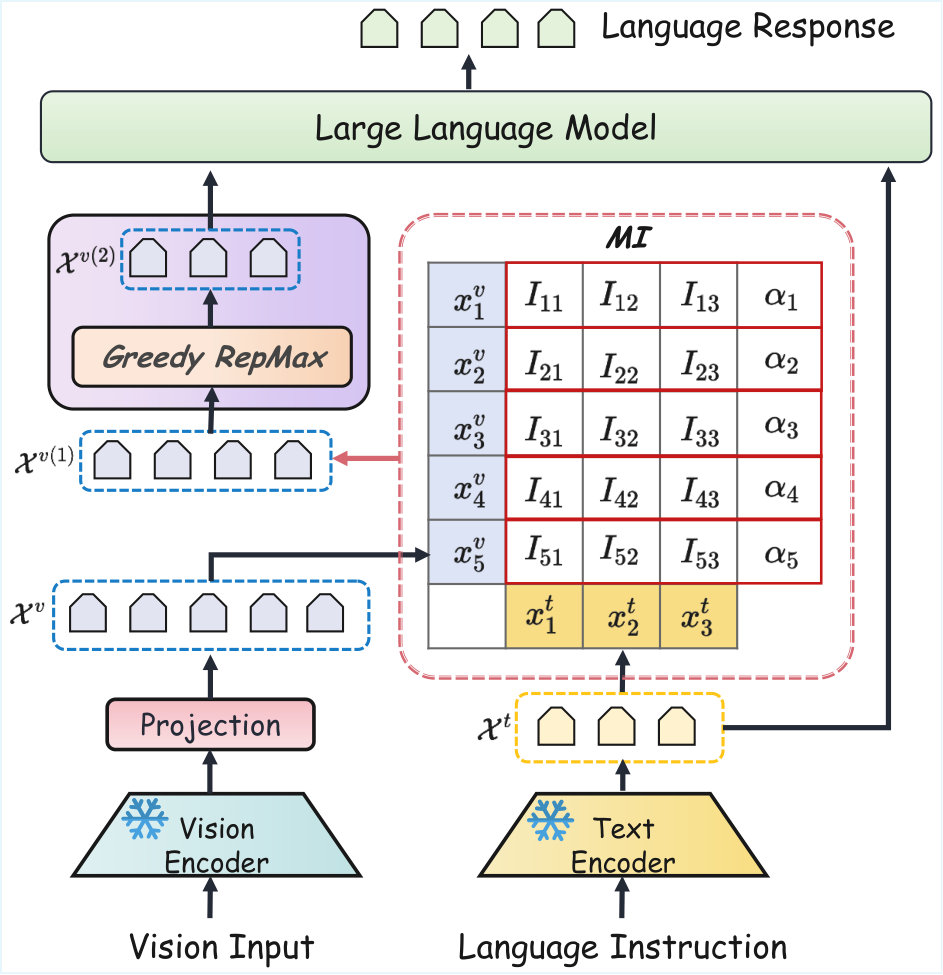 Figure 1
| Method | ChartQA | COCO | MMB | MME | MMU | NoCaps | OCRB | VQAOK | POPE | VQATEXT |
|---|---|---|---|---|---|---|---|---|---|---|
| Upper Bound, 576 Tokens | ||||||||||
| Dense | 18.20 | 1.10 | 64.09 | 1508.24 | 36.33 | 1.06 | 31.30 | 53.44 | 93.86 | 46.11 |
| Retain 192 Tokens | ||||||||||
| ToMe | 15.45 | 0.08 | 58.64 | 1262.74 | 31.49 | 0.08 | 29.19 | 46.88 | 77.64 | 39.60 |
| FastV | 15.24 | 0.08 | 63.06 | 1302.33 | 31.26 | 0.09 | 29.53 | 47.24 | 69.49 | 38.43 |
| SpVLM | 17.17 | 1.05 | 61.62 | 1390.39 | 35.55 | 1.00 | 30.16 | 50.47 | 89.66 | 42.00 |
| PDrop | 17.06 | 1.06 | 60.41 | 1426.75 | 34.42 | 0.99 | 30.35 | 50.83 | 88.26 | 41.78 |
| VisionZip | 17.48 | 1.06 | 62.92 | 1440.02 | 35.88 | 1.01 | 30.41 | 51.14 | 92.20 | 43.01 |
| DivPrune | 17.40 | 1.06 | 62.29 | 1436.44 | 35.78 | 1.01 | 30.40 | 51.55 | 91.37 | 43.24 |
| Ours | 17.80 | 1.08 | 63.75 | 1467.30 | 36.22 | 1.03 | 31.00 | 52.29 | 93.68 | 45.10 |
| Retain 128 Tokens | ||||||||||
| ToMe | 14.13 | 0.06 | 57.27 | 1066.04 | 30.69 | 0.06 | 24.93 | 43.24 | 68.92 | 37.90 |
| FastV | 13.86 | 0.07 | 62.89 | 1182.73 | 31.71 | 0.08 | 26.24 | 44.56 | 65.41 | 35.88 |
| SpVLM | 16.56 | 1.04 | 60.08 | 1346.25 | 33.85 | 1.01 | 28.06 | 48.35 | 88.35 | 40.51 |
| PDrop | 16.35 | 1.03 | 59.97 | 1320.85 | 34.76 | 1.01 | 28.81 | 49.85 | 90.32 | 41.30 |
| VisionZip | 17.00 | 1.05 | 61.94 | 1393.33 | 36.10 | 1.02 | 28.88 | 49.66 | 93.75 | 42.71 |
| DivPrune | 16.96 | 1.04 | 61.77 | 1396.25 | 36.22 | 1.04 | 29.00 | 50.02 | 91.31 | 41.66 |
| Ours | 17.80 | 1.06 | 62.80 | 1397.22 | 36.44 | 1.02 | 29.50 | 51.12 | 94.29 | 44.28 |
| Retain 64 Tokens | ||||||||||
| ToMe | 12.49 | 0.05 | 49.97 | 909.99 | 27.46 | 0.06 | 20.07 | 39.47 | 62.85 | 34.59 |
| FastV | 12.03 | 0.05 | 58.94 | 1004.35 | 29.40 | 0.06 | 22.04 | 41.65 | 57.46 | 32.81 |
| SpVLM | 14.92 | 0.99 | 58.03 | 1203.46 | 26.55 | 0.95 | 25.81 | 45.14 | 89.91 | 37.51 |
| PDrop | 15.14 | 0.99 | 45.42 | 1248.24 | 34.98 | 0.94 | 27.00 | 44.09 | 66.92 | 33.81 |
| VisionZip | 15.74 | 1.00 | 59.91 | 1348.03 | 35.80 | 0.95 | 28.50 | 48.85 | 92.85 | 41.31 |
| DivPrune | 15.84 | 0.99 | 59.28 | 1348.99 | 35.89 | 0.94 | 27.60 | 48.36 | 92.18 | 39.22 |
| Ours | 16.36 | 1.02 | 61.34 | 1359.12 | 36.11 | 0.98 | 29.00 | 49.37 | 95.01 | 41.45 |
| Method | ChartQA | COCO | MMB | NoCaps | OCRB | POPE |
|---|---|---|---|---|---|---|
| Upper Bound, 576 Tokens | ||||||
| Dense | 18.20 | 1.16 | 68.73 | 1.09 | 33.60 | 94.44 |
| Retain 144 Tokens | ||||||
| VisionZip | 17.44 | 1.10 | 65.76 | 1.03 | 31.19 | 95.54 |
| DivPrune | 17.28 | 1.09 | 66.41 | 1.02 | 31.10 | 94.63 |
| Ours | 17.44 | 1.10 | 67.35 | 1.04 | 33.00 | 96.69 |
| Retain 128 Tokens | ||||||
| VisionZip | 17.09 | 1.09 | 66.02 | 1.02 | 31.01 | 95.04 |
| DivPrune | 17.08 | 1.09 | 66.07 | 1.01 | 30.90 | 94.76 |
| Ours | 17.88 | 1.09 | 66.84 | 1.04 | 33.10 | 96.55 |
| Retain 64 Tokens | ||||||
| VisionZip | 16.29 | 1.04 | 64.44 | 0.97 | 29.77 | 95.03 |
| DivPrune | 16.32 | 1.03 | 64.52 | 0.97 | 30.10 | 95.84 |
| Ours | 16.56 | 1.05 | 64.95 | 0.99 | 30.60 | 97.63 |
| Method | ChartQA | COCO | MME | NoCaps | OCRB | POPE |
|---|---|---|---|---|---|---|
| Upper Bound, 2880 Tokens | ||||||
| Dense | 54.88 | 1.00 | 1519.30 | 0.88 | 52.50 | 95.71 |
| Retain 720 Tokens | ||||||
| ToMe | 36.57 | 0.08 | 1294.12 | 0.09 | 42.25 | 81.58 |
| FastV | 36.09 | 0.09 | 1334.69 | 0.10 | 42.74 | 73.01 |
| SpVLM | 40.66 | 0.95 | 1424.94 | 0.82 | 43.65 | 94.20 |
| PDrop | 40.39 | 0.95 | 1462.20 | 0.83 | 43.93 | 92.73 |
| VisionZip | 40.91 | 0.95 | 1480.45 | 0.84 | 44.07 | 96.27 |
| DivPrune | 41.20 | 0.95 | 1472.13 | 0.83 | 44.00 | 96.00 |
| Ours | 44.92 | 1.00 | 1503.24 | 0.86 | 46.40 | 96.44 |
| Retain 640 Tokens | ||||||
| ToMe | 32.43 | 0.08 | 1133.13 | 0.08 | 37.05 | 72.73 |
| FastV | 31.82 | 0.08 | 1257.15 | 0.09 | 39.00 | 69.02 |
| SpVLM | 37.99 | 0.94 | 1430.96 | 0.83 | 41.71 | 93.22 |
| PDrop | 37.53 | 0.94 | 1403.96 | 0.82 | 42.82 | 95.31 |
| VisionZip | 39.01 | 0.96 | 1475.23 | 0.83 | 42.87 | 96.67 |
| DivPrune | 38.92 | 0.96 | 1484.12 | 0.83 | 43.10 | 96.35 |
| Ours | 43.72 | 0.99 | 1492.60 | 0.99 | 45.10 | 96.76 |
| Retain 320 Tokens | ||||||
| ToMe | 25.27 | 0.08 | 976.13 | 0.08 | 25.23 | 66.17 |
| FastV | 24.34 | 0.08 | 1077.35 | 0.08 | 27.71 | 60.50 |
| SpVLM | 30.18 | 0.92 | 1290.93 | 0.80 | 32.45 | 94.66 |
| PDrop | 30.62 | 0.92 | 1338.97 | 0.80 | 33.95 | 70.46 |
| VisionZip | 32.14 | 0.94 | 1445.85 | 0.81 | 35.35 | 95.71 |
| DivPrune | 32.04 | 0.93 | 1447.05 | 0.80 | 34.70 | 97.05 |
| Ours | 35.64 | 0.96 | 1452.37 | 0.82 | 37.90 | 96.47 |
| Method | Memory (G) | Latency (ms) |
|---|---|---|
| Dense | 15.53 | 235.2 |
| VTW | 13.63 | 103.71 |
| FastV | 13.63 | 108.29 |
| DivPrune | 13.63 | 99.53 |
| Ours | 13.63 | 100.13 |
| Method | ChartQA | COCO | MMB | MME | MMU | NoCaps |
|---|---|---|---|---|---|---|
| DivPrune∗ | 15.98 | 1.01 | 60.28 | 1355.28 | 36.02 | 0.96 |
| Ours | 16.36 | 1.02 | 61.34 | 1359.12 | 36.11 | 0.98 |
| Method | ChartQA | COCO | MMB | MME | MMU | NoCaps |
|---|---|---|---|---|---|---|
| 13.12 | 0.83 | 50.00 | 1114.77 | 34.56 | 0.76 | |
| 13.08 | 0.83 | 49.57 | 1108.64 | 34.33 | 0.75 | |
| 16.16 | 1.00 | 59.97 | 1311.46 | 36.02 | 0.97 | |
| Ours | 16.36 | 1.02 | 61.34 | 1359.12 | 36.11 | 0.98 |
| Method | B-1 | B-2 | B-3 | B-4 | R-L | CIDEr |
|---|---|---|---|---|---|---|
| Upper Bound, 2880 Tokens | ||||||
| Dense | 71.07 | 54.78 | 40.50 | 29.24 | 53.58 | 1.02 |
| Retain 960 Tokens | ||||||
| DivPrune | 72.51 | 54.97 | 40.00 | 28.46 | 53.79 | 0.99 |
| Ours | 73.27 | 56.63 | 42.03 | 30.41 | 54.67 | 1.04 |
| Retain 720 Tokens | ||||||
| DivPrune | 72.35 | 54.81 | 39.88 | 28.37 | 53.61 | 0.99 |
| Ours | 72.87 | 56.34 | 41.77 | 30.23 | 54.47 | 1.04 |
| Retain 540 Tokens | ||||||
| DivPrune | 71.72 | 54.16 | 39.21 | 27.75 | 53.28 | 0.98 |
| Ours | 72.34 | 55.55 | 40.92 | 29.47 | 53.75 | 1.03 |
| Retain 480 Tokens | ||||||
| DivPrune | 71.28 | 53.72 | 38.88 | 27.47 | 53.13 | 0.97 |
| Ours | 72.44 | 55.49 | 40.74 | 29.21 | 53.80 | 1.01 |
| Method | MMB | MME | VQATEXT |
|---|---|---|---|
| Dense | 78.26 | 1894 | 65 |
| VisionZip | 74.26 | 1702.97 | 57.18 |
| DivPrune | 73.96 | 1699.03 | 58.29 |
| Ours | 74.90 | 1706.74 | 58.43 |
| Metric | ChartQA | COCO | MMB | MME | MMU | NoCaps |
|---|---|---|---|---|---|---|
| MI | 16.38 | 1.02 | 61.38 | 1362.88 | 36.12 | 0.98 |
| 16.36 | 1.02 | 61.34 | 1359.12 | 36.11 | 0.98 | |
| cos | 16.26 | 1.01 | 61.15 | 1357.05 | 35.83 | 0.97 |
| Metric | ChartQA | COCO | MMB | MME | MMU | NoCaps |
|---|---|---|---|---|---|---|
| 16.32 | 1.0 | 61.26 | 1356.91 | 36.02 | 0.98 | |
| cos | 16.36 | 1.02 | 61.34 | 1359.12 | 36.11 | 0.98 |
| ChartQA | COCO | MMB | MME | MMU | NoCaps | |
|---|---|---|---|---|---|---|
| 16.48 | 1.02 | 60.99 | 1332.41 | 36.11 | 0.97 | |
| 16.36 | 1.02 | 61.34 | 1359.12 | 36.11 | 0.98 | |
| 16.28 | 1.02 | 61.08 | 1334.68 | 36.11 | 0.97 | |
| 16.00 | 1.02 | 61.43 | 1347.34 | 35.78 | 0.97 |
Peer Reviews
No public reviews on file for this paper yet. If you reviewed it on a platform where reviews are public (OpenReview, ICLR, NeurIPS, ICML), you can paste yours below so the community can read it here.
Videos
No videos yet. Explain this paper in a talk, walkthrough, or lecture? Add one.
Taxonomy
TopicsMultimodal Machine Learning Applications · Video Analysis and Summarization · Human Pose and Action Recognition
TrimTokenator: Towards Adaptive Visual Token Pruning for Large Multimodal Models
**Hao Zhang1, Mengsi Lyu111footnotemark: 1, Chenrui He1, Yulong Ao1, Yonghua Lin122footnotemark: 2
1Beijing Academy of Artificial Intelligence (BAAI) ** **These authors contribute equally to this work.**Corresponding author.
Abstract
Large Multimodal Models (LMMs) have achieved significant success across various tasks. These models usually encode visual inputs into dense token sequences, which are then concatenated with textual tokens and jointly processed by a language model. However, the increased token count substantially raises computational and memory costs during inference. Token pruning has emerged as a promising approach to address this issue. Existing token pruning methods often rely on costly calibration or suboptimal importance metrics, leading to redundant retained tokens. In this paper, we analyze the redundancy differences between visual and textual tokens and propose pruning exclusively on visual tokens. Based on this, we propose a visual token pruning strategy that explicitly preserves both cross-modal alignment and intra-modal informational diversity. We introduce a mutual information-based token pruning strategy that removes visual tokens semantically misaligned with textual tokens, effectively preserving the alignment between the visual and textual modalities. To further improve the representational quality of the retained tokens, we additionally prune redundant visual tokens by maximizing the expected pairwise distances in the embedding space, which is solved efficiently with a greedy algorithm. Extensive experiments demonstrate that our method maintains strong performance while reducing tokens by 88.9% on models such as LLaVA-1.5-7B and LLaVA-NEXT-7B, resulting in a 56.7% improvement in inference speed.
TrimTokenator: Towards Adaptive Visual Token Pruning for Large Multimodal Models
Hao Zhang1††thanks: These authors contribute equally to this work., Mengsi Lyu111footnotemark: 1, Chenrui He1, Yulong Ao1††thanks: Corresponding author., Yonghua Lin122footnotemark: 2
1Beijing Academy of Artificial Intelligence (BAAI)
1 Introduction
Large Multimodal Models (LMMs) Bai et al. (2025); Team et al. (2025); Zhu et al. (2025); Liu et al. (2024a); Lin et al. (2023) have substantially enhanced the reasoning capabilities of Large Language Models (LLMs) Brown et al. (2020); Touvron et al. (2023); Chiang et al. (2023); Zhu et al. (2023); Li et al. (2023a); Zhang et al. (2023); Huang et al. (2023); Wang et al. (2023) by enabling joint processing of multimodal inputs such as images and texts. Typically, visual inputs are encoded into dense token sequences via a vision encoder and concatenated with textual tokens for unified processing by the language model. However, the resulting token sequences often reach thousands in length, leading to significant computational and memory overhead due to the quadratic complexity of self-attention with respect to sequence length Vaswani et al. (2017); Face (2024); Chen et al. (2023); Keles et al. (2023); Liu et al. (2022). These limitations present major obstacles to deploying LMMs in resource-constrained or latency-sensitive environments Chen et al. (2024a); Lin et al. (2025a).
Recent studies have shown that visual token representations in LMMs exhibit substantial redundancy Liu et al. (2024c); Shang et al. (2024a); Huang et al. (2024); Tong et al. (2025); Li et al. (2025a). Leveraging this insight, visual token pruning methods have been proposed to reduce computational cost by selectively removing unnecessary tokens. By eliminating redundant visual tokens, these approaches effectively alleviate the quadratic burden of long input sequences. Notably, prior work demonstrates that pruning the majority of visual tokens can yield significant efficiency gains with minimal performance degradation Zhang et al. (2024a); Chen et al. (2024a); Lin et al. (2025a); Huang et al. (2024); Sun et al. .
While token pruning is beneficial, its application to LMMs remains challenging. Existing token pruning methods can be broadly categorized into three types. 1) A common approach is to use attention scores to identify redundant tokens Chen et al. (2024b); Lin et al. (2025b); Shang et al. (2024b); Tong et al. (2025). However, such methods are susceptible to positional bias and often retain spatially adjacent tokens with high similarity, leading to redundancy and performance degradation. 2) Other methods rely on model-specific calibration or fine-tuning Lin et al. (2025b); Li et al. (2025c); Cai et al. (2024), which incurs high computational cost and limits scalability in practical deployment. 3) Another line of work addresses token pruning by maximizing the minimum distance between tokens Alvar et al. (2025). While this strategy encourages token separation, it is sensitive to outliers and may fail to preserve cross-modal alignment, ultimately affecting downstream performance.
In view of these challenges and opportunities, we propose a visual token pruning strategy that explicitly preserves both cross-modal alignment and intra-modal informational diversity. Our analysis begins by examining the inherent redundancy differences between visual and textual tokens through three key perspectives: attention mechanisms, semantic distribution, and information repetition. These analyses reveal that visual tokens exhibit significantly higher redundancy compared to their textual counterparts. Consequently, we choose to prune only visual tokens while retaining all textual tokens. To preserve cross-modal alignment during pruning, we estimate the mutual information between visual and textual token embeddings. Visual tokens with higher expected mutual information with textual tokens are more likely to exhibit semantic alignment with the textual modality and are therefore retained, while those with lower mutual information are pruned as misaligned. Additionally, we retain visual tokens by maximizing their expected pairwise distances in the embedding space, thereby promoting intra-modal information diversity and encouraging rich, non-overlapping visual semantic representations. To address this problem efficiently, we employ a greedy algorithm that iteratively selects tokens exhibiting maximal dissimilarity. Extensive experiments demonstrate that our method maintains strong performance while reducing tokens by 88.9% on models such as LLaVA-1.5-7B and LLaVA-NEXT-7B, resulting in a 56.7% improvement in inference speed. In summary, our contributions can be summarized as follows:
- •
We analyze the redundancy differences between visual and textual tokens and propose pruning exclusively on visual tokens. Based on this, we design a visual token pruning method that explicitly preserves cross-modal alignment and intra-modal information diversity, improving inference efficiency while maintaining semantic integrity.
- •
We introduce a mutual information based pruning strategy that retains semantically aligned visual tokens with textual tokens while removing misaligned ones, effectively preserving the alignment between visual and textual modalities.
- •
We propose an information diversity driven pruning strategy that maximizes the expected pairwise distances among visual tokens in the embedding space, effectively reducing redundancy and enhancing intra modal information richness, which is solved efficiently with a greedy algorithm.
2 Related Work
2.1 Large Multimodal Models (LMMs)
Large Multimodal Models (LMMs) extend pretrained LLMs by integrating multiple modalities Bai et al. (2025); Team et al. (2025), such as images and texts. Typically, a vision encoder extracts dense visual features, which are projected into the language model’s embedding space via modules like Q-Former Chebotar et al. (2023) or MLPs Taud and Mas (2017). Conventional methods resize high-resolution images to a fixed scale Koonce (2021), causing geometric distortions and loss of fine-grained spatial details. Dynamic tiling mitigates this by splitting images into smaller regions, each independently encoded by a shared encoder, better preserving local information Yuan et al. (2021); Yin et al. (2022). However, this increases the number of visual tokens and computational cost, a challenge further amplified in video LMMs due to multi-frame processing Liu et al. (2024c). These challenges highlight the need for efficient inference methods to enable LMMs deployment under resource constraints Tong et al. (2025).
2.2 Visual Token Pruning
Visual Token Pruning aims to reduce computational overhead and improve inference efficiency by removing redundant or less informative visual tokens. A common strategy is to leverage attention scores to identify tokens for removal. For example, PruMerge Shang et al. (2024b) clusters and merges tokens in the vision encoder based on attention sparsity, while FastV Chen et al. (2024a) utilizes attention weights from the second layer of the LLM to guide pruning. SparseVLM Zhang et al. (2024b) employs cross-modal attention for text-conditioned token selection, and VisionZip Yang et al. (2025) compresses visual inputs via CLS token attention in the final vision encoder layer. FlowCut Tong et al. (2025) identifies redundancy from an information flow perspective by analyzing attention propagation. LVPruning Sun et al. (2025) uses cross-attention to assess vision token importance via interaction with language tokens, guiding token pruning. Other methods adopt calibration-based strategies, where pruning ratios and depths are determined by evaluating model behavior on a held-out set. FitPrune Ye et al. (2025) compares attention distributions before and after pruning to inform token selection, while VTW Lin et al. (2025a) shows that tokens can be safely dropped after specific layers, guided by calibration. In addition, approaches like DivPrune Alvar et al. (2025) addresses token pruning by maximizing the minimum distance between tokens. Moreover, a concurrent work Zhang et al. (2025) reformulates the token pruning problem using determinantal point processes to achieve effective pruning.
3 Token Redundancy Across Modalities
Previous studies Shang et al. (2024a); Alvar et al. (2025); Li et al. (2025a) primarily decide to prune visual tokens based on the discrepancy in the number of visual and textual tokens. However, these works do not thoroughly analyze the differences in redundancy across modalities. In this work, we provide a more detailed pruning guidance by examining the redundancy of visual and textual tokens from three perspectives: attention mechanisms, semantic distribution and information repetition. Our findings reveal that visual tokens exhibit substantially higher redundancy than textual tokens. Motivated by this observation, we retain all textual tokens during the pruning process and apply pruning exclusively to visual tokens. The detailed analysis can be found in Appendix A.
4 Methodology
4.1 Problem Formulation
In this section, we propose a visual token pruning strategy that explicitly preserves cross-modal alignment while promoting intra-modal information diversity. Given an input image, we extract a sequence of visual tokens , and embed the accompanying text into a sequence of textual tokens , where .
Our pruning pipeline can be roughly divided into two stages. In the first stage, we select a subset with size , where , by retaining tokens with the highest semantic alignment to the text modality, thereby ensuring the preservation of tokens with strong cross-modal correlations. In the second stage, we further prune to obtain a more compact subset with size , where , by maximizing the expected pairwise distance in the embedding space. This promotes non-redundant and information-rich representations while reducing computational overhead. We provide the experimental analysis of the stage order and the used metrics in Section 5.5 and Appendix D. Figure 1 illustrates the overview of our method.
4.2 Cross-Modal Alignment Aware Token Filtering
During training, multimodal models primarily optimize cross-entropy loss for text generation, which often leads to an implicit weakening of cross-modal alignment Covert et al. (2024). Pruning as a post-processing step for the model is crucial for cross-modal alignment. To preserve cross-modal alignment during visual token pruning, we introduce a mutual information based criterion that selects a subset of visual tokens which maximizes the expected mutual information with the textual tokens. Our selection objective can be formulated as follows:
[TABLE]
Here, serves as a temporary variable. denotes the average mutual information between the textual token and all visual tokens in the subset . Furthermore, we define the alignment score of each visual token based on its mutual information with the textual token set as follows:
[TABLE]
This score reflect the average semantic alignment strength of visual tokens within the shared embedding space. Intuitively, tokens with higher alignment scores are retained, while those with lower semantic alignment are pruned.
Although mutual information provides a theoretically grounded measure of cross-modal alignment, its precise estimation in high dimensional spaces often requires costly density modeling. We approximate mutual information using the norm, which reduces computational overhead without compromising performance. It is worth noting that our approximation is grounded in mathematical theory and does not rely on any specific model architecture. ** Additionally, we provide theoretical justification and experimental analysis to explain why the norm can be used for approximation (see Appendix B and D).** Therefore, we can compute using the following formula:
[TABLE]
We then construct the set by selecting the visual tokens with the highest alignment scores, which can be represented as follows:
[TABLE]
This selection effectively filters out semantically misaligned visual tokens while retaining those with the strongest cross-modal correlations, thereby enhancing alignment quality and reducing computational overhead. Even for semantically sparse queries (e.g., image captioning on the COCO dataset), our method consistently achieves strong performance.
Superiority over Other Works
Some works prune visual tokens based on their attention scores with textual tokens. However, these approaches are susceptible to positional bias, often retaining spatially adjacent tokens that are highly redundant. Although both our method and these approaches leverage interactions between text and vision, our method emphasizes alignment in the semantic space rather than relying on positional correlations. Moreover, we do not rely on an additional CLIP model to remap the embeddings, as this would alter the vector space and introduce extra computational overhead. We provide a detailed comparison under different metrics in Appendix D, where the results show that the norm achieves better performance compared to other measures.
4.3 Greedy Intra-Modal Representational Maximization (RepMax)
After obtaining the visual token set , we select a refined subset by explicitly maximizing intra-modal information diversity. The core idea is to retain a set of visual tokens that are semantically diverse and non-redundant. To achieve this, we maximize the expected pairwise distance among the selected tokens. Specifically, we define the distance between two visual tokens and using cosine dissimilarity. Based on this, we formulate the objective for subset selection as follows:
[TABLE]
[TABLE]
This objective encourages the model to retain visual tokens that capture complementary aspects of the input, thereby enhancing the representational richness of the pruned token set. To address the problem, we introduce a binary selection vector . The objective can be expressed as follows:
[TABLE]
The above problem is a combinatorial optimization task, which is known to be NP Hard. To address this, we adopt an efficient greedy algorithm for approximate optimization. The core idea is to iteratively select the next visual token that is farthest from the current selected subset in the embedding space, thereby progressively enhancing overall information diversity. Our experimental results further validate the effectiveness of the greedy algorithm.
At the initial stage of the greedy algorithm, we quantify pairwise relationships among visual tokens by constructing a cosine similarity matrix . Each element of the matrix represents the similarity between tokens and . Based on this matrix, we compute the average similarity of each token with all others. The token with the lowest average similarity is chosen as the initial seed to initialize the selected set for the first iteration (), and the remaining tokens constitute the initial remaining set (). This can be formulated as follows:
[TABLE]
[TABLE]
[TABLE]
[TABLE]
where denotes the average similarity between token and the other visual tokens. The index corresponds to the initial token selected as the least similar on average to all others, and denotes the set of indexs from 1 to . To enable efficient incremental computation, we maintain a similarity accumulation vector , where each element denotes the average similarity between token and all tokens in the selected set. The initial similarity accumulation vector is given by the similarity between the token indexed by and all other tokens, which can be represented as follows:
[TABLE]
where denotes the row vector in the matrix corresponding to the index .
At each iteration , we compute the average similarity between each remaining token and all tokens in the current selected set. The remaining token with the lowest average similarity is selected in this iteration, and its index is used to update both the selected and remaining sets. Meanwhile, the total similarity accumulation vector is incrementally updated to incorporate the newly selected token. This process is formalized as follows:
[TABLE]
[TABLE]
[TABLE]
[TABLE]
Here, and denote the selected and remaining sets after the -th iteration, respectively. represents the average similarity between the token in the remaining set and all tokens in the selected set at iteration . The index corresponds to the token selected during the -th iteration, and denotes the row vector in the matrix corresponding to the index . The similarity accumulation vector is updated using the similarity vector of the newly selected token.
This process is repeated times until tokens have been selected. The resulting set forms a maximally dispersed subset of visual tokens with minimal internal redundancy.
Superiority over Other Works
We compare our method with DivPrune, which performs pruning by maximizing the minimum distance. In our experiments, we observe that outliers in the token embeddings can significantly affect DivPrune, preventing it from achieving optimal performance. In contrast, our method optimizes the expected pairwise distance, which effectively mitigates the influence of outliers, and employs a designed greedy algorithm to efficiently tackle the associated NP hard problem. The results of our comparative experiments demonstrate a substantial performance improvement over DivPrune. Furthermore, our method maintains strong performance when compared to an extended variant (DivPrune*∗*) implemented by our method (see Section 5.4).
5 Experiments
5.1 Experimental Setup
**Models and Baselines. ** We evaluate the performance of our method across several representative LMMs, including LLaVA-1.5-7B Liu et al. (2023), LLaVA-1.5-13B Liu et al. (2023), LLaVA-NEXT-7B Liu et al. (2024b), LLaVA-NEXT-Video-7B Zhang et al. (2024c) and Qwen2-VL-7B Wang et al. (2024). These models span a range of parameter scales and encompass both image and video understanding tasks. We evaluate our method alongside several widely adopted baselines, including ToMe Bolya et al. (2023), FastV Chen et al. (2024a), SparseVLM (SpVLM) Zhang et al. (2024b), PDrop Xing et al. (2024), VisionZip Yang et al. (2025) and DivPrune Alvar et al. (2025). We additionally include the VTW Lin et al. (2025b) method in our efficiency evaluation. All baselines are assessed under consistent experimental settings.
**Datasets and Metrics. **We evaluate our method on diverse multimodal benchmarks covering various tasks. For ChartQA Masry et al. (2022), we report the relaxed score. Image captioning quality and diversity are measured by CIDEr on COCO Sharma et al. (2018) and NoCaps Agrawal et al. (2019). MMBenchEN (MMB) Liu et al. (2024d) uses a GPT-based score. Perceptual understanding is assessed via the perception score on MME Fu et al. (2023). Accuracy evaluates general reasoning on MMU Zheng et al. (2025) and text recognition on OCRBench Liu et al. (2024e). Exact match accuracy measures question answering on VQAOK Marino et al. (2019) and VQATEXT Singh et al. (2019). POPE Li et al. (2023b) is evaluated with precision for positional understanding. This comprehensive protocol ensures thorough assessment of generalization across multimodal tasks.
**Implementation Details. **Our experiments are conducted using the PyTorch framework Paszke et al. (2019) and the Hugging Face Transformers library Wolf et al. (2020). We utilize an NVIDIA H100 GPU with 80GB of memory. We set the parameter by default. In both the ablation study and case study, we fix the final number of retained tokens to 64. The temperature, prompt and preprocessing in our experiments all follow the default settings of LMMs-Eval.
5.2 Main Results
We conduct a comprehensive evaluation of our visual token pruning approach against several baselines. As shown in Table 1, our method consistently outperforms prior works across a range of token retention ratios on LLaVA-1.5-7B. At a moderate retention of 192 tokens, our approach achieves an MME perception score of 1467.30, with only a 2.7% drop relative to the dense model, compared to 13.7% and 16.2% drops for FastV and ToMe, respectively. Compared with the strongest baseline, DivPrune, our method improves MMB accuracy from 62.28 to 63.75, a relative gain of 2.4%. To further assess the scalability of our approach on larger models, we extend our evaluation to LLaVA-1.5-13B and conduct a comparative analysis against VisionZip and DivPrune under varying visual token retention settings. As presented in Table 2, our method consistently surpasses others, demonstrating its effectiveness at higher model scale. These results highlight the generalization ability of our pruning strategy in large scale settings.
In addition, we conduct experiments on LLaVA-NEXT-7B using a larger pool of visual tokens across different retention settings. As shown in Table 3, our method consistently achieves the strongest performance across a range of compression levels. Furthermore, our experiments on LLaVA-NEXT-Video-7B and Qwen2-VL-7B also demonstrate the effectiveness of the proposed method (see Appendix C).
5.3 Efficiency Analysis (Accounting for Pruning Overhead)
In this section, we evaluate the inference efficiency of our method on LLaVA-NEXT-7B using the MME dataset. We repeat the process three times and report the average result. For a fair comparison, the number of decoding steps for each method is fixed to the minimum decoding steps required among all methods. As shown in Table 4, we report the average inference time (time to generate the complete output) per sample with a batch size of 1 and 288 visual tokens retained. Compared to the original dense model (15.53 GB, 235.2 ms), all pruning methods significantly reduce memory usage and cut inference latency by more than half. Our method achieves an inference time of 100.13 ms, representing a 57% reduction compared to the dense baseline. When compared with other pruning baselines, our approach achieves lower latency than VTW and FastV. Although our latency is slightly higher than DivPrune, this small gap is negligible given the superior task performance consistently achieved under the same token budget. It is worth noting that pruning is performed during inference; therefore, the reported inference latency includes the overhead introduced by the pruning process. These results demonstrate that our pruning strategy provides substantial improvements in memory and latency efficiency.
5.4 Comparison with our DivPrune variants (DivPrune*∗*)
We further extend the DivPrune approach to enable a more comprehensive comparison. Concretely, we integrate our cross-modal pruning strategy with DivPrune under its default configuration, forming a new variant denoted as DivPrune*. We evaluate this variant on LLaVA-1.5-7B while retaining 64 visual tokens. As shown in Table 5, our method still surpasses DivPrune*. Combined with the earlier results, we also observe that DivPrune* achieves noticeable gains over the original DivPrune, highlighting the crucial role of cross-modal alignment in boosting performance. Moreover, these findings demonstrate that our greedy intra-modal expectation representation maximization strategy is more effective than the minimum distance maximization employed in DivPrune.
5.5 Ablation Study
To further validate the effectiveness of our approach, we conduct ablation studies with three different configurations. swaps the order of the two pruning stages by applying intra-modal representation maximization before cross-modal alignment. removes intra-modal pruning and only retains cross-modal alignment based pruning. eliminates cross-modal alignment pruning and applies only intra-modal representation maximization. As shown in Table 6, the performance consistently drops once any component is removed, indicating the necessity of each part of our framework. Moreover, using only cross-modal pruning or altering the pruning order leads to more severe degradation. We conjecture that this is because text-related visual information is often concentrated in local regions, where tokens align with the text but may carry highly similar semantics. Additional experiments in Section E further demonstrate that with properly chosen pruning parameters for each stage, our method achieves strong performance.
5.6 Additional Results
We conduct a Hyperparameter Analysis, such as varying , and observe consistently strong performance across different settings, demonstrating the robustness of our method (Appendix E). Moreover, we perform a Case Study to show that the pruned model retains its ability to generate high quality content (Appendix F).
6 Conclusion
In this paper, we analyze the redundancy discrepancy between visual and textual tokens in LMMs and propose a pruning strategy that operates exclusively on visual tokens. Our method explicitly preserves cross-modal alignment and intra-modal informational diversity. Specifically, we leverage mutual information to eliminate visual tokens that are semantically misaligned with textual inputs, ensuring the consistency across modalities. To further enhance the representational quality of the retained tokens, we maximize their expected pairwise distances in the embedding space via an efficient greedy algorithm. Extensive experiments across diverse models and benchmarks demonstrate the effectiveness of our approach, alongside significant improvements in memory consumption and inference latency. We plan to extend our approach to more complex or non-visual modalities in future work, further demonstrating its broad applicability.
Limitations
In this work, we conduct extensive experiments to evaluate the effectiveness of our multimodal model token pruning method. The results demonstrate that our approach achieves competitive performance compared to the baselines. However, due to computational constraints, we have not yet been able to evaluate it on larger scale models, such as those with 70 billion parameters. Exploring the scalability of our method to such large models constitutes an important direction for future work.
Appendix A Token Redundancy Across Modalities
Previous studies Shang et al. (2024a); Alvar et al. (2025); Li et al. (2025a) primarily decide to prune visual tokens based on the discrepancy in the number of visual and textual tokens. However, these works do not thoroughly analyze the differences in redundancy across modalities. In this work, we provide a more detailed pruning guidance by examining the redundancy of visual and textual tokens from three perspectives: attention mechanisms, semantic distribution and information repetition. Our findings reveal that visual tokens exhibit substantially higher redundancy than textual tokens. Motivated by this observation, we retain all textual tokens during the pruning process and apply pruning exclusively to visual tokens.
The attention distribution in multimodal models is highly skewed, with textual tokens receiving significantly higher weights than visual tokens Li et al. (2025b); Lee et al. (2025). This suggests that the model primarily relies on text for semantic understanding. Visual inputs often consist of hundreds or thousands of tokens, far exceeding the number of textual tokens. Given the quadratic complexity of attention with respect to token count, this mismatch between quantity and contribution is pronounced. Despite the large number of visual tokens, their impact on the final representation is limited, resulting in poor trade offs between computational cost and semantic gain and reflecting the high redundancy of visual tokens.
Each token in text typically carries explicit semantic meaning, such as a noun, verb, or conjunction, reflecting natural language as a highly optimized discrete encoding system with dense and relatively uniform information distribution Hirschberg and Manning (2015). In contrast, semantic information in images is highly concentrated in a small number of salient regions, such as foreground objects, while the majority of visual tokens correspond to low-semantic areas like sky or walls, which mostly contain low-frequency textures or superficial variations and contribute little to high-level semantic understanding. Consequently, the effective semantic density of visual tokens is significantly lower than that of textual tokens.
Compared to textual tokens, visual tokens exhibit higher information redundancy due to differences in their generation processes and underlying information structures. Textual tokens, derived from natural language, follow Zipf’s law Newman (2005); Adamic and Huberman (2002) and represent distinct semantic units with low repetition. In contrast, visual tokens are typically generated by uniformly partitioning images or extracting low-level features without semantic organization. For example, a sky region is divided into multiple similar patches that cluster in embedding space and jointly represent a single high-level concept, causing redundancy. Visual tokenization resembles physical partitioning rather than frequency-driven semantic abstraction, forcing models to process many similar tokens and resulting in computational and representational inefficiency.
Appendix B Proof of Norm Approximation to Mutual Information
When considering two continuous random variables and , corresponding to two distributions, the mutual information between them is defined as follows:
[TABLE]
To render this quantity tractable, we make the following assumptions:
- •
The conditional distribution is modeled as an isotropic Gaussian. We conduct extensive experiments and find that, during the fitting process, the conditional distribution exhibits per-dimension means and standard deviations concentrated around (-0.0035) and (0.7842), respectively, which substantiates the validity of our hypothesis. Then, we can derive the following expression:
[TABLE]
Here, denotes the identity matrix.
- •
The marginal distribution is generally unknown and intractable; thus, we approximate it as a constant , following common practice in variational inference and contrastive learning.
Based on the above assumptions, we obtain the following expression:
[TABLE]
[TABLE]
Here, is a constant independent of the inputs, and we denote . Therefore, the norm provides a theoretically grounded approximation of mutual information.
Appendix C Additional Comparative Experiments
We evaluate our method on the video based multimodal model LLaVA-NEXT-Video-7B. Using the same pruning strategy as in our image understanding experiments, we conduct evaluations on the COCO dataset and report standard image captioning metrics, including BLEU-1/2/3/4, ROUGE-L and CIDEr. We compare our method against DivPrune, a really strong baseline for visual token pruning. As shown in Table 7, our approach consistently outperforms DivPrune across all evaluation metrics under various token retention settings. For instance, with 960 tokens retained, our method improves the BLEU-4 score from 28.46 to 30.41, representing a relative gain of 6.9%. These results demonstrate the robustness of our method in video scenarios.
To more comprehensively assess the effectiveness of our method, we further perform pruning experiments on Qwen2-VL-7B, pruning 88.9% of tokens. We test our approach against VisionZip and DivPrune across multiple datasets. As illustrated in Table 8, our method achieves superior performance, underscoring its robustness and effectiveness even under extreme pruning scenarios.
Appendix D Metric Analysis
In addition to the theoretical analysis of approximating mutual information (MI) using the norm, we conduct empirical validation on LLaVA-1.5-7B with 64 visual tokens retained. Specifically, we implement cross-modal alignment using three metrics: mutual information, its norm approximation, and cosine similarity. We use scikit-learn Pedregosa et al. (2011) to compute mutual information, where the library employs a nonparametric nearest neighbors approximation method, with set to 3 by default. As shown in Table 9, the method using the norm approximation achieves performance comparable to that of exact mutual information, and consistently outperforms the one using cosine similarity. We guess that this phenomenon occurs because semantic alignment between textual and visual tokens requires not only directional consistency but also a substantial overlap in their feature distributions. We further compare performance under different intra-modal redundancy metrics, namely cosine similarity and the norm. As shown in Table 10, cosine similarity consistently yields better results. This suggests that cosine similarity is generally more effective for measuring redundancy within unimodal data, which is consistent with prior empirical findings in the literature.
Appendix E Hyperparameter Analysis
In this study, we conduct an analysis of the influence of the token retention parameter in the first stage cross-modal token pruning process on the overall performance of our method. As presented in Table 11, we evaluate several representative configurations on LLaVA-1.5-7B, including , , , and , where represents the total number of visual tokens in the dense model. In all cases, the final number of retained tokens is fixed at 64. Our method consistently achieves strong and stable performance across these different settings, indicating that it is largely insensitive to the choice of . These strong results highlight the robustness of our method to different hyperparameter settings.
Appendix F Case Study
To qualitatively assess the effectiveness of our pruning strategy, we conduct a case study using LLaVA-1.5-7B on samples from the COCO dataset. As illustrated in Figure 2, we compare the captions generated by the original dense model and our pruned model, which retains significantly fewer visual tokens. The results show that the pruned model produces captions that remain semantically coherent and fluent, closely aligning with those generated by the dense model. This demonstrates that our method effectively removes redundant visual tokens while preserving caption generation capabilities. Overall, the case study highlights that substantial token reduction can be achieved without compromising output quality, underscoring the practical utility of our approach.
Reproducibility statement
We strive to ensure the reproducibility of our results. Full details are provided in the main paper and the appendix. Our implementation is built on PyTorch and standard open-source libraries. We provide key code implementations to facilitate reproducibility and further research.
The reference list from the paper itself. Each links out to its DOI / PubMed record.
- 1Adamic and Huberman (2002) Lada A Adamic and Bernardo A Huberman. 2002. Zipf’s law and the internet. Glottometrics , 3(1):143–150.
- 2Agrawal et al. (2019) Harsh Agrawal, Karan Desai, Yufei Wang, Xinlei Chen, Rishabh Jain, Mark Johnson, Dhruv Batra, Devi Parikh, Stefan Lee, and Peter Anderson. 2019. Nocaps: Novel object captioning at scale. In Proceedings of the IEEE/CVF international conference on computer vision , pages 8948–8957.
- 3Alvar et al. (2025) Saeed Ranjbar Alvar, Gursimran Singh, Mohammad Akbari, and Yong Zhang. 2025. Divprune: Diversity-based visual token pruning for large multimodal models. ar Xiv preprint ar Xiv:2503.02175 .
- 4Bai et al. (2025) Shuai Bai, Keqin Chen, Xuejing Liu, Jialin Wang, Wenbin Ge, Sibo Song, Kai Dang, Peng Wang, Shijie Wang, Jun Tang, and 1 others. 2025. Qwen 2. 5-vl technical report. ar Xiv preprint ar Xiv:2502.13923 .
- 5Bolya et al. (2023) Daniel Bolya, Cheng-Yang Fu, Xiaoliang Dai, Peizhao Zhang, Christoph Feichtenhofer, and Judy Hoffman. 2023. Token merging: Your vit but faster. In Proceedings of the International Conference on Learning Representations .
- 6Brown et al. (2020) T Brown, B Mann, N Ryder, M Subbiah, JD Kaplan, P Dhariwal, A Neelakantan, P Shyam, G Sastry, A Askell, and 1 others. 2020. Language models are few-shot learners advances in neural information processing systems 33.
- 7Cai et al. (2024) Mu Cai, Jianwei Yang, Jianfeng Gao, and Yong Jae Lee. 2024. Matryoshka multimodal models. In Workshop on Video-Language Models@ Neur IPS 2024 .
- 8Chebotar et al. (2023) Yevgen Chebotar, Quan Vuong, Karol Hausman, Fei Xia, Yao Lu, Alex Irpan, Aviral Kumar, Tianhe Yu, Alexander Herzog, Karl Pertsch, and 1 others. 2023. Q-transformer: Scalable offline reinforcement learning via autoregressive q-functions. In Conference on Robot Learning , pages 3909–3928. PMLR.