A Transformer-based Deep Learning Algorithm to Auto-record Undocumented Clinical One-Lung Ventilation Events
Zhihua Li, Alexander Nagrebetsky, Sylvia Ranjeva, Nan Bi, Dianbo Liu,, Marcos F. Vidal Melo, Timothy Houle, Lijun Yin, Hao Deng

TL;DR
This paper introduces a Transformer-based deep learning model that accurately predicts undocumented one-lung ventilation start and end times from intraoperative data, improving data completeness and clinical decision-making.
Contribution
The study presents a novel Transformer and CNN hybrid model for predicting missing clinical event timings from intraoperative data, enhancing data accuracy in lung surgery.
Findings
Model outperforms baseline methods significantly.
Achieves satisfactory accuracy for clinical application.
Demonstrates effectiveness on multi-hospital datasets.
Abstract
As a team studying the predictors of complications after lung surgery, we have encountered high missingness of data on one-lung ventilation (OLV) start and end times due to high clinical workload and cognitive overload during surgery. Such missing data limit the precision and clinical applicability of our findings. We hypothesized that available intraoperative mechanical ventilation and physiological time-series data combined with other clinical events could be used to accurately predict missing start and end times of OLV. Such a predictive model can recover existing miss-documented records and relieves the documentation burden by deploying it in clinical settings. To this end, we develop a deep learning model to predict the occurrence and timing of OLV based on routinely collected intraoperative data. Our approach combines the variables' spatial and frequency domain features, using…
Click any figure to enlarge with its caption.
 Figure 1427456
 Figure 2
 Figure 3
 Figure 4
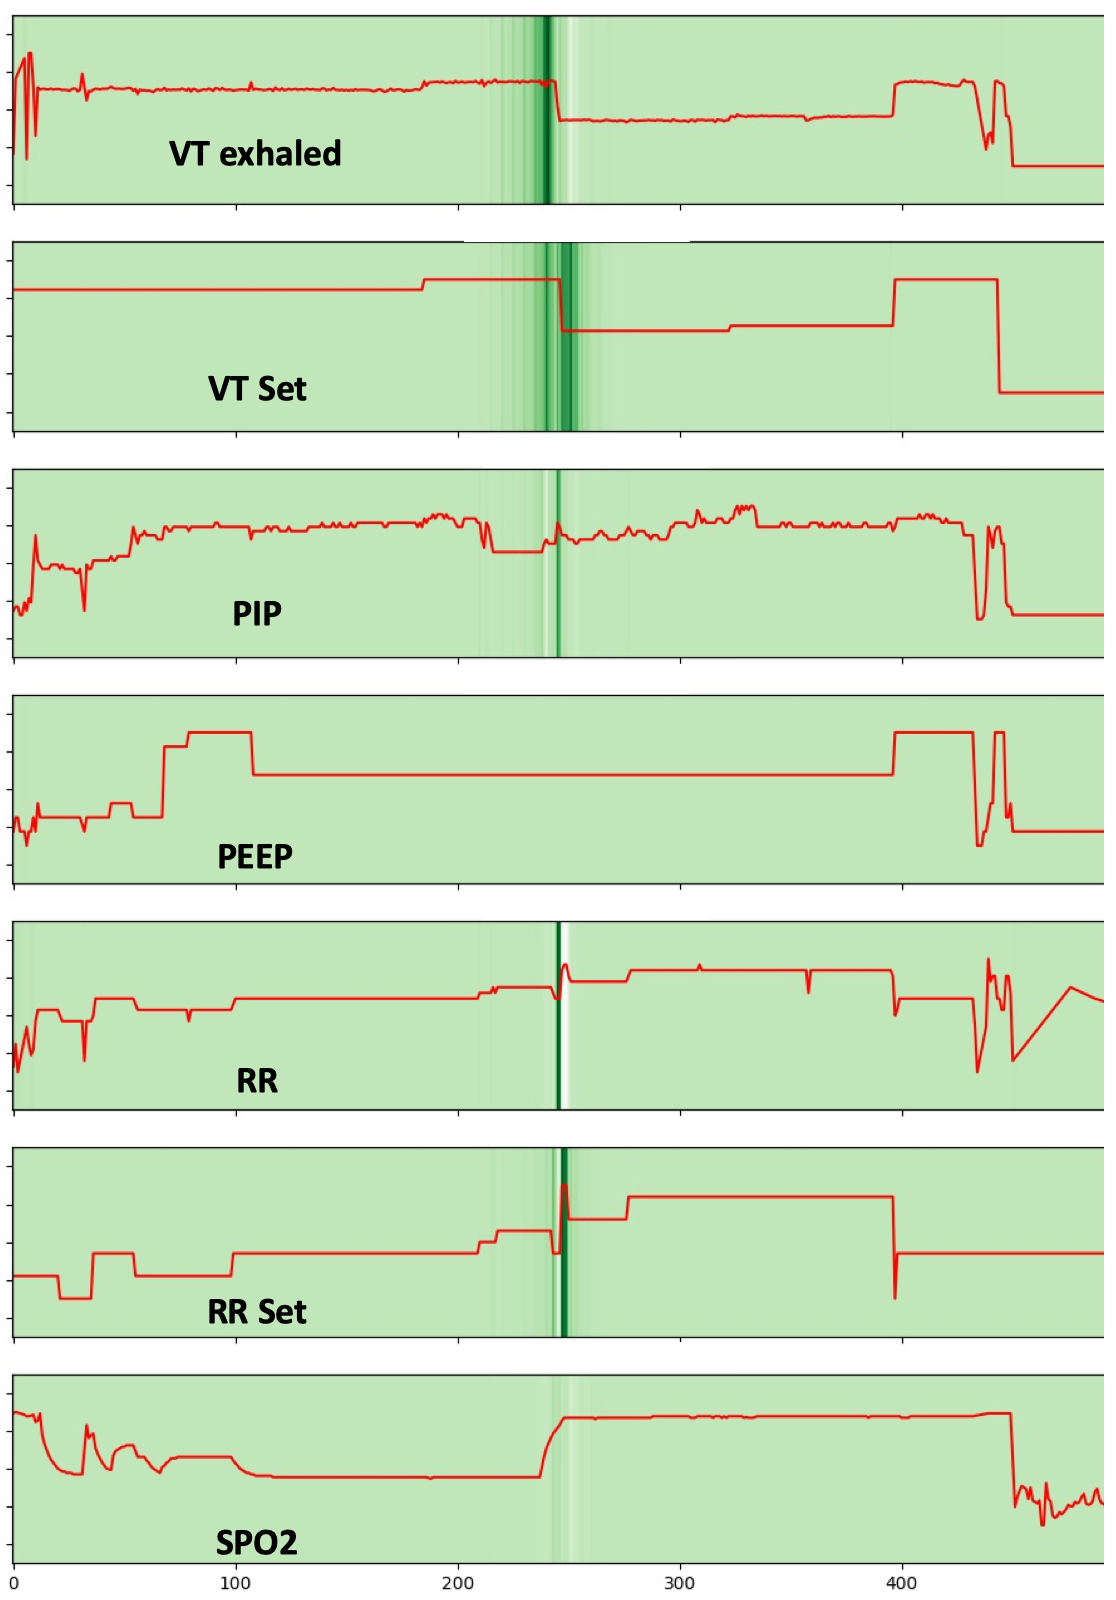 Figure 5
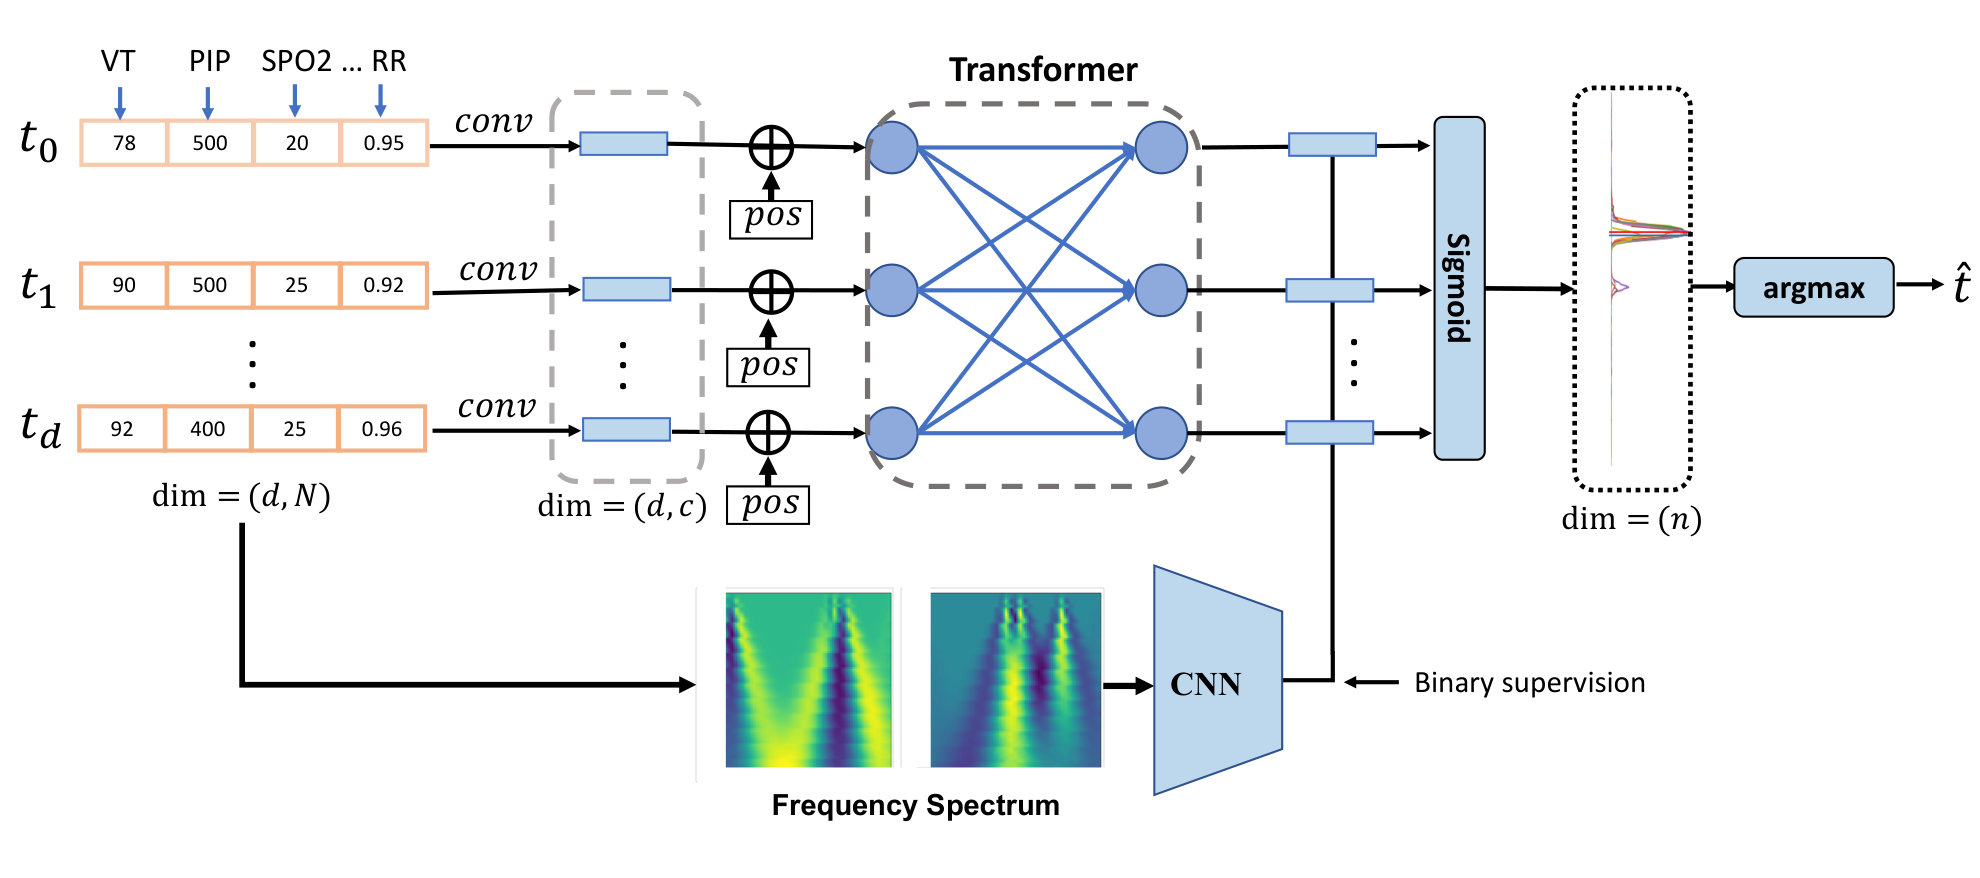 Figure 6
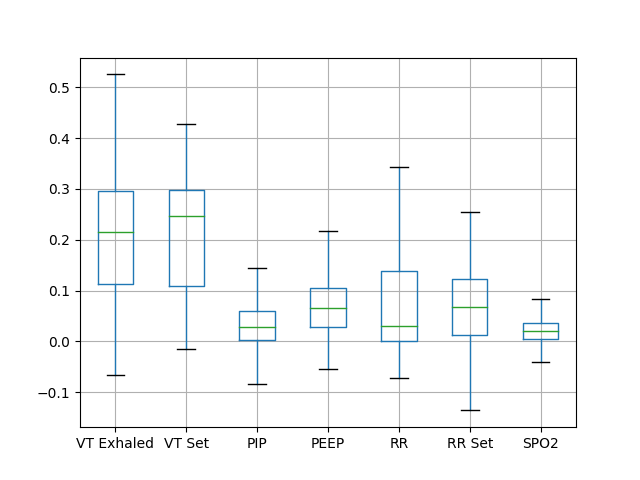 Figure 7
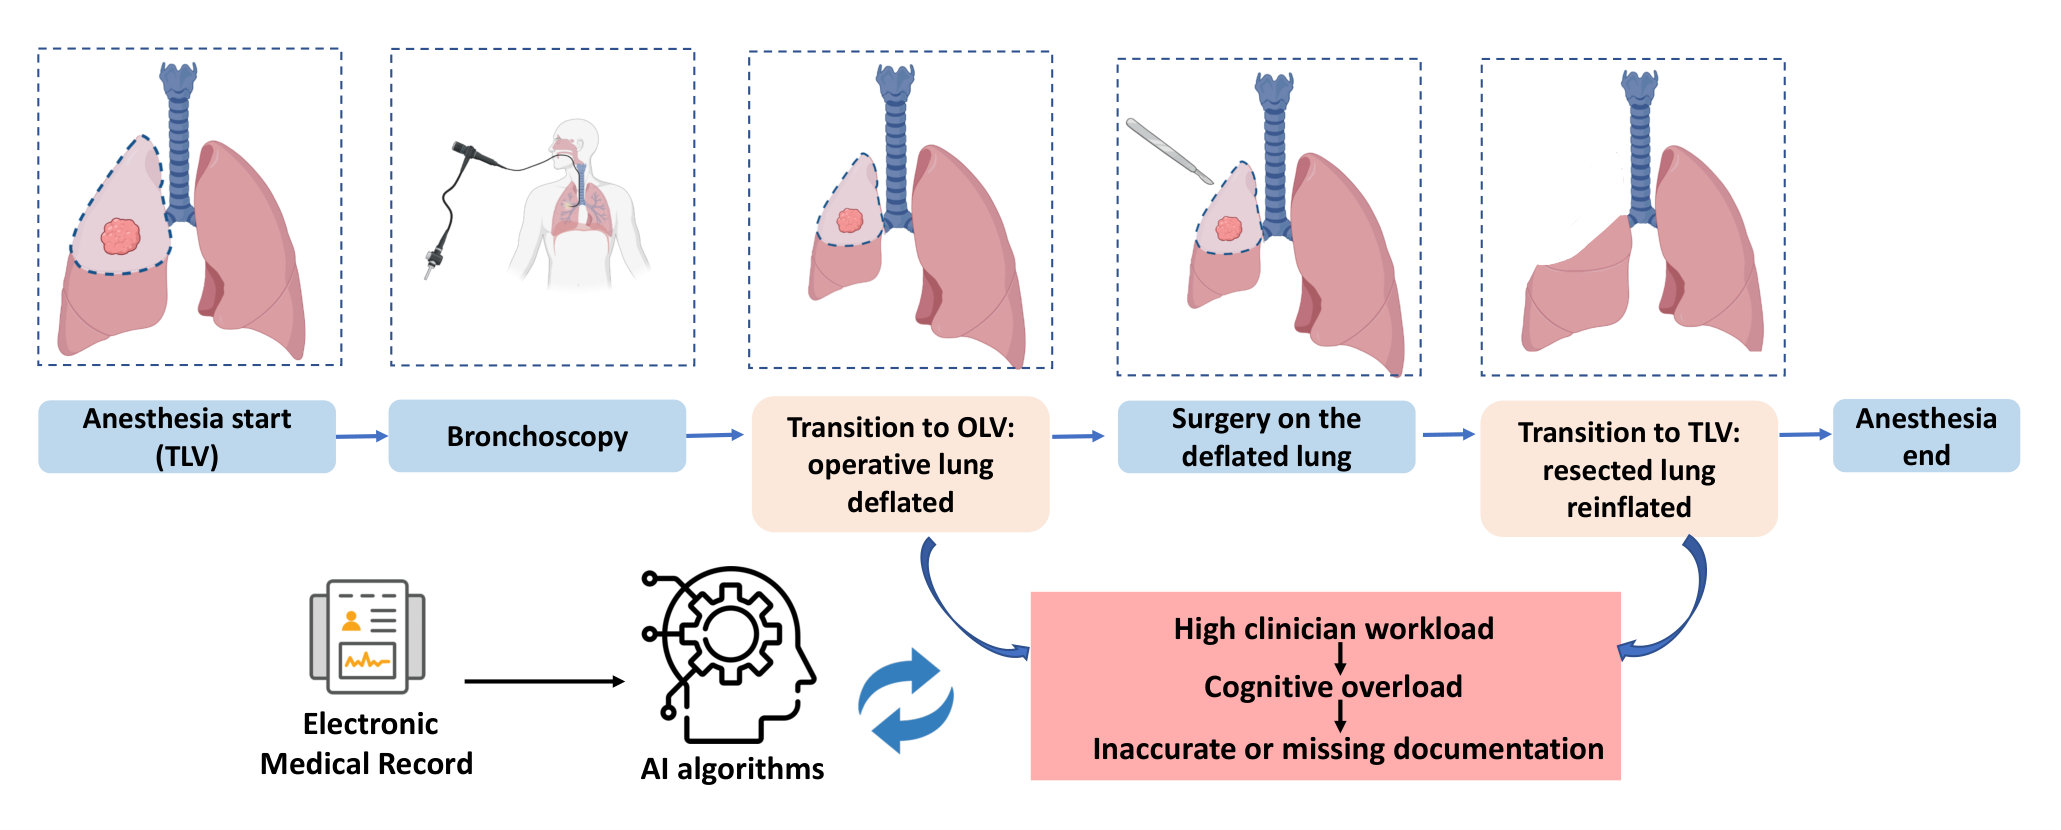 Figure 8
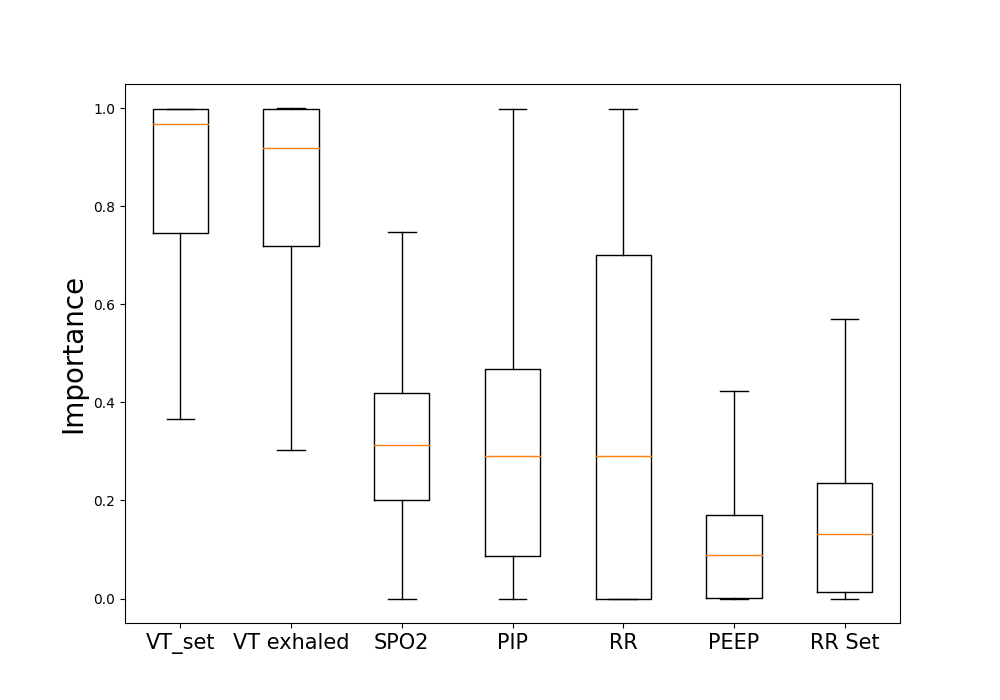 Figure 9
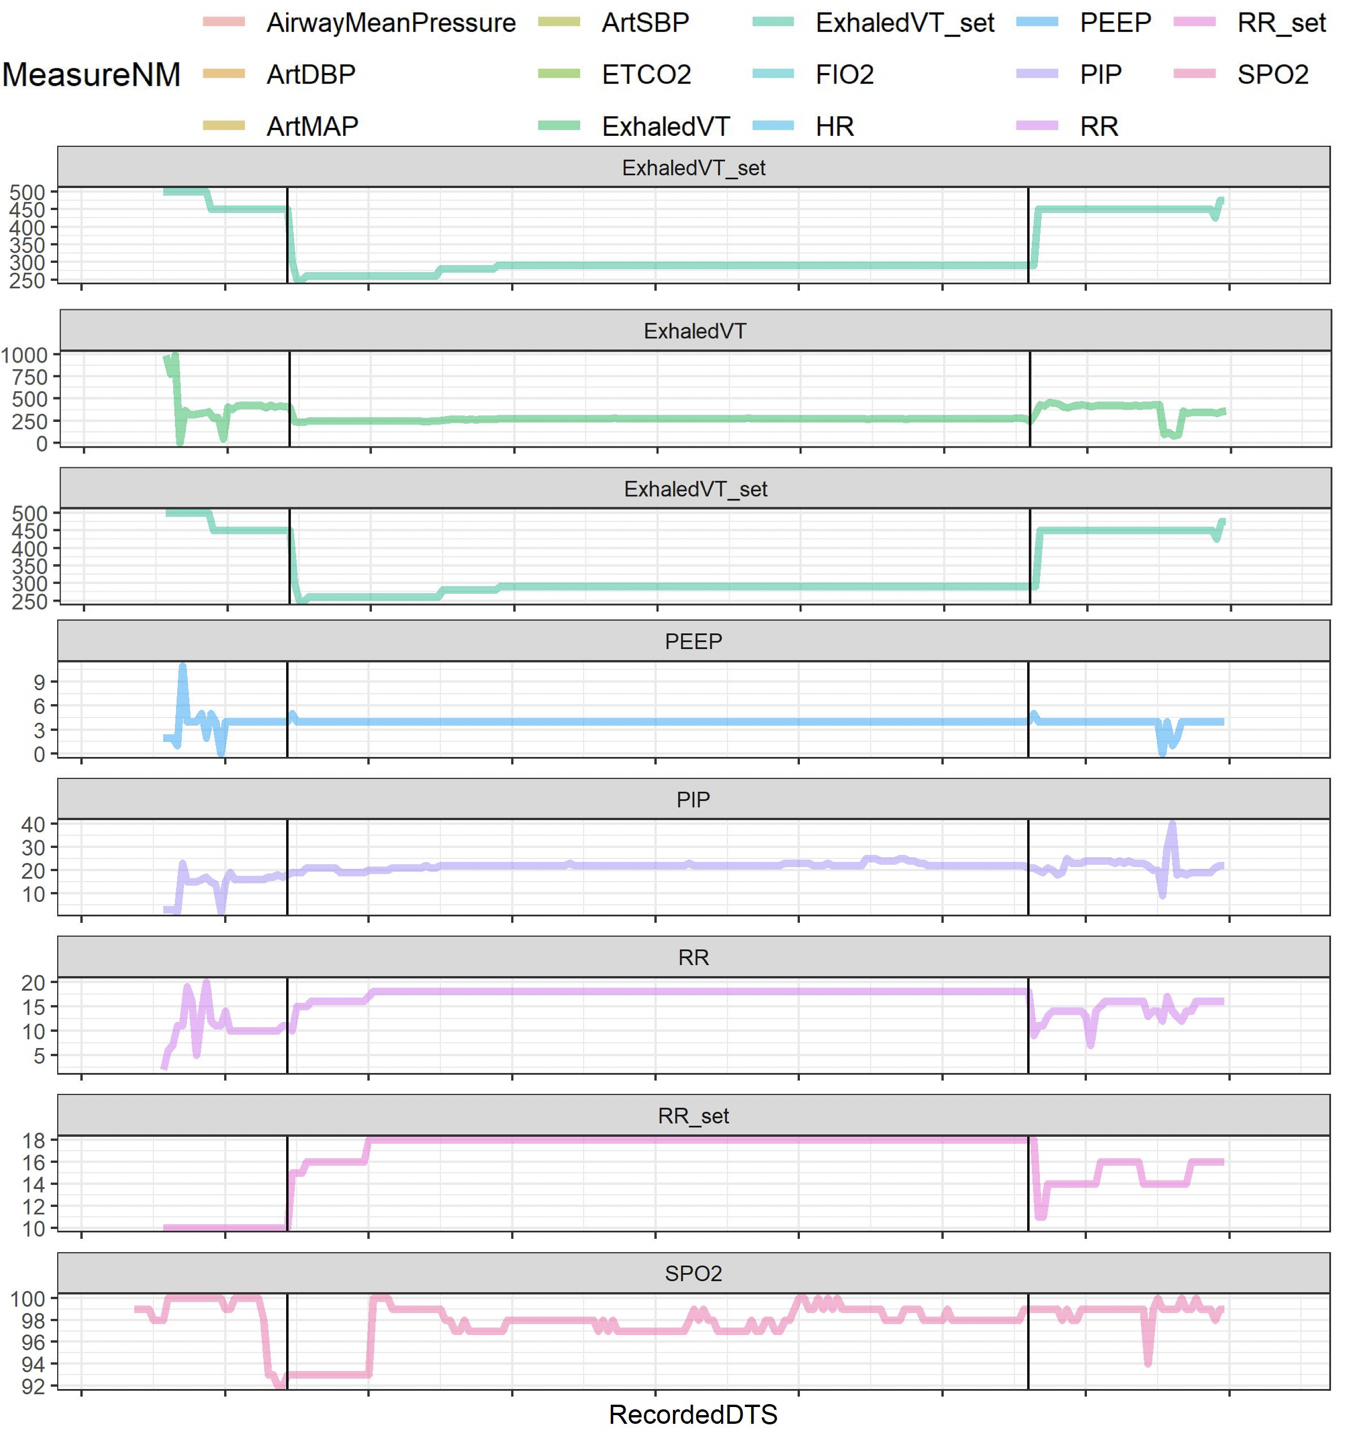 Figure 10
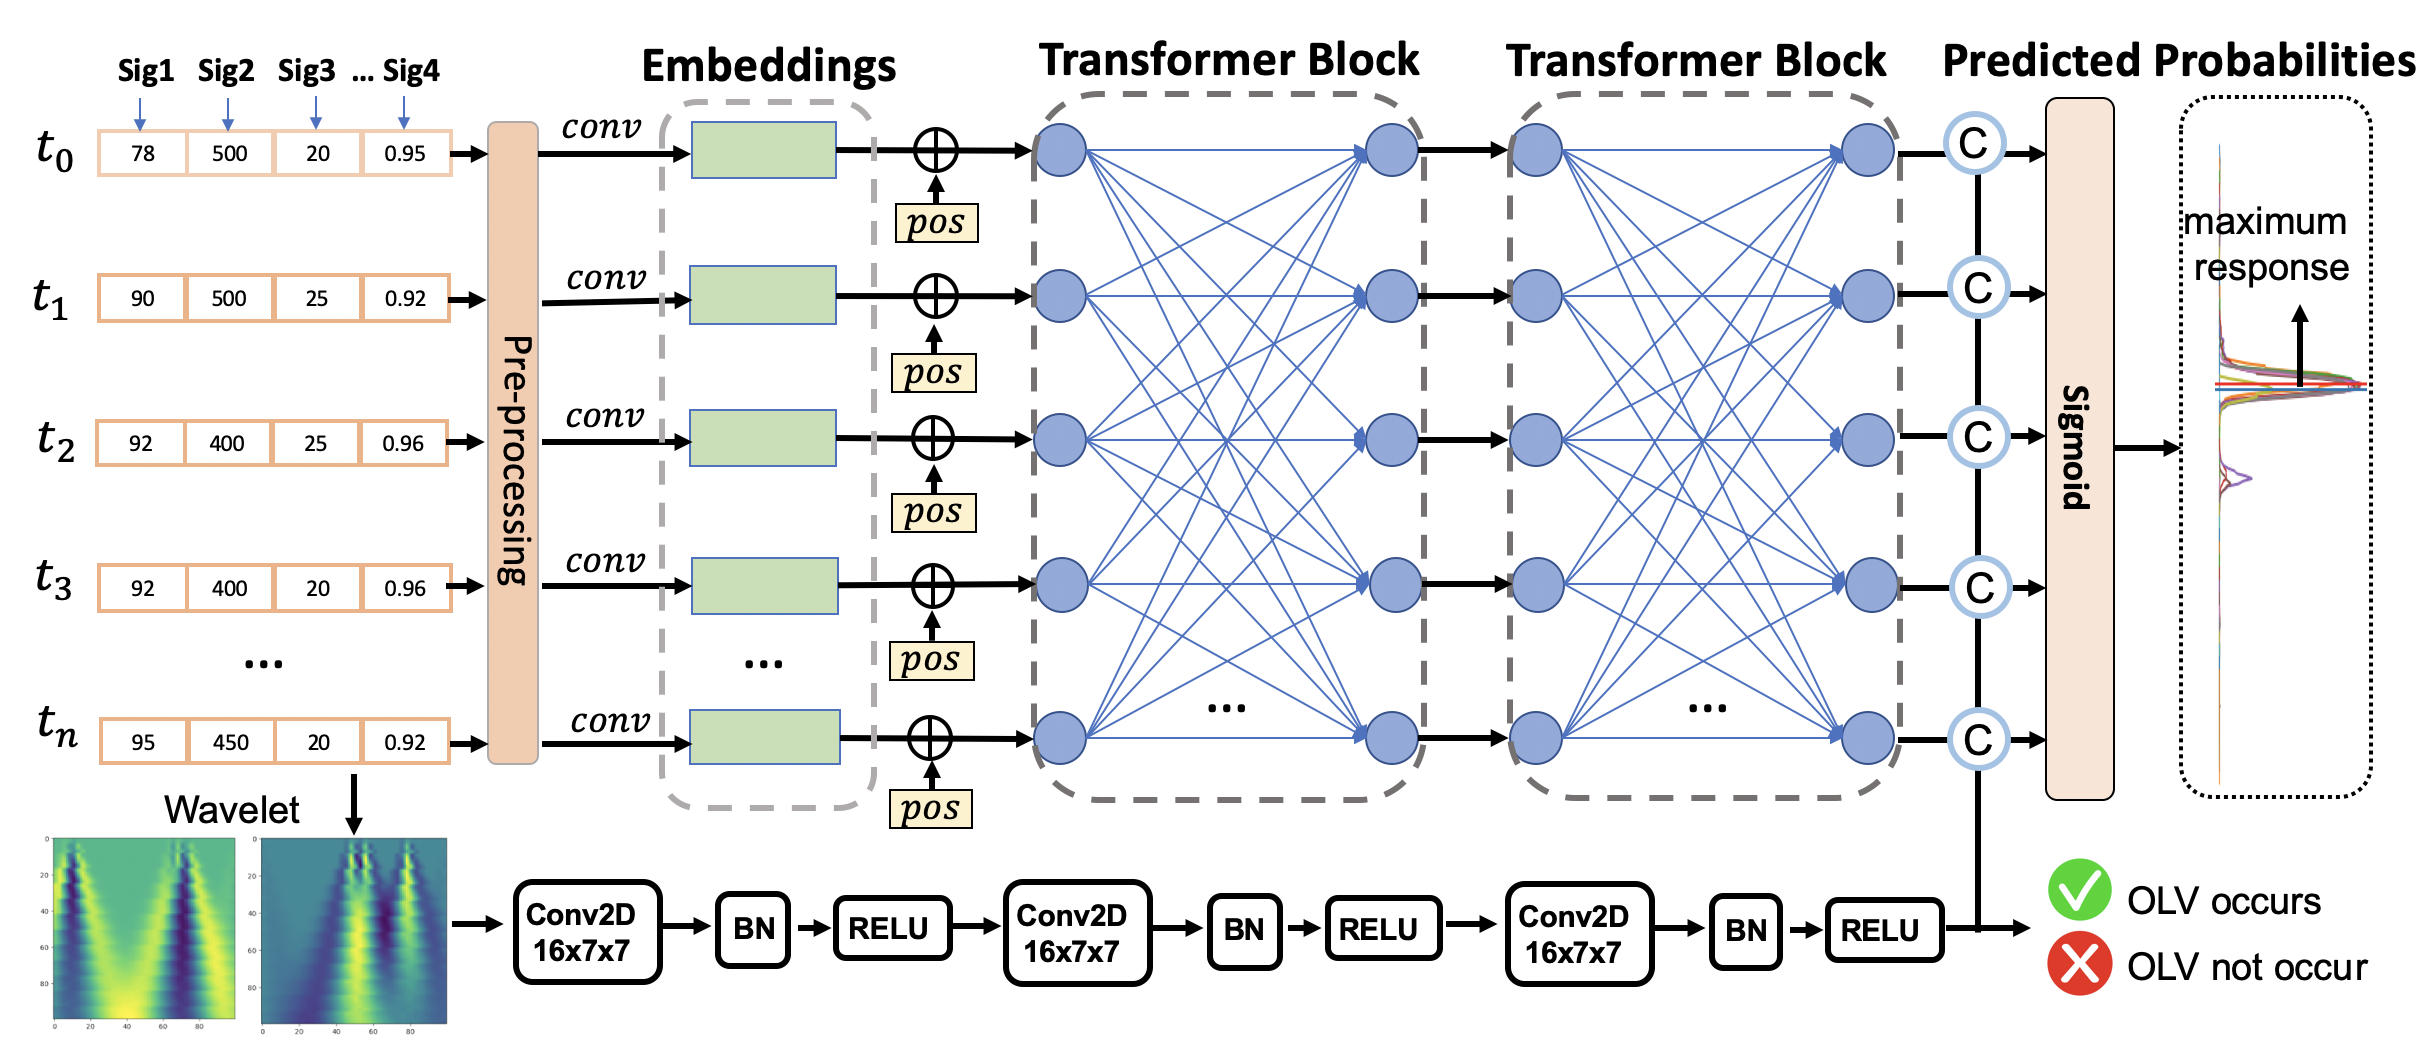 Figure 11
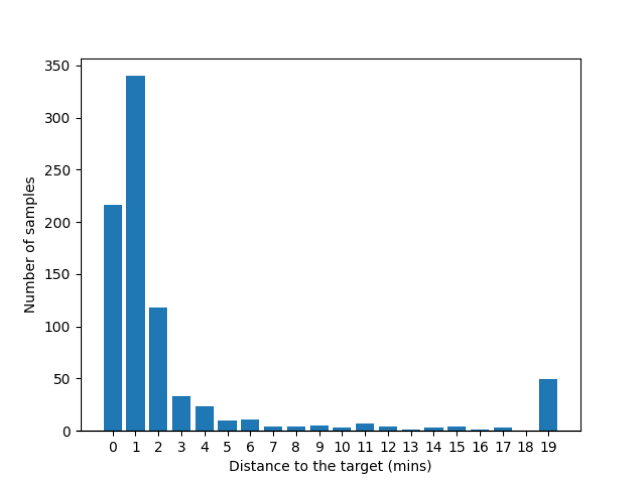 Figure 12
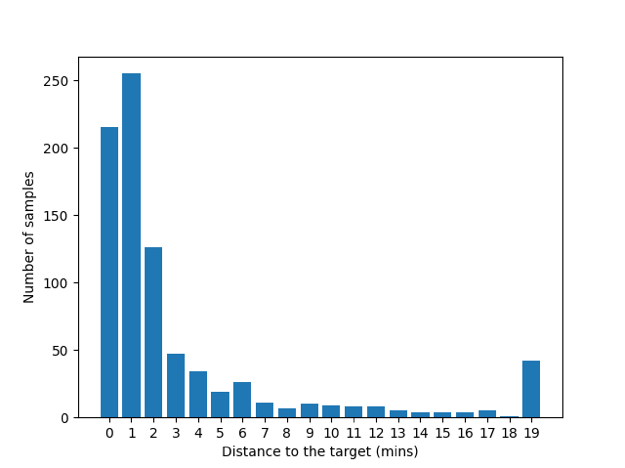 Figure 13
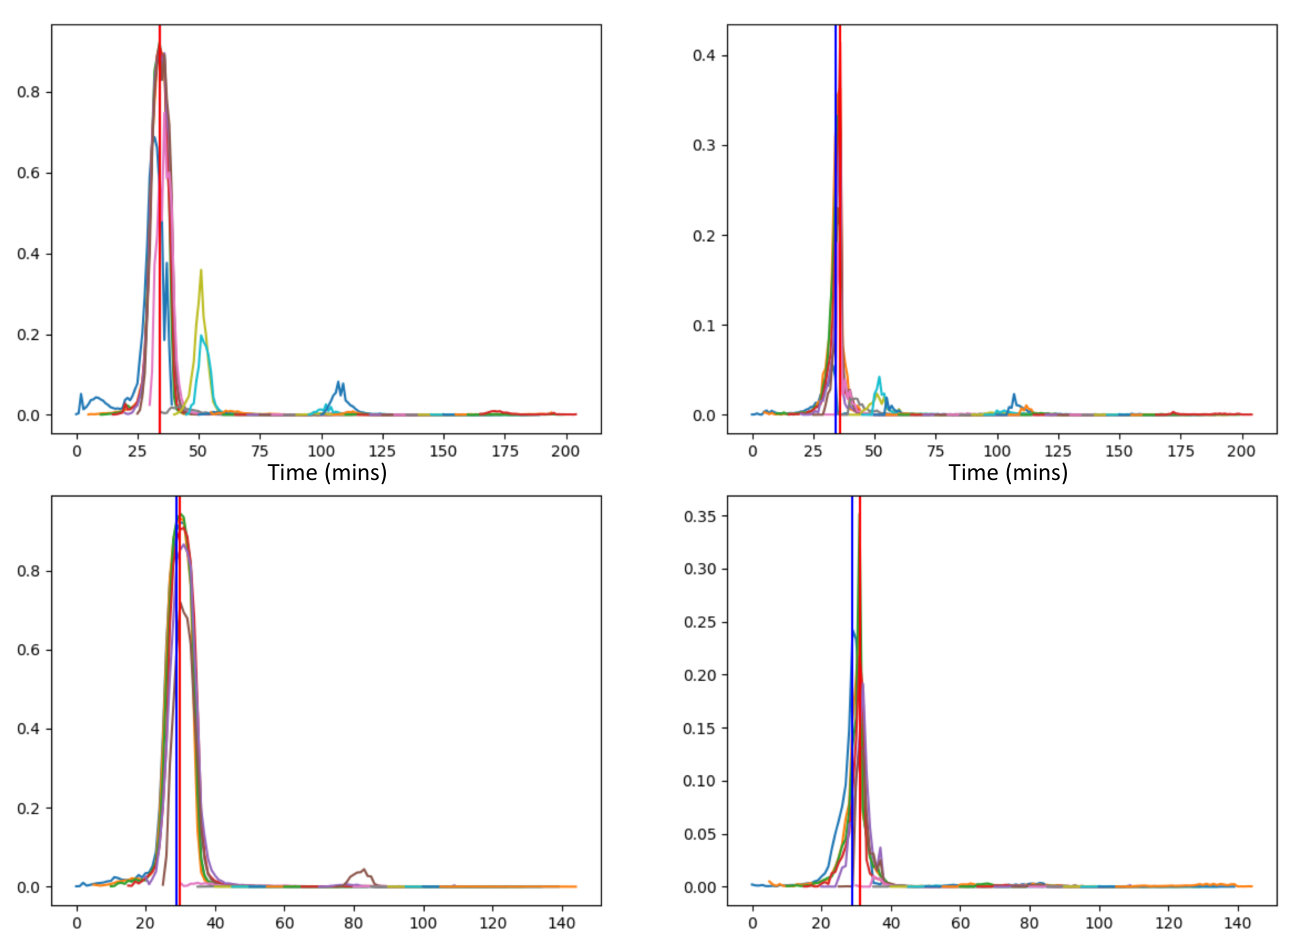 Figure 14
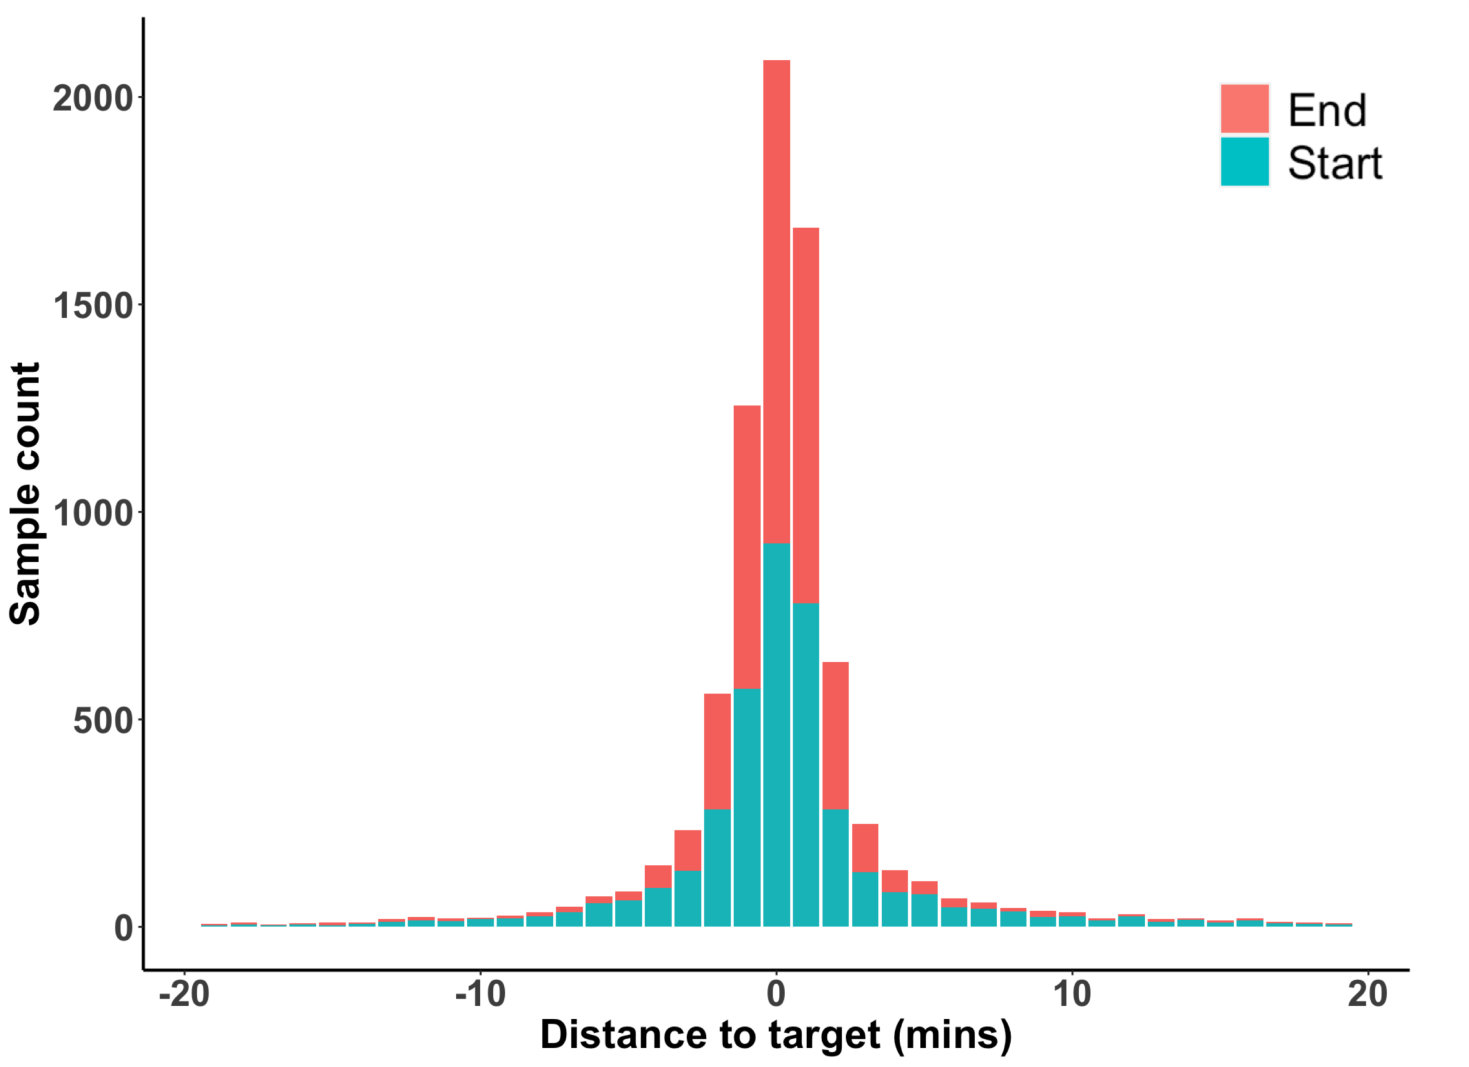 Figure 15
| Ventilator setting variables | Tidal volume (VTset) | a mechanical ventilator setting which determines the volume goal of each ventilator-delivered breath | |
| Respiratory rate (RRset) | a mechanical ventilator setting which determines the number of ventilator-delivered breaths per minute | ||
| Positive end-expiratory pressure (PEEP) |
|
||
| Respiratory physiology variables | Exhaled tidal volume (exhaledVT) | the measured gas volume returning from the patient’s lungs to the mechanical ventilator after each breath | |
| Respiratory rate (RR) |
|
||
| Peak inspiratory pressure (PIP) | maximum pressure in the airway during each breath | ||
| Hemoglobin oxygen saturation (SpO2) |
|
Peer Reviews
No public reviews on file for this paper yet. If you reviewed it on a platform where reviews are public (OpenReview, ICLR, NeurIPS, ICML), you can paste yours below so the community can read it here.
Videos
No videos yet. Explain this paper in a talk, walkthrough, or lecture? Add one.
Taxonomy
TopicsLung Cancer Diagnosis and Treatment · Phonocardiography and Auscultation Techniques · Machine Learning in Healthcare
MethodsMulti-Head Attention · Attention Is All You Need · Linear Layer · Label Smoothing · Absolute Position Encodings · Softmax · Adam · Layer Normalization · Residual Connection · Dense Connections
11institutetext: 11email: [email protected]; [email protected]; [email protected]; [email protected]; [email protected]; [email protected]; [email protected]; [email protected]; [email protected]
A Transformer-based Deep Learning Algorithm to Auto-record Undocumented Clinical One-Lung Ventilation Events
Zhihua Li 1
Alexander Nagrebetsky 2
Sylvia Ranjeva 2
Nan Bi 1
Dianbo Liu 3
Marcos F. Vidal Melo 4
Timothy Houle 2
Lijun Yin 1
Hao Deng 2
1Binghamton University
2Massachusetts General Hospital
3Mila AI Institute
4Columbia University Irving Medical Center
Abstract
As a team studying the predictors of complications after lung surgery, we have encountered high missingness of data on one-lung ventilation (OLV) start and end times due to high clinical workload and cognitive overload during surgery. Such missing data limit the precision and clinical applicability of our findings. We hypothesized that available intraoperative mechanical ventilation and physiological time-series data combined with other clinical events could be used to accurately predict missing start and end times of OLV. Such a predictive model can recover existing miss-documented records and relieves the documentation burden by deploying it in clinical settings. To this end, we develop a deep learning model to predict the occurrence and timing of OLV based on routinely collected intraoperative data. Our approach combines the variables’ spatial and frequency domain features, using Transformer encoders to model the temporal evolution and convolutional neural network to abstract frequency-of-interest from wavelet spectrum images. The performance of the proposed method is evaluated on a benchmark dataset curated from Massachusetts General Hospital (MGH) and Brigham and Women’s Hospital (BWH). Experiments show our approach outperforms baseline methods significantly and produces a satisfactory accuracy for clinical use.
Keywords:
O
ne-lung-ventilation, Transformer, medical records, and deep learning.
1 Introduction
Among two million people diagnosed with lung cancer each year Bray et al. (2018), approximately one-third need lung resection surgery Perera et al. (2021). An operation on the lung requires one-lung ventilation (OLV) to deflate and immobilize the operative lung for surgical visualization. OLV, in turn, presents unique challenges for mechanical ventilation and for prevention of postoperative pulmonary complications Marseu and Slinger (2016). Transition to OLV during thoracic surgery is a distinct risk factor for post-operative acute lung injury, ranging in severity from mild atelectasis to severe acute respiratory distress syndrome (ARDS) Lohser (2008). Strategies for lung-protective management during two-lung ventilation have evolved from studies of ARDS in ICU populations Allison et al. (2015); Neto et al. (2016). These protective ventilation strategies aim to provide sufficient oxygenation while minimizing ventilator-induced alveolar trauma, inflammation, and cyclic collapse Slutsky and Ranieri (2013). While lung-protective strategies for two-lung ventilation are well-described, patients receiving OLV during lung resection, a cohort that is inherently vulnerable to pulmonary complications, suffer from a paucity of clinically meaningful evidence.
The lack of reliable data on the time of transition from two-lung ventilation to OLV is a limiting factor that complicates research into the pathophysiology and prevention of pulmonary complications after lung surgery. The transition from two- to one-lung ventilation is a time of heightened risk for respiratory decompensation, and is thus a time of high cognitive and procedural burden for the anesthesia provider. Therefore, the manually entered documentation of this transition may not be timed correctly and is often missing (as shown in Fig 1). At the same time, multiple streams of physiological data that are recorded automatically during the start and end of OLV, make it possible to accurately impute the occurrence and timing of OLV. For example, airway pressures, volumes of delivered breaths, and respiratory rate change within seconds after the start and end of OLV. Other physiological metrics such as heart rate, blood pressure, exhaled CO2, and hemoglobin oxygen saturation (SpO2) may also change in response to the start and end of OLV. The missing or incorrectly timed documentation of OLV illustrates a common clinical scenario where the need for event documentation in the procedural or emergency care settings competes for clinicians’ attention with patient care tasks. Furthermore, the need to recall and document clinical events contributes to the cognitive overload of clinicians and can result in burnoutIskander (2019). The cognitive burden of clinical documentation may be alleviated by a machine learning algorithm that automatically detects the occurrence and timing of clinical events of interest. If used in real-time or near-real time, such an algorithm can redirect a clinician’s attention toward patient care. In retrospective analysis of data, it can aid in clinical quality control and imputing missing data for research.
Given large-scale documented historic medical records, we hypothesized that a data-driven machine learning model could estimate the occurrence and timing of clinical events using routinely available physiological settings and measurement data. We aimed to test this hypothesis by developing a deep learning model and testing its ability to detect the occurrence and timing of OLV start and end in a dataset of patients undergoing lung resection surgery. Specifically, the OLV timestamp prediction can be formulated as a time-series detection task, which takes multiple sequences of 1-D time-series signals as the inputs and outputs the target timestamp of the occurring event. Recognizing a specific segment of the waveform is the key to locating the desired timestamps.
This paper proposes a Transformer-based deep learning framework for OLV timestamp detection. Apart from spatial features, the 1-D signals are transformed into wavelet spectrum images and fed into customized convolutional neural networks to extract the discriminative frequency information. Furthermore, an innovative label temporal smoothing technique is proposed to optimize the procedure to locate the maximum scores from the prediction curves. Experimental results show that our proposed method significantly outperforms the basic time-series change-point detection methods and the recurrent-based deep learning methods.
2 Related Works
The objective of this work is to detect if there is an OLV event occurring for every minute of the signals. In the area of time-series analysis, Twitter Vallis et al. (2014) employed statistical learning to detect anomalies in both applications (Tweets Per Sec) as well as system metrics (CPU utilization). Siffer et al. (2017) proposed an approach to detect outliers in streaming univariate time series based on Extreme Value Theory that did not require hand-set thresholds. Facebook (2022) developed a time-series anomaly detection toolkit by packaging a series of statistic-based methods such as CUSUM (cumulative sum) and Bayesian Online Change Point Detection. However, they are not suitable for the OLV detection tasks because there are no observable change points near the OLV actions for most of the variables. Additionally, some signals have many change points that are not related to the OLV procedure; thus, many false positives would be generated.
Traditional hand-crafted features are expensive to create and require expert knowledge of the field. The performances of traditional statistical models are not satisfactory in real applications. Recently, deep learning approaches have shown superior power in big data analysis with successful applications to computer vision, pattern recognition, and natural language processing Liu et al. (2017). Researchers are investigating data-driven models to improve anomaly detection accuracy Gamboa (2017).
Opprentice Liu et al. (2015) used existing detectors to extract anomaly features and fed them to a random forest classifier to automatically select the appropriate detector-parameter combinations and the thresholds. Xu et al. (2018) proposed Donut, an unsupervised anomaly detection algorithm based on Variational Auto-Encoder (VAE), making it the first generative-based anomaly detection algorithm. The reconstruction probability was used as an anomaly indicator. Deldari et al. (2021) employed a contrastive learning strategy for change point detection by learning an embedded representation through self-supervision. Wang et al. (2016) proposed an autoencoder-based deep learning network to learn physiological features and use multivariate Gaussian distribution anomaly detection method to detect anomaly data. Similarly, Malhotra et al. (2016) proposed a LSTM-based encoder-decoder network to construct a predicted multivariate ”normal” time series and used the reconstruction error for prediction.
The existing methods are mostly unsupervised and based on statistical stationarity assumptions. Therefore, they failed to handle the more complicated scenarios for OLV timestamp estimation and capture the correlations between different variables addressed in this paper. Another barrier using existing methods is that they are incapable of using multiple input signals in a complementary way. The widely used ensemble method that combines predictions of each signal is ineffective since some variables themselves are not discriminative enough for prediction, and they can only provide complementary information for other dominant variables.
To handle the above challenges, we design an innovative Transformer-based model that absorbs multivariate time-series signals and predicts the timestamps of an OLV event under supervision. The proposed method enables direct communications from signal to signal; it also provides direct temporal communications in a self-attention manner by introducing Transformer encoders.
3 Data Management
Study Design: Our study followed a retrospective cohort design. The Mass General Brigham (MGB) Institutional review board (IRB) committee had reviewed the research protocol and exempted the requirement of individual informed consent due to consideration of feasibility and minimal risks to study human subjects (Protocol ID: #2021P002173).
Inclusion and exclusion criteria: Inclusion criteria: (1) patients who were 18 years or older at the time of surgery; (2) lung resection with one lung ventilation; (3) admitted to study site on or after June 15th 2016 and discharged prior to or on June 15th 2021; Exclusion criteria: (1) age less than 18 years old; (2) pregnancy; (3) intraoperative death. (4) multiple hospital encounters: (5) multiple OLV-included surgical procedures performed within encounter: (6) multiple OLV episodes in surgery: (7) no OLV timestamp data.
Data Source: Our study team retrospectively extracted Electronic Medical Records (EMR) information from the MGB central data repository named Enterprise Data Warehouse (EDW) utilizing structured SQL queries. We then constructed and maintained a clinical and observational database of all adult patients who received open thoracic surgeries at both Brigham and Women’s Hospital (BWH) and Massachusetts General Hospital (MGH) from 2016 to 2021 for this research project. There were no a priori power analyses performed to determine the required sample size due to the innovative model structure. We made all extracted EMR records available for analyses, model development, and validation. The curated dataset consists of 4245 patient admission records.
Predictors and Features: OLV can lead to immediate changes of value in certain physiological measures such as gas exchange, ventilation mechanics, and hemodynamics. Therefore, modeling the patterns of their changes can be utilized to predict the OLV event. Specifically, we consider variables/physiological measurements that could show an indication of OLV status from the signal shape. We divide the variables into two groups setting values and physiological measurements from biomedical sensors. The former includes (1) VT (tidal volume) set: target volume for each breath, (2) respiration set. The latter contains (1) peak airway pressure: maximum pressure during a breath, (2) measured respiration rate, (3) spo2, and (4) VT exhaled. Detailed variable descriptions are shown in Table 1.
Missing Data: Our study collected multi-subject multivariate time-series data, and missingness could occur at any feature throughout the entire observational period of surgical procedures. We assumed that the missing mechanism was under a common assumption of Missing At Random (MAR), and imputed the within-sequence missing values for each feature using the classic linear interpolation method. We used the nearest value padding method to fill in the missing head and tail values of different feature sequences to achieve the same fixed length of time series data for followed modeling steps.
4 Method
At a high level, our deep learning model consists of two spatial and frequency branches. The former is primary, and the latter acts as a supplementary. For the spatial feature extraction, our method first transforms the variable intensity of each minute to high dimensional feature embeddings, which improves the representation capability. Furthermore, several transformer encoder blocks are stacked to enable spatial-temporal fusion, where the inter-signal relationships are also exploited. In terms of the frequency branch, we apply the wavelet transform to each signal and obtain 2D spectrum images. In addition, a Gaussian smoothing operation is performed on the ground-truths in order to produce more continuous predictions.
4.1 Problem definition
The goal of the OLV documentation system is to automatically predict the start and end timestamp of OLV during lung surgery. Formally, the dataset with number of patients is represented by . Each patient consists of variables, and , where , and is the sequence length (in minute) after pre-processing. This paper proposes a deep learning method that attempts to learn a function that absorbs and predicts the OLV start and end timestamp and , respectively, which can be described as , where is an integer and .
4.2 Variable Embeddings
In practice, the operation time (from surgery start time to surgery end time) varies significantly from patient to patient, causing the patient-wise signal length to unfixed. Feeding an arbitrary length of data to machine learning models needs additional padding steps and brings about more complexity in model building. Therefore, we propose to segment the entire sequence into fixed-length windows of length , namely a sliding window method with a certain step size . Specifically, for each training iteration, we randomly sample a start timestamp where , then select the values from time to as the input to the deep learning model. Since there exist multiple synchronized signal recordings for each patient, we concatenate all the signals into a channel dimension, resulting in an input .
In general, among the recorded physiological signals, some signals (e.g., tidal volume) provide more clues to address the OLV events than others, while it also happens that informative signals are noisy and the other signals could provide complementary information for prediction. Hence, we decide to represent each signal in a multidimensional way in order to improve the representation capability and capture more complex underlying relationships and signal characteristics. To this end, we employ three linear layers to transform the raw signal recordings into high dimensional embeddings, and the embedding dimension gradually increases from to , and then to , and another to . After encoding the low-dimension raw signal intensities to high-dimension embeddings , the densely distributed representation can better represent the signal patterns. Next, the feature embeddings are ready for sequential information extraction.
4.3 Transformer Blocks for Temporal Learning
To capture the temporal patterns existing around the OLV events, introducing a sequential machine learning model is demanded. Although the recurrent neural networks (RNNs) such as long short-term memory (LSTM) Lipton et al. (2015) could handle the sequential input, the gating and recurrent steps have shortcomings in modeling long-distance dependencies and could get trapped into gradient vanishing problems. Instead, we deploy a self-attention-based transformer encoder framework. It enables direct interactions among each value in a sequence, thus overcoming the limitations of RNNs and their variants.
The Transformer encoder Vaswani et al. (2017); Devlin et al. (2018) is composed of multiple identical sub-blocks, and each block consists of a multi-head self-attention module and a fully connected feed-forward layer. Each sublayer is also succeeded by a normalization layer and residual layer. Since the transformer blocks are not aware of the input order, we add a learnable positional embedding to the input similar to BERT Devlin et al. (2018). And the last layer output from the network can be described as:
[TABLE]
where is the positional embedding. The final features are obtained by applying a fully connected layer to the output of the Transformer.
4.4 Frequency Domain Features
In the previous sections, the methods we present are mainly for spatial feature extraction, where we focus on morphological patterns. On the other hand, the change in the spatial domain, namely the frequency domain feature, is a more subject-invariant cue for time-series event detection. For example, the power spectrum is a solid feature representation for electrocardiogram (ECG) and electroencephalography (EEG) Banerjee and Mitra (2013); Alquran et al. (2019) for classification. Since the temporal resolution is crucial for timestamp prediction, we adopt the wavelet spectrum Meyer (1992) 2D image of the input variables as the initial frequency data. By concatenating the wavelet spectrum images, which are calculated from input signals, we obtain multi-channel 2D feature maps of size . Then, it’s straightforward to utilize convolutional neural network (CNN) to extract prediction-related information from the 2D spectrum image. Specifically, we deploy three layers of 2D convolutions together with BatchNorm and non-linear ReLU operations. The abstracted frequency features are further concatenated with the spatial features in Equation 1 to detect the presence of an OLV event. We describe the calculation as:
[TABLE]
where denotes the Sigmoid operation, and ; is feature concatenation. The output logits are obtained by applying a fully connected classification layer (CLS).
4.5 Label Smoothing
Recall that after the entire sequence is split into segments, we need to prepare the ground-truths specifically for each segment. First, if the OLV start timestamp occurs inside the sampled to segment, we set the value at to 1, and set all the other timestamps to 0. Second, if there is no OLV event performed in the sampled segment, we keep the zero-filled label list as the corresponding ground truths.
However, the above approach to preparing for the labels is sub-optimal. The first reason is that, due to the burden of documenting clinical procedures, it happens that clinicians documented the OLV event a few minute later or earlier than the exact timestamp of the OLV procedural. In other words, the previous approach to generating the labels is vulnerable to label noise. Second, optimizing the model using a label list that has a sudden high probability value at the exact timestamp and zeros nearby causes the model to generate discrete predictions. Then, it becomes more challenging to locate the OLV timestamps from the full-length signals. To tackle the weaknesses, we propose to utilize the Gaussian distribution function to smooth the ground truths. Specifically, we use a Gaussian distribution centered at the ground truth timestamp with the standard deviation , to construct the label distribution as shown in Equation 3.
[TABLE]
Note that the smoothing step only applies to the minutes near the ground-truth timestamp.
As for the inference phase, similar to training, a sliding window with size , and a step size are used to split the signals into smaller equal-length segments. The total number of segments is calculated by:
[TABLE]
where is the original sequence length. To obtain the final predictions for each patient, we find the maximum response among all the outputs and the corresponding timestamp. Formally,
[TABLE]
4.6 Loss function
The model predicts the probability of an occurring OLV event for each timestamp. The binary cross entropy loss is used for optimization. In addition, we apply an auxiliary cross-entropy classification loss to the frequency feature to classify the binary occurrence of an OLV event.
5 Results
In this section, we first describe our performance metrics and implementation details and then provide the comparisons with baseline methods. Following that, we analyze the importance of each variable through leaving-one-variable-out training and model interpretation. Lastly, we show the cross-institution generalization ability by training the model on Site A and testing on Site B, and vice versa.
5.1 Model Performance
Metrics. Model performance is evaluated in the testing set. We use mean absolute error (MAE) and accuracy with error margin as the OLV timestamp estimation criteria. The justification of the event prediction accuracy is based on a pre-defined margin value, which is an allowable temporal range before or after the ground-truth timestamp. If the predicted timestamp is within this range, the prediction of the OLV event is a true positive. We use to represent accuracy with a clinically significant margin of 3 minutes. The MAE is calculated from the distance between the ground-truth timestamps and the predicted timestamps.
Implementation details. Our framework is trained using PyTorch. The mini-batch size is 24, and the learning rate is set to 0.0005. We employed an Adam Kingma and Ba (2014) optimizer with 0.9 Nesterov momentum, where the weight decay rate is set to 0.0001. The sliding window size is 40 minutes. We split the data into five folds randomly, and each fold includes 845 records. Five-fold cross-validation is applied for all experiments. The reported results are the average of every fold. Two identity models are trained separately to predict the respective start and end timestamps. All experiments are done in a GeForce RTX 2080Ti GPU. Detailed training and testing steps are shown in Algorithm 1.
Overall performance and ablation study. Table 2 shows the performance using the full set of variables for training. Fig 5 describes the histogram of the prediction errors for five folds of the testing set. The results show that most of the errors are centered around 0. A majority (81.7%) of the predictions are within the 3 minutes error margin. The highest portion is at 0-minute error, where the model has successfully predicted the timestamp at the exact minute of the ground truth, and as the distance increases, the error percentage decreases significantly. We claim that most of the predictions are within a 3-minute error margin.
As compared to the baseline models, it can be seen from Table 2 that our proposed consistently outperforms all the baselines by a considerable margin. We implemented a heuristic method that locates the top 2 change points from the most OLV-correlated variable (i.g., ). The results show that the hand-crafted feature based method produces inferior MAE and accuracy than data-driven learning-based methods. It’s worth noting that the basic neural network with fully connected layers is not comparable to the sequential models such as LSTM (Long short-term memory) and Transformers. This indicates that incorporating temporal information is crucial for OLV detection. Although the LSTMs can learn temporal evolution using recurrent gates, they are sub-optimal compared to Transformers. Transformers enable direct connections between each node of timestamps, and the direct attention mechanism allows longer sequential modeling.
In terms of the ablations as shown in Table 2, we observe an obvious decreasing in accuracy (from 83.691.3 to 80.784.3) and increasing of MAE (from 4.44.1 to 5.85.5) after removing the label temporal smoothing training. It demonstrates that smoothing the target timestamps during training produces score curves that have smoother transitions from OLV occur to not occur, consequently making it easier to locate the maximum response from the prediction curves. As shown in Fig 4, after smoothing the supervision signals with the Gaussian function, the predicted scores at each timestamp are also curved and noise reduced. On the contrary, without smoothing, the output scores present noticeable noise that interferes with locating the maximum score, thus yielding a biased predicted timestamp.
In order to see how much the frequency domain features affect the performance, we train our model again without the spectrum input and compare it to our original method. Utilizing the frequency domain features decreases the MAE from 4.55.1 to 4.44.1, and acc5 increases from 82.789.9 to 83.691.3. It shows the effectiveness of frequency features that can provide solid extra information for time-series OLV detection.
Cross-site generalizability.
Recall that our dataset is curated from two institutions. Regarding the within-site results, we observe that site B yields better performance than site A. This makes intuitive sense because Site B consists of more patients’ records than Site A. To investigate the model generalization ability across two sites, we use the data from one site for training and the data from the other for testing. Regarding cross-site validation, the MAE increases to 5.85.5 and 8.76.5. While underlying reasons remain unclear for further investigation, we attribute this to the distribution shift between the data from the two sites introduced by differences in patient demographics and clinical characteristics. We leave it as our future work to incorporate domain adaptation modules to fine-tune our models to improve the model generalizability Farahani et al. (2021).
5.2 Feature Importance Decomposition
To explore how important each variable contributes to the prediction model training and which variable has more information to predict the OLV start and end timestamp. We conduct our experiments in two aspects: (1) training without one of the variables and (2) computing the integral of the gradients of the output prediction for the predicted label with respect to the input variables Sundararajan et al. (2017).
As can be seen from Table 4, after removing either of the or the , the MAE drops more significantly than the others. In contrast, the rest variables have a minor contribution to accuracy. Some variables contain easier-recognized signal patterns driven by OLV operation than others, which is consistent with our observations. By feeding all the variables to the model, the best performance is achieved. We can see that although some variables are much less informative than or , they still provide supplementary information for OLV prediction and contribute to higher accuracy. Figure 6 shows the average of the attribution score of each variable of the patients using the integral of the gradients. Consistently, we observe higher attribution scores for and . Following them, and present a high importance score less frequently. Moreover, the scores are widely scattered between 0 to 1, which indicates that there exists a small portion of cases when and contribute the most and act as dominant variables. The deep learning model adaptively attends to the variables that are correlated most to OLV events, and it lowers the reliance on the variables that hardly show OLV-correlated patterns. In contrast, the anomaly detection methods using hand-craft statistical patterns are incapable of weighing the reliance on the variables except by using pre-defined weights and thresholds.
6 Discussion and Limitation
In this paper, we developed and validated an innovative Transformer-based deep learning model for predictions of start/end timestamps of OLV procedures utilizing objective physiological monitoring data. We obtained a satisfactory predictive performance for this DL algorithm, and this framework can be potentially extended to applications of clinical auto-documentation of other OR clinical events or procedures in other medical settings such as Intensive Care Units (ICU) or Post Anesthesia Care Units (PACU). Additionally, our extended experiments allow us to track down the contributing factors of observed between-institution variance, providing insights for interventions to improve the quality of collected data.
Our study has limitations. First, this work utilizes a retrospective observational clinical dataset, which is inevitably exposed to selection bias when sampled from the target patient population. As the first pilot study of this program of research, we decided to first focus on clinical cases containing only one OLV event due to practical considerations of data quality control and conditioning, and the convenience of modeling. This choice was based on assumptions that the majority of thoracic cases would undergo only one OLV procedure, and that OLV timestamps of one-OLV cases would be documented more reliably compared to multiple-OLV cases. However, such choices might have ruled out cases with higher clinical complexity and more/shorter OLV procedures hence introducing selection biases into our study sample. It partially explains the discrepancy of predictive performance in cross-site generalizability analysis due to different clinical characteristics by selection. We plan to further include and adjust clinical confounding factors to overcome this issue in our next research. Second, deep learning models are known to be difficult to interpret and prone to overfit the observed data. We will address this limitation by introducing the game-theory-based SHAP Lundberg and Lee (2017) values for explanations and minimizing over-fitting by utilizing internal cross-validation techniques and performing cross-sample (Site A vs. Site B) validations to assure model generalizability across samples from different institutions. We plan to refine our algorithm in followed studies to predict both non-event and multiple-events by incorporating external validation data sources from other institutions such as Columbia University Hospital systems.
The reference list from the paper itself. Each links out to its DOI / PubMed record.
- 1Allison et al. (2015) Allison MG, Scott MC, Hu KM, Witting MD, Winters ME (2015) High initial tidal volumes in emergency department patients at risk for acute respiratory distress syndrome. Journal of critical care 30(2):341–343
- 2Alquran et al. (2019) Alquran H, Alqudah AM, Abu-Qasmieh I, Al-Badarneh A, Almashaqbeh S (2019) Ecg classification using higher order spectral estimation and deep learning techniques. Neural Network World 29(4):207–219
- 3Banerjee and Mitra (2013) Banerjee S, Mitra M (2013) Application of cross wavelet transform for ecg pattern analysis and classification. IEEE transactions on instrumentation and measurement 63(2):326–333
- 4Bray et al. (2018) Bray F, Ferlay J, Soerjomataram I, Siegel RL, Torre LA, Jemal A (2018) Global cancer statistics 2018: Globocan estimates of incidence and mortality worldwide for 36 cancers in 185 countries. CA: a cancer journal for clinicians 68(6):394–424
- 5Deldari et al. (2021) Deldari S, Smith DV, Xue H, Salim FD (2021) Time series change point detection with self-supervised contrastive predictive coding. In: Proceedings of the Web Conference 2021, pp 3124–3135
- 6Devlin et al. (2018) Devlin J, Chang MW, Lee K, Toutanova K (2018) Bert: Pre-training of deep bidirectional transformers for language understanding. ar Xiv preprint ar Xiv:181004805
- 7Facebook (2022) Facebook (2022) Kats. https://facebookresearch.github.io/Kats/
- 8Farahani et al. (2021) Farahani A, Voghoei S, Rasheed K, Arabnia HR (2021) A brief review of domain adaptation. Advances in data science and information engineering pp 877–894