Near L-edge photoionization of triply charged iron ions
Randolf Beerwerth, Ticia Buhr, Alexander Perry-Sa{\ss}mannshausen,, Sebastian O. Stock, Sadia Bari, Kristof Holste, A. L. David Kilcoyne, Simon, Reinwardt, Sandor Ricz, Daniel Wolf Savin, Kaja Schubert, Michael Martins,, Alfred M\"uller, Stephan Fritzsche, Stefan Schippers

TL;DR
This study measures and analyzes the photoionization cross sections of Fe$^{3+}$ ions near the L-edge, combining experimental data with advanced theoretical calculations to improve understanding of ionization processes and charge-state distributions.
Contribution
It provides new experimental measurements and detailed theoretical modeling of Fe$^{3+}$ photoionization, including Auger cascades, enhancing accuracy over previous models.
Findings
Good agreement between experiment and MCDHF calculations
Identification of specific resonance transitions
Improved charge-state fraction predictions
Abstract
Relative cross sections for -fold photoionization () of Fe by single photon absorption were measured employing the photon-ion merged-beams setup PIPE at the PETRA III synchrotron light source operated at DESY in Hamburg, Germany. The photon energies used spanned the range of , covering both the photoexcitation resonances from the and shells as well as the direct ionization from both shells. Multiconfiguration Dirac-Hartree-Fock (MCDHF) calculations were performed to simulate the total photoexcitation spectra. Good agreement was found with the experimental results. These computations helped to assign several strong resonance features to specific transitions. We also carried out Hartree-Fock calculations with relativistic extensions taking into account both photoexcitation and photoionization. Furthermore, we performed extensive…
Click any figure to enlarge with its caption.
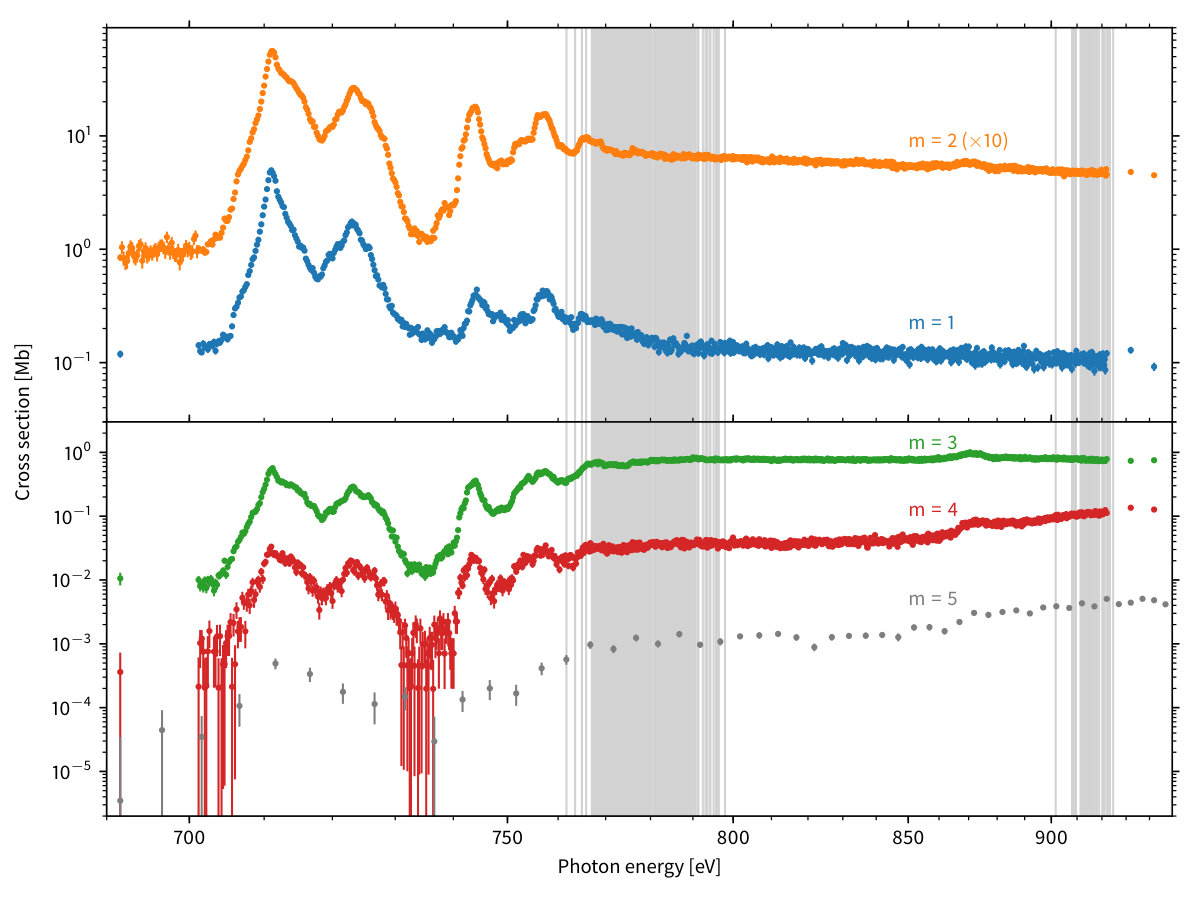 Figure 1
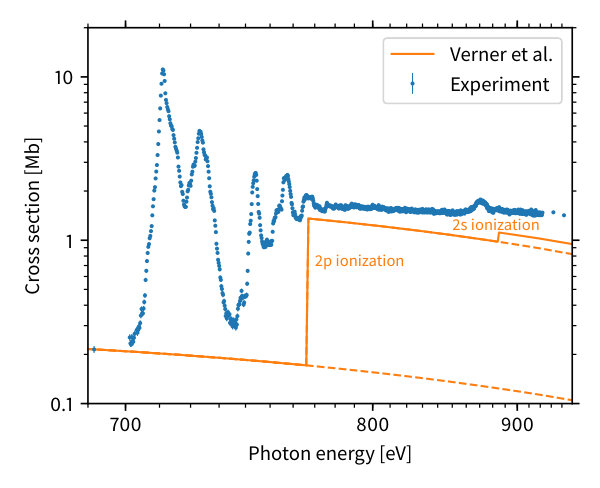 Figure 2
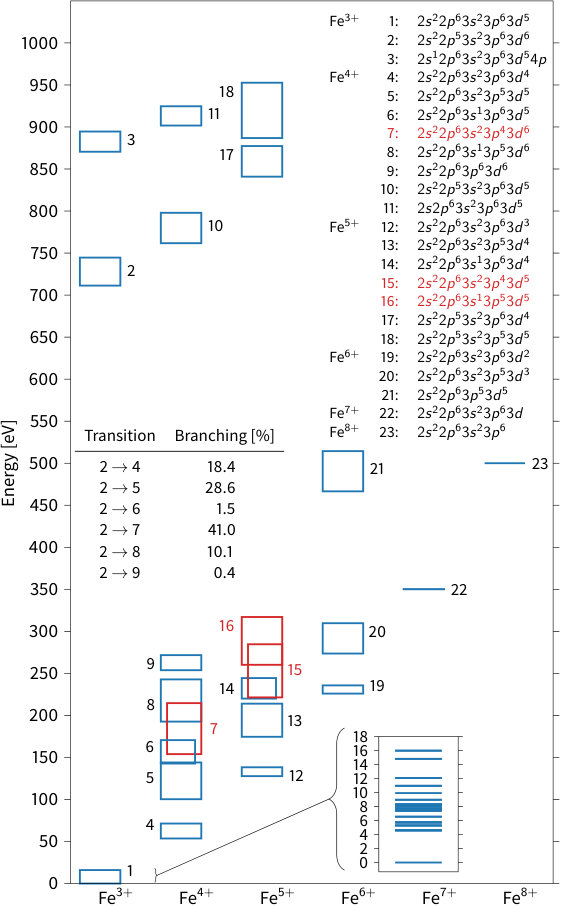 Figure 3
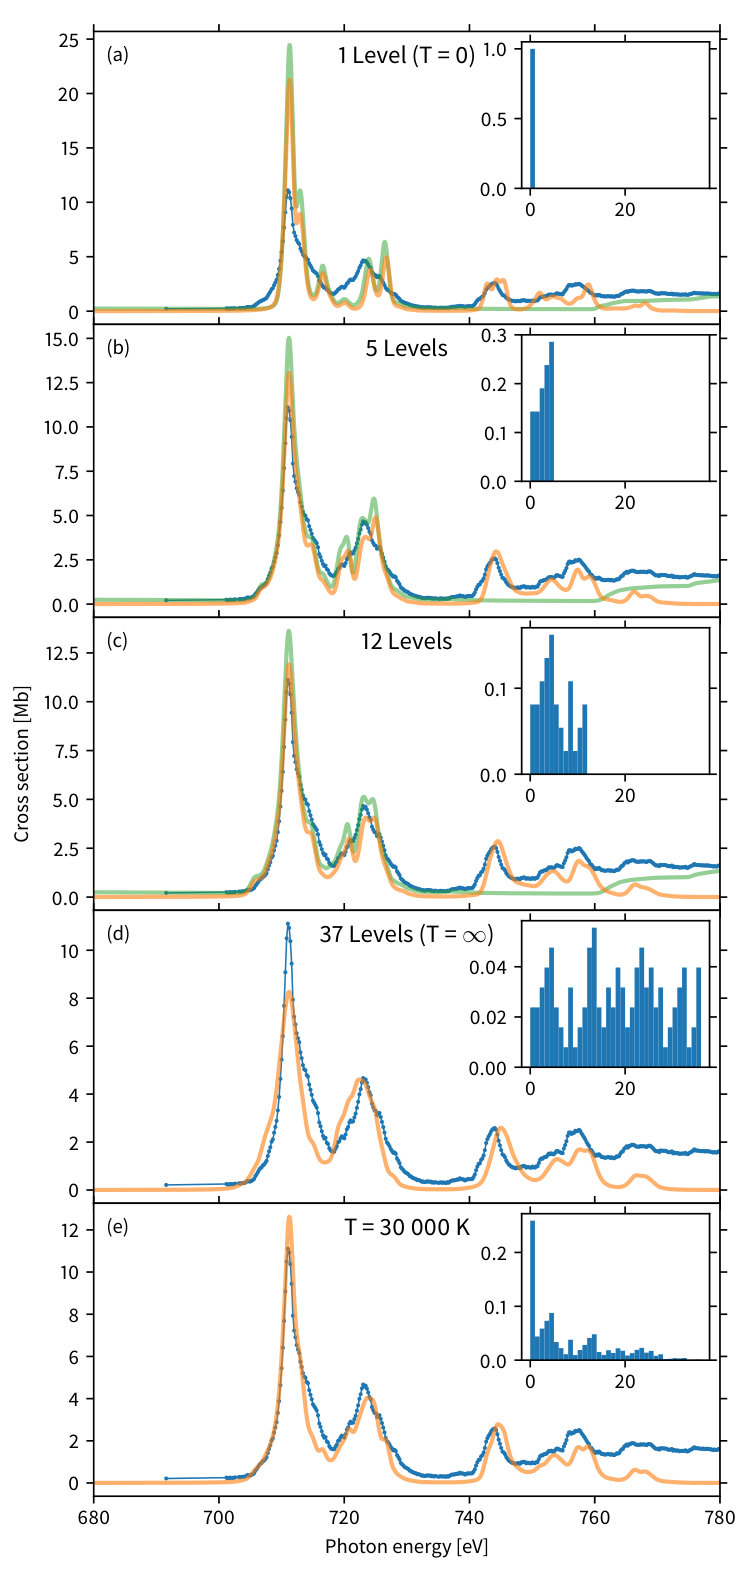 Figure 4
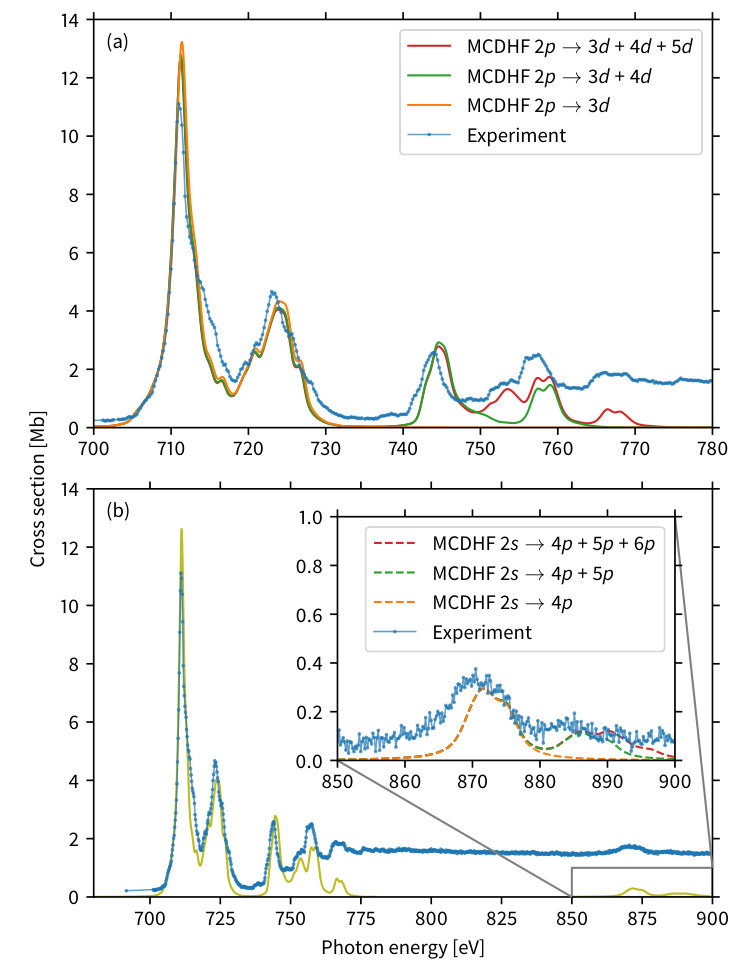 Figure 5
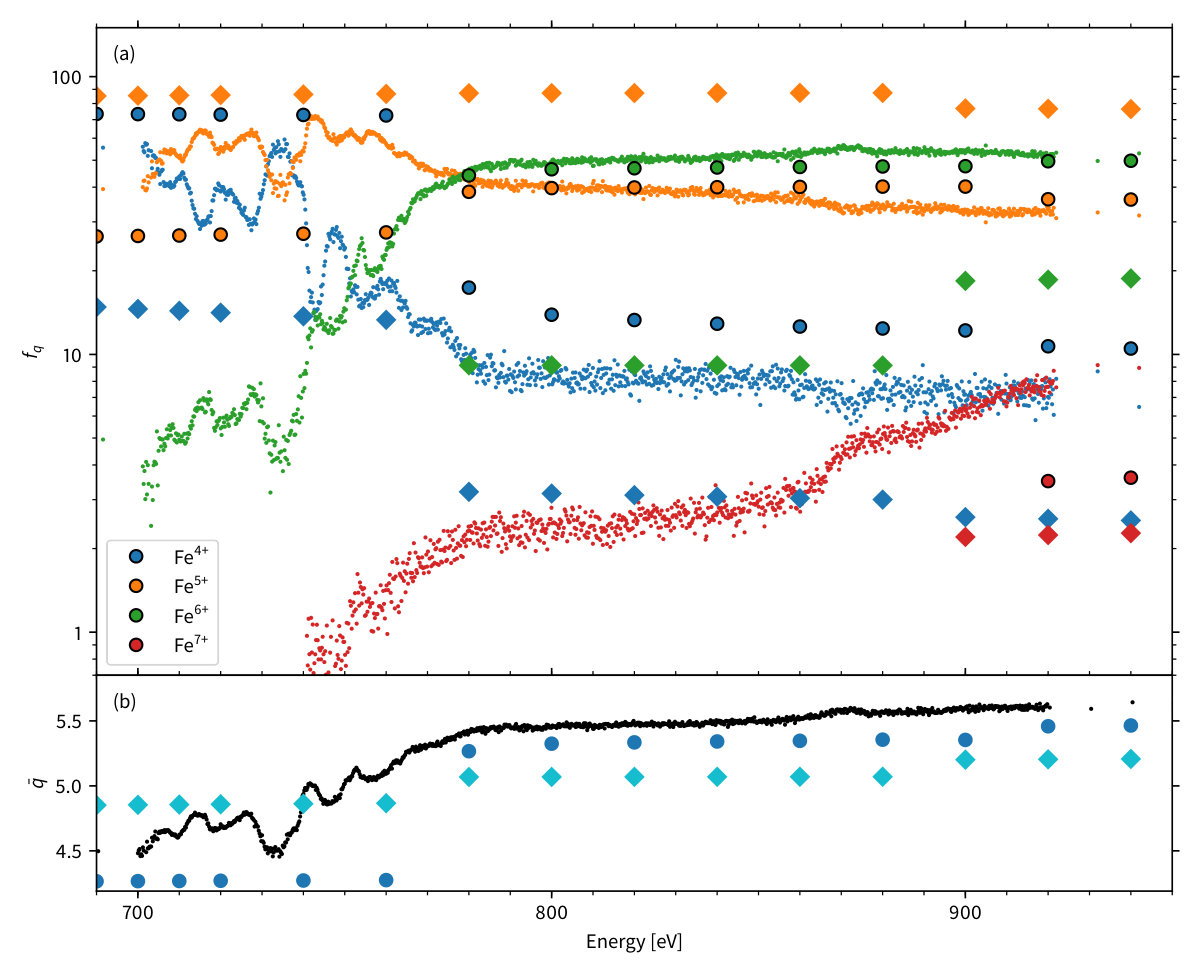 Figure 6
| Energy (eV) | (Mb) | (Mb) | (Mb) | (Mb) | (Mb) | (Mb) | |
|---|---|---|---|---|---|---|---|
| 691.568 | 0.1191(87) | 0.0845(59) | 0.0106(24) | 0.0004(04) | - | 0.214(11) | 4.498(30) |
| 711.001 | 4.976(53) | 5.557(47) | 0.542(11) | 0.0333(30) | - | 11.109(71) | 4.6069(36) |
| 711.602 | 4.021(34) | 4.938(34) | 0.4561(85) | 0.0264(19) | 0.000492(94) | 9.441(48) | 4.6280(29) |
| 718.213 | 0.573(18) | 0.921(19) | 0.0991(47) | 0.0065(13) | - | 1.600(27) | 4.7119(97) |
| 723.021 | 1.756(31) | 2.609(32) | 0.2852(81) | 0.0198(23) | - | 4.670(45) | 4.6935(57) |
| 731.636 | 0.2067(80) | 0.1873(66) | 0.0204(18) | 0.00195(53) | 0.000149(59) | 0.416(11) | 4.562(15) |
| 744.057 | 0.397(16) | 1.803(27) | 0.3603(89) | 0.0222(24) | - | 2.582(33) | 5.0030(71) |
| 756.678 | 0.384(15) | 1.509(17) | 0.460(19) | 0.0303(28) | 0.000414(93) | 2.384(25) | 5.0574(81) |
| 771.703 | 0.1947(77) | 0.726(13) | 0.6316(97) | 0.0281(19) | 0.00083(12) | 1.581(18) | 5.3119(83) |
| 801.754 | 0.1333(64) | 0.637(12) | 0.789(11) | 0.0379(21) | 0.00131(12) | 1.598(18) | 5.4579(80) |
| 901.923 | 0.0986(56) | 0.490(10) | 0.814(12) | 0.1036(35) | 0.00387(22) | 1.506(17) | 5.6125(86) |
| Energy [eV] | |||||||
| This work | |||||||
| 690 | 0\@alignment@align | 0 | 20\@alignment@align | 68 | 13\@alignment@align | ||
| 840 | 0\@alignment@align | 82 | 4\@alignment@align | 12 | 1\@alignment@align.8 | ||
| 960 | 12\@alignment@align | 74 | 3\@alignment@align.5 | 10 | 1\@alignment@align.2 | ||
| Verner et al. (1993) | |||||||
| 690 | 0\@alignment@align | 0 | 20\@alignment@align | 66 | 15\@alignment@align | ||
| 840 | 0\@alignment@align | 87 | 2\@alignment@align.7 | 8.4 | 1\@alignment@align.5 | ||
| 960 | 13\@alignment@align | 76 | 2\@alignment@align.5 | 7.4 | 1\@alignment@align.1 | ||
| Fe4+ | Fe5+ | Fe6+ | Fe7+ | Fe8+ | |||
| This work (shake-down) | |||||||
| \@alignment@align. | 2.5 | 64\@alignment@align | 33.6 | \@alignment@align. | |||
| \@alignment@align. | 47 | 53\@alignment@align | . | \@alignment@align. | |||
| \@alignment@align. | 100 | \@alignment@align. | . | \@alignment@align. | |||
| 100\@alignment@align | . | \@alignment@align. | . | \@alignment@align. | |||
| This work (two-electron Auger) | |||||||
| \@alignment@align. | 4.0 | 95\@alignment@align | 1.1 | \@alignment@align. | |||
| \@alignment@align. | 89 | 11\@alignment@align | . | \@alignment@align. | |||
| \@alignment@align. | 100 | \@alignment@align. | . | \@alignment@align. | |||
| 100\@alignment@align | . | \@alignment@align. | . | \@alignment@align. | |||
| Kaastra & Mewe (1993) | |||||||
| \@alignment@align. | 0.3 | 83\@alignment@align.0 | 14.3 | 0\@alignment@align.04 | |||
| 1\@alignment@align.8 | 87.2 | 10\@alignment@align.5 | 0.54 | \@alignment@align. | |||
| 1\@alignment@align.1 | 84.9 | 13\@alignment@align.3 | 0.67 | \@alignment@align. | |||
| \@alignment@align. | 100 | \@alignment@align. | . | \@alignment@align. | |||
| \@alignment@align. | 100 | \@alignment@align. | . | \@alignment@align. | |||
| Energy [eV] | Fe4+ | Fe5+ | Fe6+ | Fe7+ | Fe8+ | ||
|---|---|---|---|---|---|---|---|
| resonances (experiment) | |||||||
| 711 | 45\@alignment@align. | 50. | 5\@alignment@align. | 0.3 | 0\@alignment@align.01 | ||
| 723 | 34\@alignment@align. | 59. | 7\@alignment@align. | 0.3 | 0\@alignment@align.01 | ||
| resonances (shake-down) | |||||||
| 711 | 41\@alignment@align.9 | 56.7 | 1\@alignment@align.3 | . | |||
| 723 | 40\@alignment@align.3 | 56.9 | 2\@alignment@align.7 | . | |||
| resonances (two-electron Auger) | |||||||
| 711 | 66\@alignment@align.9 | 31.7 | 1\@alignment@align.3 | . | |||
| 723 | 54\@alignment@align.6 | 42.7 | 2\@alignment@align.8 | . | |||
| Direct ionization (experiment) | |||||||
| 690 | 55\@alignment@align.6 | 39.4 | 4\@alignment@align.9 | 0.2 | 0\@alignment@align.001 | ||
| 840 | 7\@alignment@align.7 | 38.2 | 51\@alignment@align.4 | 2.7 | 0\@alignment@align.1 | ||
| 960 | 6\@alignment@align.9 | 32.2 | 51\@alignment@align.5 | 9.4 | 0\@alignment@align.4 | ||
| Direct ionization (shake-down) | |||||||
| 690 | 73\@alignment@align.4 | 26.6 | 0\@alignment@align.0 | 0.0 | |||
| 840 | 12\@alignment@align.9 | 40.0 | 47\@alignment@align.1 | 0.0 | |||
| 960 | 10\@alignment@align.4 | 35.9 | 49\@alignment@align.9 | 3.8 | |||
| Direct ionization (two-electron Auger) | |||||||
| 690 | 73\@alignment@align.4 | 26.6 | 0\@alignment@align.0 | 0.0 | |||
| 840 | 12\@alignment@align.9 | 76.9 | 10\@alignment@align.1 | 0.0 | |||
| 960 | 10\@alignment@align.4 | 69.2 | 20\@alignment@align.2 | 0.2 | |||
Peer Reviews
No public reviews on file for this paper yet. If you reviewed it on a platform where reviews are public (OpenReview, ICLR, NeurIPS, ICML), you can paste yours below so the community can read it here.
Videos
No videos yet. Explain this paper in a talk, walkthrough, or lecture? Add one.
Near -Edge Single and Multiple Photoionization of Triply Charged Iron Ions
Helmholtz-Institut Jena, Fröbelstieg 3, D-07743 Jena, Germany
Theoretisch-Physikalisches Institut, Friedrich-Schiller-Universität Jena, D-07743 Jena, Germany
I. Physikalisches Institut, Justus-Liebig-Universität Gießen, Heinrich-Buff-Ring 16, 35392 Giessen, Germany
Alexander Perry-Saßmannshausen
I. Physikalisches Institut, Justus-Liebig-Universität Gießen, Heinrich-Buff-Ring 16, 35392 Giessen, Germany
Helmholtz-Institut Jena, Fröbelstieg 3, D-07743 Jena, Germany
Theoretisch-Physikalisches Institut, Friedrich-Schiller-Universität Jena, D-07743 Jena, Germany
FS-SCS, DESY, Notkestraße 85, 22607 Hamburg, Germany
I. Physikalisches Institut, Justus-Liebig-Universität Gießen, Heinrich-Buff-Ring 16, 35392 Giessen, Germany
Advanced Light Source, MS 7-100, Lawrence Berkeley National Laboratory, Berkeley, California 94720, USA
Simon Reinwardt
Institut für Experimentalphysik, Universität Hamburg, Luruper Chaussee 149, 22761 Hamburg, Germany
Sandor Ricz
Institute for Nuclear Research, Hungarian Academy of Sciences (MTA Atomki), H-4001 Debrecen, Hungary
Columbia Astrophysics Laboratory, Columbia University, 550 West 120th Street, New York, New York 10027, USA
Kaja Schubert
FS-SCS, DESY, Notkestraße 85, 22607 Hamburg, Germany
Institut für Experimentalphysik, Universität Hamburg, Luruper Chaussee 149, 22761 Hamburg, Germany
Institut für Atom- und Molekülphysik, Justus-Liebig-Universität Gießen, Leihgesterner Weg 217, 35392 Giessen, Germany
Helmholtz-Institut Jena, Fröbelstieg 3, D-07743 Jena, Germany
Theoretisch-Physikalisches Institut, Friedrich-Schiller-Universität Jena, D-07743 Jena, Germany
I. Physikalisches Institut, Justus-Liebig-Universität Gießen, Heinrich-Buff-Ring 16, 35392 Giessen, Germany
Abstract
Relative cross sections for -fold photoionization () of Fe3+ by single photon absorption were measured employing the photon-ion merged-beams setup PIPE at the PETRA III synchrotron light source operated at DESY in Hamburg, Germany. The photon energies used spanned the range of , covering both the photoexcitation resonances from the and shells as well as the direct ionization from both shells. Multiconfiguration Dirac–Hartree–Fock (MCDHF) calculations were performed to simulate the total photoexcitation spectra. Good agreement was found with the experimental results. These computations helped to assign several strong resonance features to specific transitions. We also carried out Hartree–Fock calculations with relativistic extensions taking into account both photoexcitation and photoionization. Furthermore, we performed extensive MCDHF calculations of the Auger cascades that result when an electron is removed from the and shells of Fe3+. Our theoretically predicted charge-state fractions are in good agreement with the experimental results, representing a substantial improvement over previous theoretical calculations. The main reason for the disagreement with the previous calculations is their lack of inclusion of slow Auger decays of several configurations that can only proceed when accompanied by de-excitation of two electrons. In such cases, this additional shake-down transition of a (sub-)valence electron is required to gain the necessary energy for the release of the Auger electron.
Atomic data benchmarking (2064), Atomic physics (2063), De-excitation rates (2066), Photoionization (2060), Spectral line identification (2073)
1 Introduction
Soft X-ray -shell photoabsorption by -shell iron ions can be important for cosmic objects ranging from photoionized gas in the vicinity of active galactic nuclei (AGNs) to the near neutral gas of the interstellar medium (ISM). This absorption is largely due to photoexcitation in Fe0+–Fe15+, the spectral features of which lie in the Å bandpass ( eV; Behar et al. 2001). To help provide reliable iron -shell photoabsorption data for these astrophysical environments, we have carried out a series of combined experimental and theoretical studies. Previously, we presented cross sections for single and multiple photoionization of Fe+ ions in the range of -shell photoexcitation and photoionization (Schippers et al., 2017). Here we present photoabsorption measurements for Fe3+. Traces of Fe3+ may have been detected in AGN spectra (e.g., Holczer et al., 2005). In the ISM, Fe3+ may also exist in the gas phase (Lee et al., 2009). But equally important, the Fe in dust grains, when in crystalline structures, may be in the form of Fe3+ (Miedema & de Groot, 2013). Reliable atomic data for gas-phase Fe3+ photoabsorption is needed to distinguish any gas-phase absorption from any solid-matter absorption and for the accurate determination of the iron abundance and its chemical environment. Benchmarking the relevant ionization cross sections by experimental laboratory studies is a prerequisite for such an analysis, as described in more detail by Schippers et al. (2017).
Total photoionization cross sections of -shell electrons for iron have been provided by Reilman & Manson (1979). Theoretical photoionization cross sections for each subshell are tabulated in the works by Reilman & Manson (1979), Verner et al. (1993), and Verner & Yakovlev (1995). Computations of cascade processes that result from inner shell holes were performed and tabulated by Kaastra & Mewe (1993), which also includes -shell holes.
Here, we present our measurements of relative cross sections for up to five-fold ionization of Fe3+ ions via photoexcitation or photoionization of an -shell electron. Our results provide accurate information on the positions and shapes of the resonances associated with the excitation of a electron. These data will help to facilitate a reliable identification of Fe3+ photoabsorption features in astrophysical X-ray spectra. Furthermore, we have performed extensive multiconfiguration Dirac–Hartree–Fock (MCDHF) calculations in order to simulate the experimental spectra and to identify the dominant Auger decay channels. We also carried out Hartree–Fock calculations with relativistic extensions taking into account both photoexcitation and photoionization. Taken together, all these results will be useful for the modeling of the charge balance in astrophysical plasmas.
2 Experiment
The experiment was performed at the PIPE end station (Schippers et al., 2014; Müller et al., 2017) of the photon beam line P04 (Viefhaus et al., 2013) at the synchrotron light source PETRA III, which is operated by DESY in Hamburg, Germany. At PIPE, the photon-ion merged-beams technique is used to measure photoionization cross sections of ions. Schippers et al. (2016a) give a recent overview and Schippers et al. (2017) provide a detailed discussion of the experimental method employed here. Typical Fe3+ ion currents in the merged-beam interaction region were nA. The nearly monochromatic photon flux, with an energy spread of eV, was up to s*-1*.
Relative cross sections of initial Fe3+ ions for the production of Feq+ ions () were measured. As described previously for single and multiple ionization of Fe+ ions (Schippers et al., 2017), these measurements are performed individually for each product charge state by scanning the photon energy from 680 eV up to 950 eV. The results are displayed in Figure 1. The measured cross sections span six orders of magnitude. In our previous work on Fe+, we ruled out contributions to the measured signal due to interactions with more than one photon or ionizing collisions off of the residual gas in the apparatus (Schippers et al., 2017). There, it was estimated that such events can be safely disregarded. Since the present data were obtained under very similar experimental conditions, we attribute the measured cross sections in Figure 1 to only processes that involve an initial excitation or ionization of Fe3+ by a single photon.
In principle, the PIPE setup enables measuring photoionization cross sections on an absolute scale. This requires scanning the spatial profiles of the ion beam and the photon beam, from which the geometrical beam overlap factor can be obtained. Unfortunately, such measurements could not be carried out because of a technical problem that could not be solved within the allocated beamtime. Therefore, we multiplied all relative partial cross sections by a common factor such that the cross section sum,
[TABLE]
matches the theoretical photoionization cross section of Verner et al. (1993) at 692 eV (Figure 2). At these energies the cross section is dominated by photoionization of the -shell. The rationale for this procedure is that we found excellent agreement between experiment and theory in this energy range in our previous work on photoionization of Fe+ where absolute cross sections were measured with a total uncertainty at a 90% confidence limit (Schippers et al., 2017). This suggests that there is a similar uncertainty for the absolute cross section scale in the present case, after normalization to the theoretical cross section of Verner et al. (1993) as described above. It should be noted that, to a very good approximation, the sum in Equation (1) represents the total photoabsorption cross section, as all the dominant product channels have been measured. The unmeasured Fe3+ product channel, which represents photon scattering, is expected to be insignificant because the fluorescence yield from inner shell hole states is generally negligible for light elements like iron (McGuire, 1972). In this case, our computations confirm the fluorescence yield to be about 1%.
For the determination of the photon energy scale, the same calibration was used as for our Fe+ measurements (Schippers et al., 2017), taking into account the differences in the Doppler shift between the faster Fe3+ ions and the slower Fe+ ions. The remaining uncertainty of the experimental photon-energy scale is 0.2 eV.
The ground level of Fe3+ is the level. In addition there are 36 excited levels that can be populated in the hot plasma of the ECR source. For all these excited levels, the flight time from the ion source to the photon-ion interaction region is much shorter than the radiative lifetime of the levels (Nahar, 2006; Froese Fischer et al., 2008). Consequently, the Fe3+ ion beam consisted of an unknown mixture of ground-level and excited-level ions. This has to be taken into account when comparing the theoretical calculations with the experimental results, as is discussed in more detail below. Higher-excited even-parity configurations are expected to play a negligible role as their excitation energies are larger than 15 eV. Therefore, their populations are expected to be insignificant for the ion temperatures inferred below for our ion beam.
3 Theory
3.1 MCDHF Calculations
In order to understand and interpret the measured resonance structures, we have performed MCDHF calculations (Grant, 2007) to model the photoexcitation cross sections. The background due to direct photoionization was neglected in these models since the fine-structure resolved absolute photoionization cross sections pose major challenges. In addition, independent extensive MCDHF computations were performed to model all the de-excitation pathways due to Auger cascade processes of the and vacancies created by either photoexcitation or direct photoionization processes. For all MCDHF computations, we utilized the Grasp2k program package (Jönsson et al., 2007, 2013) to generate approximate wave functions, which we describe below. The Ratip code was employed to compute all needed transition rates and relative photoionization cross sections (Fritzsche, 2001, 2012).
The computed level structure of the ground configuration of Fe3+ can be seen in the inset of Figure 3. The computed gross structure largely reproduces the experimentally derived energy levels (not shown) reported by Kramida et al. (2018). The most notable observation that can be made here is that the ground level is well separated from the more highly excited metastables. However, we have used here the single configuration approximation without additional corrections for electron correlation effects. As a result, deviations from the measured level energies can be seen. For example, the total energy spread of the ground configuration is computed as 16 eV, which is too large by about 2.5 eV (Kramida et al., 2018). Additionally, our computations do not correctly reproduce the level order in some multiplets, due to the limited basis sets used. For example, the first excited multiplet has four fine-structure levels ranging from to , where the latter is lowest in energy and is highest in energy, separated by about 7.5 meV (Kramida et al., 2018). This order is reversed in our computations, such that comes out lowest and highest. As the fine-structure splitting of 0.01 eV is very small compared to the photon energy spread of 1 eV, an incorrect level order within a multiplet does not affect the computed spectra to any significant extent. Furthermore, we note that our single-configuration computations reproduce reasonably well the lifetimes calculated by Froese Fischer et al. (2008).
The photoexcitation cross section due to resonant photoexcitation was computed based on wave functions for the ground configuration and the excited configurations, taking limited configuration interaction (CI) into account. The contribution of photoexcitations into the configuration was found to be negligible and hence has been neglected in the subsequent MCDHF computations.
Inner-shell hole states produced by photoexcitation or photoionization will predominantly decay by Auger processes. In the most common two-electron Auger process, one electron fills the inner-shell vacancy and the second electron is released into the continuum producing an ion in the next-higher charge state. A fraction of the Auger decays can result in a so-called shake-up or shake-down transition, where the Auger process is accompanied by an additional excitation or de-excitation, respectively, of a third bound electron, hereafter denoted as a three-electron Auger process. If instead two electrons are simultaneously ejected into the continuum, the process is called direct double Auger decay.
To model all the de-excitation pathways by sequential Auger decays after, for example, resonant photoexcitation of Fe3+ (forming configuration 2 in Figure 3), we include all electronic configurations that arise from two-electron Auger decay processes emerging from the core-hole excited configuration. All energetically allowed configurations that emerge in this way are shown in Figure 3. We note that more configurations might naively be expected to be accessible but cannot be populated by subsequent Auger emissions due to energy conservation in each step. Therefore, when direct double-Auger processes as well as shake-up transitions are neglected, photoexcited ions can only produce ions up to Fe6+. This limitation is due to energy conservation, as the populated levels with the highest energy in the cascade pathways belong to the configuration in Fe4+, labeled 9 in Figure 3. Only photoexcited vacancies lie high enough in energy so that their decay can produce ions in the Fe7+ charge state in this Auger model. The Fe8+ charge state is not significantly populated for any of the photon energies considered here. This is also prevented since vacancies in Fe6+ (configuration 21 in Figure 3) are the highest populated configuration after the decay of a vacancy in Fe5+ (configurations 17 and 18 in Figure 3). Even though a decay to Fe8+ is energetically possibly, this fraction is calculated to be around a millionth of a percent and hence orders of magnitude too low to be significant.
Auger cascades resulting from direct photoionization forming Fe4+ are modeled in a very similar manner as for resonantly excited Fe3+. The Auger cascades that emerge from and holes are modeled independently. In addition to direct and photoionization, direct photoionization of an -shell electron and subsequent Auger processes have also been considered. As can be seen in Figure 3, all holes in Fe4+ (configuration 6 in Figure 3) emit one Auger electron to form Fe5+. However, within the configuration (configuration 5), only the higher-lying levels can undergo an Auger decay to Fe5+, while the low-lying levels radiatively relax into the ground configuration of Fe4+.
The total non-radiative decay widths of the 180 fine-structure levels of the configuration vary from 370 meV to about 550 meV. This is expected to be slightly overestimated due to the non-orthogonality of the underlying orbital basis sets for the initial and final wave function expansions. Within the theoretical accuracy, the total non-radiative decay widths of these -hole levels created by photoexcitation are similar to the widths of vacancies created by direct photoionization, which also vary from 370 meV to about 550 meV. The -hole levels can decay by an Auger process where the hole is filled by a electron, a so-called Coster–Kronig process. This process is much faster than a typical Auger process. Hence, as expected from the Heisenberg uncertainty principle, the associated widths of 3.3–3.7 eV are much larger than those of the -hole levels. These widths were only computed for Fe4+ -hole levels resulting from direct ionization. Since the decay widths of -hole levels in Fe3+ and Fe4+ are almost identical, it is assumed that this also holds for holes. Therefore, we assume that the decay widths of photoexcited Fe3+ levels are within the same range of holes in Fe4+, formed by direct photoionization of a electron in Fe3+.
The cascade model that results from the above considerations gives rise to several thousand fine-structure levels for the intermediate charge states, and hence millions of Auger transitions between those levels. In order to keep the calculations of the Auger transition rates tractable, it was necessary to constrain the size of the Auger matrices. Therefore, all wave functions were computed in the single-configuration approximation. This approach, detailed in Buth et al. (2018), neglects effects due to configuration interactions that become crucial for the description of shake-processes as discussed by Andersson et al. (2015) and Schippers et al. (2016b).
As an additional simplification to make the calculations more readily tractable, one might consider averaging the transition rates between fine-structure levels of the configurations by assuming a statistical population to obtain an average transition rate between configurations as described by Buth et al. (2018). However, such an approach yields results that are very similar to the previous computations by Kaastra & Mewe (1993), which do not reproduce the experimental findings very well. Therefore, we built the full decay tree between fine-structure levels based on the transition rates computed in the single-configuration approximation, while still neglecting radiative losses as they are much slower than Auger processes. Using this approach, we are able to account for the highly non-statistical population of the fine-structure levels of the initial hole configuration due to the photoexcitation or photoionization of Fe3+.
3.2 HFR Calculations
Additional calculations have been performed on a CI level utilizing Hartree–Fock wavefunctions with relativistic extensions (HFR) using the Cowan code (Cowan, 1981). These calculations account for both photoexcitation and photoionization. CI is included in the initial and the photoexcited or photoionized levels. All possible -levels are taken into account. The lifetimes, i.e., the line widths of the core hole resonances, are calculated from the Auger decay rates to various final Fe4+ levels.
For the initial levels the configurations are taken into account, with identical core configurations. Cross sections are calculated for the core excitation from initial level configurations into . Excitations into Rydberg-like () orbitals are not taken into account.
As in the MCDHF calculations for the core excited levels, we calculate the Auger transition rates taking into account the decay into the intermediate Fe4+ configurations and for outgoing or waves and for and waves with . Here, the core is common for all configurations and signifies a free electron. Auger decay channels forming a hole are omitted, due to their low transition rates as confirmed by the computed branching ratios shown in the inset table in Figure 3. The calculated lifetime from the Auger transition rates of the core excited levels results in typical line widths in the range of 200–300 meV.
4 Results and discussion
The measured partial cross sections, , for one- to five-fold ionization of Fe3+ are shown in Figure 1 and are also presented numerically in Table 1. They span about six orders of magnitude, ranging from almost to less than . All measured partial cross sections exhibit a complex resonance structure below the ionization threshold. These resonances arise primarily from excitations located below and slightly above the ionization threshold. According to our calculation, this threshold is located at 762 eV. Verner et al. (1993) obtained a slightly different value of 766.9 eV. We expect our result to be more accurate with an expected uncertainty of only a few eV. Due to the presence of metastable species in the Fe3+ ion beam, the threshold can be expected to be somewhat washed out. The 224 fine-structure levels of the configuration of Fe4+ span an energy range of about 35 eV from approximately 762 to 797 eV. In Figure 1 these are represented by vertical gray bars.
The calculations show that the measured resonance structures are often blends of many resonance transitions from the ground level, and from the metastable levels of the ground configuration, to the different core-hole excited levels. The most prominent feature, which can be discerned in the experimental data, is the fine-structure splitting of about 15 eV that shows up in the two strong peaks between 700 and 730 eV, where the stronger peak at about 711 eV belongs to excitations of electrons.
The resonance structure associated with the () transitions around 870 eV can be seen in all of the ionization channels. They are much weaker than the features associated with excitations, as the photoabsorption probability is lower due to the fewer number of electrons in the shell. Furthermore, the decay widths of core excited states are about a factor 9 larger than the widths of holes, due to the rapid Coster–Kronig process where the hole is filled by a electron. As a consequence, all resonances have a much larger width and hence appear much weaker compared to the direct ionization background. The ionization threshold is expected at 902 eV according to our calculations and at 885 eV according to the work of Verner et al. (1993). Again, we expect our result to be more accurate, with an uncertainty of only a few eV. This threshold cannot be directly seen in the experimental data. All 74 fine-structure levels of the configuration as calculated are shown as gray vertical bars in Figure 1.
The experimental total photoabsorption cross section given by Equation (1) is shown in Figure 2 and compared to the photoionization cross section computed by Verner et al. (1993). The latter includes only direct single-electron photoionization and therefore the resonance features are absent in the computed cross section. At energies above the and resonances the experimental cross section decreases less steeply than the theoretical result. A similar behavior was also observed for Fe+ (Schippers et al., 2017), albeit over a much narrower energy range. Here the deviation between the experimental photoabsorption cross section and the result of Verner et al. (1993) reaches almost a factor of at the highest experimental photon energy of 950 eV. At present, the reason for this discrepancy is not known. One might speculate that the population of metastable levels in the primary ions leads to a change of the photoionization cross section. However, a strong change of the inner-shell ionization cross section upon excitation of the outermost electrons by only a few eV does not seem very likely.
4.1 Photoabsorption Cross Section
Using our calculations, we investigated the effects on our theoretical cross sections due to different populations of the 37 levels of the ground configuration. In each panel of Figure 4, we compare the experimental photoabsorption cross section, shown in blue, with MCDHF and HFR results based on different populations of the fine-structure levels in the ground configuration. These MCDHF results include only photoexcitations into the shells. The HFR results omit contributions from the and shells but also include photoionization of and -shell electrons. The increase of the HFR cross section starting around 760 eV is the contribution from the photoionization of electrons. The respective level populations are displayed in the insets of the panels. In order to account for the uncertainty due to the experimental photon-energy spread and the lifetime broadening, the computed data were convoluted with a Voigt profile, where the full width at half maximum (FWHM) of the Gaussian was chosen as 1.0 eV and a uniform natural line width of eV was assumed. In addition, the calculated spectra were shifted by eV such that the theoretical and experimental positions of the tallest resonance feature at about 711 eV match.
In the top panel (Figure 4a), we assume that only the well separated ground level is populated in the initial ion beam. As a consequence, both the MCDHF and HFR calculations overpredict the cross section, especially for the excitation at about 711 eV. Moreover, the calculated cross sections exhibit more details than the experimental photoabsorption spectrum. Both theories agree very well with each other. However, the and excitations were not included in the HFR calculations and therefore the corresponding resonances are only visible in the MCDHF results. Furthermore, CI between the different configurations slightly reduces the MCDHF cross section, as can also be seen in Figure 5. This partially accounts for the lower peak cross section predicted by our MCDHF results as compared to the HFR results seen in Figure 4.
In Figure 4b we assume the statistical population of the ground level and the first excited multiplet, as seen in the inset. As a consequence, both theories predict that some of the fine structure that is visible in Figure 4a cannot be resolved anymore and that the strongest line becomes wider, while its maximum is drastically lowered, in better agreement with the experiment. The same trend continues, when the next two multiplets ( and ) are included in the statistical mixture, as seen in Figure 4c. Compared to the experimental results, the total theoretical cross sections are in good agreement, though too much fine structure still remains visible in the theory. When the statistical average is extended over all 37 fine-structure levels of the ground configuration, the remaining fine structure also vanishes and only 6 rather broad lines remain, as seen in Figure 4d. Also noteworthy is that the resonance feature is underestimated in this model.
These results show that the assumption of just the ground level being populated is not justified, neither is the assumption of a statistical population of all levels in the ground configuration. Furthermore, a drastic cut in the population, such as in Figures 4b and 4c is also a rather unrealistic scenario, especially since only the ground level is energetically well separated. Therefore, a population that gives clear preference to the ground level but also populates all excited levels of the ground configuration seems more appropriate. For this purpose we chose a Boltzmann distribution at a temperature of 30 000 K with no other justification than the relatively good agreement between the calculated and measured photoabsorption spectra, as seen in Figure 4e. This temperature also seems plausible in view of the electron energies that have been estimated for plasmas in ECR ion sources (Trassl, 2003). At this temperature, the population within any given multiplet is almost statistical, while the population of excited multiplets is suppressed due to their high excitation energies. The result of choosing this distribution and temperature is in good agreement with the experimental results, not only in terms of the maximum value of the cross section but also for the width of the resulting lines. All the following results were computed with this distribution for the population of the 37 fine-structure levels of the ground configuration in the ion beam.
The positions of the photoexcitation peaks also slightly depend on the population of metastable levels in the ion beam. The strongest shift is observed for the line around 722 eV which is a blend of many transitions. Here, the shift between Figures 4d and 4e is about 1.4 eV. For the line at approximately 745 eV, which primarily arises from excitations, the shift is about 0.5 eV. The position of the tallest peak at 711 eV, which is associated with excitations, however, is almost constant, shifting by 0.1 eV at most.
Figure 5a shows the experimental photoabsorption cross section in the -threshold region together with the computed photoexcitation cross section resulting from () excitations. The three lowest lines arise from or excitations while the higher resonance structures are blends of contributions with different principal quantum numbers of the upper levels.
Figure 5b displays the measured and computed cross sections over a larger energy range, that also includes the threshold. The cross sections around the threshold are identical to the ones in Figure 5a, while the computed data for the core excited levels (inset) are convoluted with a Voigt profile with a Lorentzian width eV in order to account for the much faster decay of those states (cf., Sec. 3.1). Again, the lowest three () shells were taken into account. As seen from the inset of this figure, these contributions are also visible in the experimental data.
4.2 Product Charge State Fractions
The product charge-state fractions, i.e., the probabilities of an atom to decay into charge state , can be derived as . Here are the measured partial cross sections and signifies the photon energy. The key feature of the values is that the systematic uncertainty of the absolute cross section scale cancels out. Furthermore, the fractions can be used to calculate the mean product charge state as
[TABLE]
Figure 6a shows the product charge-state fractions for the overall ionization process and Figure 6b the mean charge state (see also Table 1). In addition to the experimental data, which are displayed by small circles, both figures compare our computed results for these quantities (large circles) with the results obtained as a combination of the theoretical cross sections for photoionization by Verner et al. (1993) and the cascade calculations by Kaastra & Mewe (1993) (diamonds).
Here we compute the theoretical product charge-state fractions due either to photoionization or photoexcitation. Because of the above mentioned issues in the computation of absolute photoionization cross sections, we did not add together the contributions from photoionization and photoexcitation.
When considering only photoionization, we calculate the product charge-state fractions using
[TABLE]
where is the cross section for direct photoionization of an electron from subshell vs. photon energy, and the total photoionization cross section is again obtained by summing over all subshells . denotes the fraction Feq+ produced after the removal of an electron from subshell of Fe3+ and is discussed in the next subsection.
The reference list from the paper itself. Each links out to its DOI / PubMed record.
- 1Andersson et al. (2015) Andersson, J., Beerwerth, R., Linusson, P., et al. 2015, Ph Rv A, 92, 023414
- 2Beerwerth & Fritzsche (2017) Beerwerth, R., & Fritzsche, S. 2017, Eur. Phys. J. D, 71, 253
- 3Behar et al. (2001) Behar, E., Sako, M., & Kahn, S. M. 2001, Ap J, 563, 497
- 4Buth et al. (2018) Buth, C., Beerwerth, R., Obaid, R., et al. 2018, J Ph B, 51, 055602
- 5Cowan (1981) Cowan, R. D. 1981, The Theory of Atomic Structure and Spectra (Berkeley: California University Press), atomic-structure code accessible via http://aphysics 2.lanl.gov/tempweb/lanl/
- 6Fritzsche (2001) Fritzsche, S. 2001, JESRP, 114-116, 1155
- 7Fritzsche (2012) —. 2012, CPC, 183, 1525
- 8Froese Fischer et al. (2008) Froese Fischer, C., Rubin, R. H., & Rodriguez, M. 2008, MNRAS, 391, 1828