Online Event Recognition from Moving Vehicles: Application Paper
Efthimis Tsilionis, Nikolaos Koutroumanis, Panagiotis Nikitopoulos,, Christos Doulkeridis, Alexander Artikis

TL;DR
This paper introduces a real-time event recognition system for moving vehicles that enriches streaming data with external info and uses optimized logic programming to identify useful activities for fleet management, demonstrating efficiency on real-world data.
Contribution
It presents a novel online event recognition system combining data enrichment and optimized logic programming for vehicle stream analysis.
Findings
Efficient processing of large-scale vehicle data.
Effective identification of fleet management activities.
System demonstrates real-world applicability.
Abstract
We present a system for online composite event recognition over streaming positions of commercial vehicles. Our system employs a data enrichment module, augmenting the mobility data with external information, such as weather data and proximity to points of interest. In addition, the composite event recognition module, based on a highly optimised logic programming implementation of the Event Calculus, consumes the enriched data and identifies activities that are beneficial in fleet management applications. We evaluate our system on large, real-world data from commercial vehicles, and illustrate its efficiency. Under consideration for acceptance in TPLP.
Click any figure to enlarge with its caption.
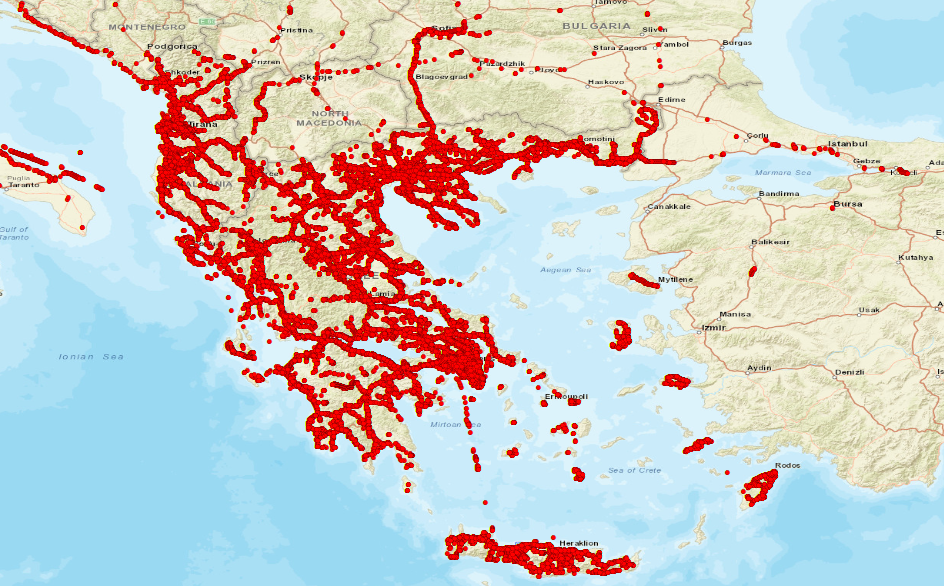 Figure 1
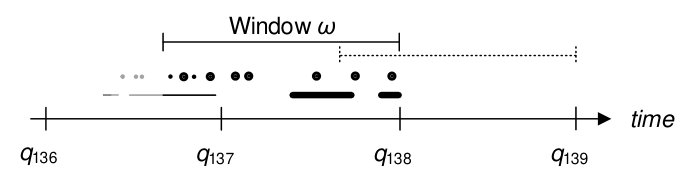 Figure 2
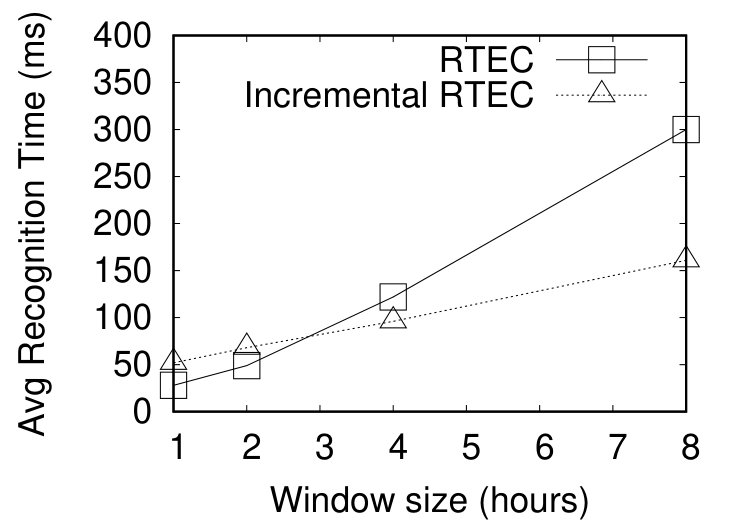 Figure 3
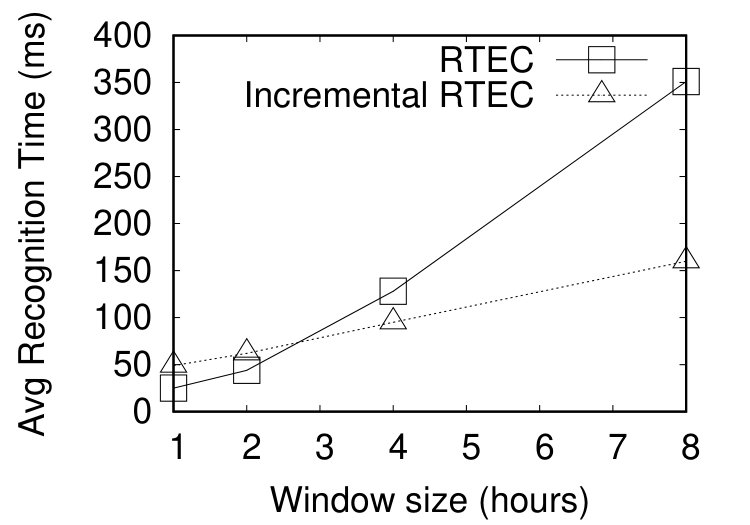 Figure 4
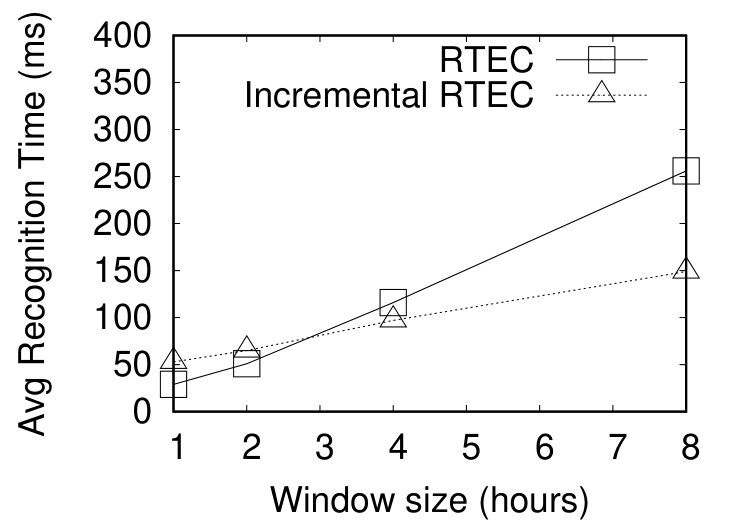 Figure 5
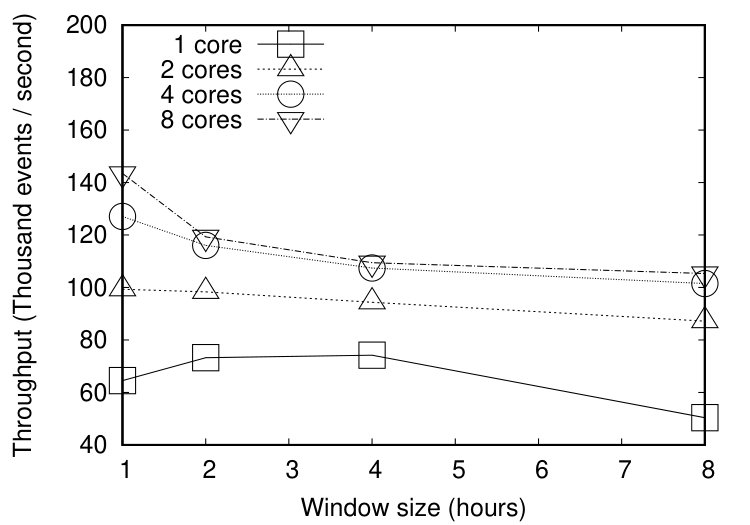 Figure 6
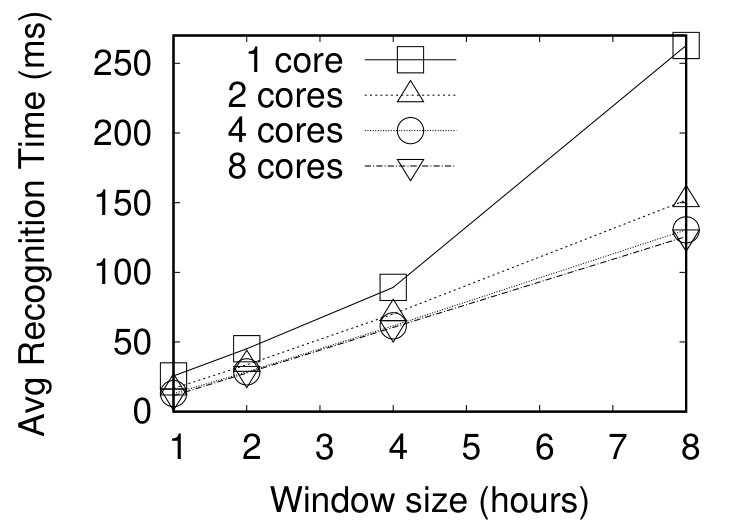 Figure 7
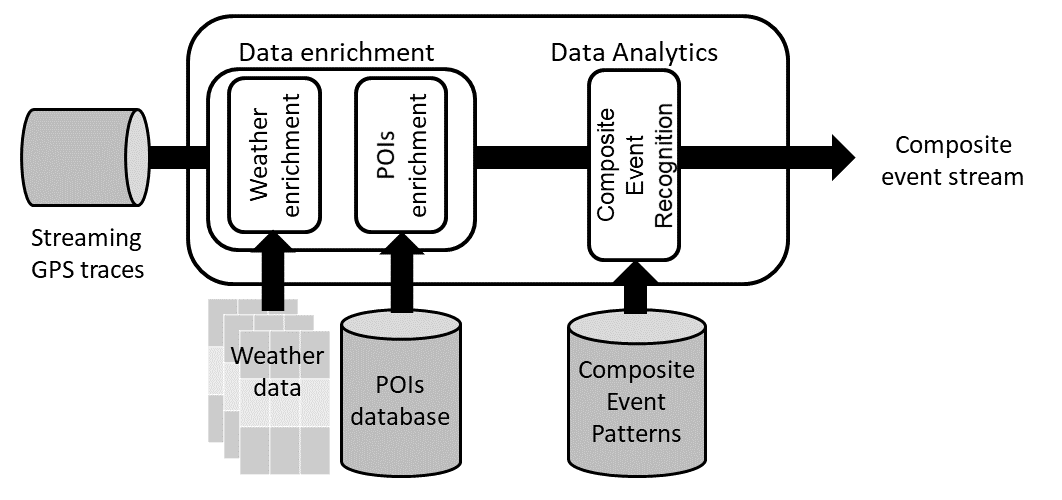 Figure 8
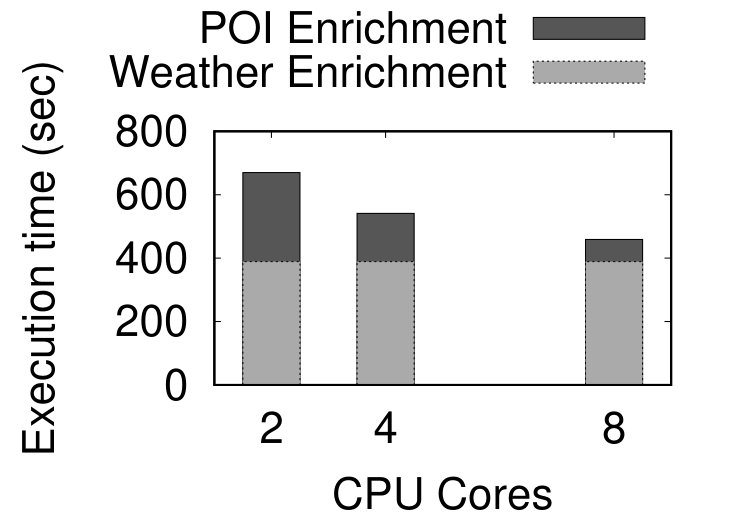 Figure 9
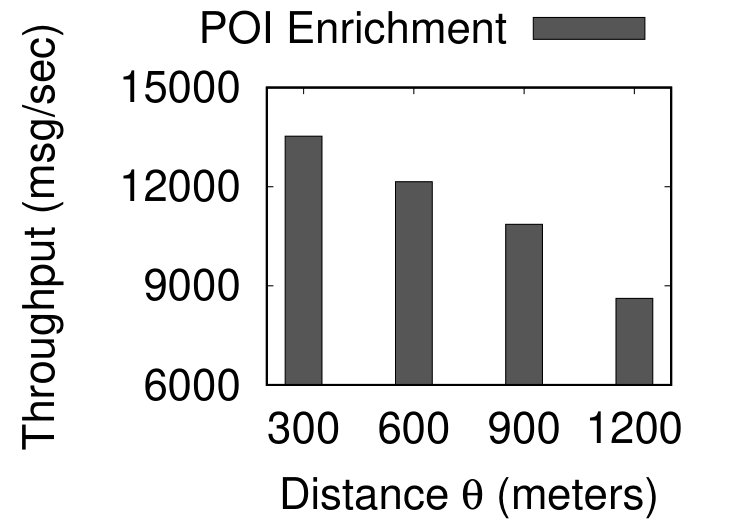 Figure 10
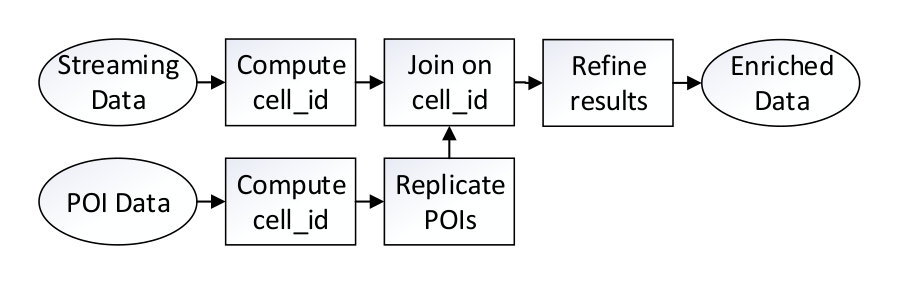 Figure 11
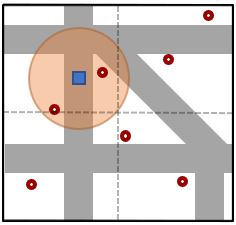 Figure 12
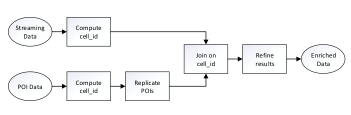 Figure 13
| Events | Description | |
|---|---|---|
| Input | Vehicle is moving with a speed | |
| Vehicle is not moving | ||
| Vehicle accelerates abruptly | ||
| Vehicle decelerates abruptly | ||
| Vehicle turns abruptly | ||
| The level of fuel in tank of vehicle is | ||
| Vehicle is moving in an icy road | ||
| Vehicle is near a gas station | ||
| Output | Vehicle exceeds the user-specified speed limit | |
| Vehicle is potentially moving in a dangerous way | ||
| There is refueling opportunity for vehicle |
| Predicate | Meaning |
|---|---|
| happensAt | Event occurs at time |
| holdsAt | The value of fluent is at time |
| holdsFor | is the list of maximal intervals for which holds continuously |
| initiatedAt | At time is initiated |
| terminatedAt | At time is terminated |
Peer Reviews
No public reviews on file for this paper yet. If you reviewed it on a platform where reviews are public (OpenReview, ICLR, NeurIPS, ICML), you can paste yours below so the community can read it here.
Videos
No videos yet. Explain this paper in a talk, walkthrough, or lecture? Add one.
Online Event Recognition from Moving Vehicles: Application Paper
EFTHIMIS TSILIONIS1
NIKOLAOS KOUTROUMANIS2
\authorbreakPANAGIOTIS NIKITOPOULOS2
CHRISTOS DOULKERIDIS2 \authorbreakAND ALEXANDER ARTIKIS2,1\authorbreak1National Center for Scientific Research ‘Demokritos
Athens
Greece\authorbreak2University of Piraeus
Piraeus
Greece\authorbreak(e-mail: [email protected]
\authorbreak{koutroumanis
nikp
cdoulk
a.artikis}@unipi.gr)
Abstract
We present a system for online composite event recognition over streaming positions of commercial vehicles. Our system employs a data enrichment module, augmenting the mobility data with external information, such as weather data and proximity to points of interest. In addition, the composite event recognition module, based on a highly optimised logic programming implementation of the Event Calculus, consumes the enriched data and identifies activities that are beneficial in fleet management applications. We evaluate our system on large, real-world data from commercial vehicles, and illustrate its efficiency. Under consideration for acceptance in TPLP.
keywords:
Event Pattern Matching, Event Calculus, Data Enrichment
1 Introduction
The European economy relies to a great extent on commercial vehicle fleets. According to the European Automobile Manufacturers Association111http://www.acea.be/statistics/article/vehicles-in-use-europe-2017, there were over 54 Million commercial vehicles in use in Europe in 2015, and this number is growing every year. Commercial vehicles are equipped with devices emitting information regarding their location and operational status, such as speed and fuel level. Fleet management applications collect the information emitted from moving vehicles in order to improve the management and planning of transportation services, and enable informed decision-making. Detecting composite events from such data streams can be beneficial for the drivers of commercial vehicles, since they can be informed about their performance, and even prevent dangerous situations. Additionally, the analysis of data generated by such a fleet of vehicles, can help the owners maximize the performance of the fleet.
However, the data produced by a fleet of vehicles is not always sufficient on its own to support advanced vehicle monitoring. External data sources, such as weather information or proximity to points of interest (POIs), can have a significant effect on the movement of the vehicles. For example, fleet management applications can estimate better the fuel consumption of the fleet, by taking into consideration weather information. Furthermore, informing about the presence of locations of interest in a close distance, such as gas stations, can be a significant help both for drivers and fleet operators. Therefore, the integration of positional information with external data sources allows for improved monitoring.
In the context of the Track & Know project222https://trackandknowproject.eu/, we develop an online fleet management system for the recognition of composite events, that improves the operating efficiency of a commercial fleet. Our system utilizes the GPS (Global Positioning System) traces of moving vehicles along with information emitted by an installed accelerometer device, such as an abrupt acceleration, and information concerning the level of fuel in a vehicle’s tank provided by a fuel sensor. These traces are enriched with weather and POI information by a dedicated component for data enrichment. The enriched data are provided as input to a composite event recognition (CER) component, which is based on the ‘Event Calculus for Run-Time Reasoning’ (RTEC). This is a logic programming implementation of the Event Calculus [Kowalski and Sergot (1986)] with optimizations for continuous narrative assimilation on data streams [Artikis et al. (2015), Tsilionis et al. (2019)]. The contributions of this paper are then the following:
- •
We provide a high-throughput and scalable solution for the enrichment of mobility data with weather information and nearby POIs.
- •
We present a stream reasoning system integrating the component for data enrichment and a logic programming component for recognizing composite events.
- •
We illustrate our approach using large, real-world, heterogeneous data streams concerning commercial vehicles. The evaluation validates the robustness and scalability of the system as well as its capacity to operate in real-time.
The remainder of this paper is organized as follows. Section 2 discusses related work, while Sections 3 and 4 present the main system components. Section 5 presents our empirical evaluation. Finally, Section 6 discusses the challenges that we faced during the system development.
2 Related Work
Data enrichment is considered as part of a larger process known as data integration, which is a challenging topic, in particular in the context of data sources that provide large volumes of data, often in streaming mode, and in heterogeneous formats [Dong and Srivastava (2015)]. Unfortunately, despite the significance of integrating mobility data with weather, there is a lack of publicly available and reusable systems or tools; our work on weather data integration [Koutroumanis et al. (2019)] aims to address this limitation. Regarding the enrichment of GPS traces with static locations, also known as points of interest, the problem is essentially known as distance join, a variant of spatial joins [Jacox and Samet (2007)], where records from two data sets are joined if their distance is below a user-specified threshold. Parallel processing of distance join is typically performed in two ways: (a) by repartitioning both data sets to processors in a way that guarantees the correctness of the result, when partitions are processed independently, or (b) by partitioning one data set and broadcast the other to all processors. The latter technique is usually preferred when one of the data sets is relatively small, and we adopt this method here.
Composite event recognition (CER) systems accept as input a stream of time-stamped, ‘simple, derived events’, such as events coming from sensors of moving vehicles, and identify composite events (CE)s of interest — collections of events that satisfy some pattern. The definition of a CE imposes temporal and, possibly, atemporal constraints on its sub-events (simple, derived events or other CEs). Numerous CER systems and languages have been proposed in the literature. See [Cugola and Margara (2012), Alevizos et al. (2017), Giatrakos et al. (2019)] for three surveys. These systems have a common goal, but differ in their architectures, data models, pattern languages and processing mechanisms [Grez et al. (2019)]. For example, many CER systems provide users with a pattern language that is later compiled into some form of automaton (\citeNPDBLP:conf/cidr/DemersGPRSW07,sasep,DBLP:conf/debs/Schultz-MollerMP09; Apache FlinkCEP333https://ci.apache.org/projects/flink/flink-docs-stable/dev/libs/cep.html). The automaton model is used to provide the semantics of the language and/or as an execution framework for pattern matching. Apart from automata, some CER systems employ tree-based models [Liu et al. (2011), Mei and Madden (2009)]. Again, tree-based formalisms are used for both modeling and recognition, i.e., they may describe the event patterns and the applied recognition algorithm.
Logic-based approaches to CER have also been attracting considerable attention, since they exhibit a formal, declarative semantics, and at the same time support efficient reasoning [Dousson and Maigat (2007), Cugola and Margara (2010), Paschke and Bichler (2008)]. We adopt the ‘Event Calculus for Run-Time reasoning’ (RTEC) for our CER engine [Artikis et al. (2015)], a logic programming implementation of the Event Calculus [Kowalski and Sergot (1986)], that has been used in various application domains, such as maritime monitoring [Patroumpas et al. (2017)]. CE patterns in RTEC are (locally) stratified logic programs. RTEC explicitly represents CE intervals (unlike e.g. \citeNPdousson07,DBLP:conf/debs/CugolaM10,lars-rr17) and thus avoids the related logical problems [Paschke (2006)]. Moreover, and in contrast to state-of-the-art recognition systems, such as the Esper444http://www.espertech.com/esper/ engine and SASE [Zhang et al. (2014)], RTEC can naturally express hierarchical knowledge by means of well-structured specifications, and consequently employ caching techniques to avoid unnecessary re-computations.
Concerning the Event Calculus literature, a key feature of RTEC is that it includes a windowing technique. No other Event Calculus system (including \citeNPchittaro96,DBLP:conf/time/CervesatoM00,miller02,DBLP:journals/dss/PaschkeB08,DBLP:journals/igpl/ArtikisS10,DBLP:journals/tist/MontaliMCMA13) ‘forgets’ or represents concisely the data stream history.
3 Data Enrichment
The architecture of our system for online fleet management is depicted in Figure 1. The main input is streaming GPS traces from a fleet of moving vehicles, typically provided by a fleet management application. As this streaming data flows in the system, it is enriched with external information, mainly weather data and proximity to points of interest. The enrichment process augments the GPS traces with valuable information, which can be exploited for identifying patterns of composite events (CEs) that would otherwise remain hidden. Subsequently, a CER module consumes the stream of enriched GPS positions to identify CEs. Moreover, the system architecture is implemented on top of scalable big data frameworks (e.g., Kafka, Spark), thereby exploiting parallelism for data operations either at the level of a cluster of computers or at the level of a single computer (by means of multi-threading).
In the context of this work, data enrichment consists of two modules: weather data enrichment and point of interest (POI) enrichment. The input is GPS traces from a set of moving vehicles, which contain vehicle id , position and timestamp , as well as other attributes (e.g., speed, acceleration, etc.). The output contains the same set of records, enriched with additional attributes. First, a set of weather attributes, selected according to needs of the application555In this paper, we are mostly interested in events and their relationship to ice-related attributes.. Essentially, for each position and timestamp of a vehicle, we retrieve the values of weather attributes. Second, each position is enriched with a set of POIs that are located within a user-specified distance threshold , i.e., .
3.1 Weather Enrichment
The weather enrichment module operates in an online manner, by processing the GPS traces record-by-record, as they arrive in the stream. Internally, its logic is split in two sub-modules; the Spatio-temporal parser, which is responsible for extracting the position and timestamp from the input record, and the Weather data obtainer, which is responsible for the retrieval of weather attribute values associated with the specific spatio-temporal position .
The Spatio-temporal parser, parses each record of the input data and performs some basic data cleaning operations. It checks the spatio-temporal part both for its existence (null or empty values) and validity (valid longitude and latitude values). Both checks are necessary, as GPS traces are typically noisy and may contain errors. If a value is not valid or missing, then the parser ignores the entire record, and continues with the next one. Each record with valid spatial and temporal information is passed to the Weather data obtainer sub-module, which is responsible of fetching the weather attribute values from the weather data source.
Weather data is provided as GRIB-formatted files that store gridded meteorological data in binary form. GRIB files are provided by the National Oceanic and Atmospheric Administration (NoAA), which contains data from computer-generated, numerical weather prediction models. Weather attributes are represented as values on a 2-dimensional (2D) spatial grid divided into cells, where each cell is mapped to a specific geographical area. We use GRIB files that provide the highest spatial resolution, namely . Each day is composed of 4 GRIB files, which are based on the 4 distinct forecast models that run on a daily basis, with times 00:00, 06:00, 12:00, and 18:00. Each GRIB file contains weather attribute values whose validity is for 3 hours after the forecast, i.e., 03:00, 09:00, 15:00, and 21:00, respectively.
The Weather data obtainer maintains a tree data structure in-memory, organizing the references (paths) of each GRIB file based on their reference time. For example, a file with time 00:00 contains a forecast for 03:00. Given a timestamp , the tree is searched to locate the nearest GRIB file in terms of its reference time. For instance, given a timestamp 05:10, the forecast at 03:00 is considered as nearest in time, rather than the one at 09:00. Then, this file is accessed in order to fetch the value corresponding to the location at hand. Since there is an overhead when opening a GRIB file, a caching mechanism is used for maintaining handles to open files. This is beneficial for sequential requests that are served from the same GRIB file, as repeated open/close operations are avoided, thus saving processing time. For a detailed presentation of the architecture of the weather enrichment module refer to \citeNPDBLP:conf/edbt/KoutroumanisSGD19.
3.2 POIs Enrichment
The POI enrichment is implemented as an Apache Spark Structured Streaming job to improve efficiency through parallelized processing. It takes as input (a) the streaming spatio-temporal data set of moving vehicles, (b) a set of POIs containing their spatial information, and (c) a distance threshold expressed in meters. The POI data set, provided by OpenStreetMap, refers to static points of interest described by their spatial location , name and type of POI. The POI enrichment aims to enrich the spatio-temporal GPS traces of moving vehicles with the information of POIs located at maximum distance from any trace. An example is depicted in Figure 2a, where the blue rectangle represents a vehicle moving through a city’s road network, and the red small circles refer to various places of interest. The circle centered at the vehicle’s location with radius encloses all POIs which are located at maximum distance from the vehicle. Hence, our goal is to efficiently identify these nearby POIs and add them to the trace information of the vehicle.
Essentially, the POI enrichment process evaluates a distance join query over the streaming spatio-temporal data set of GPS traces and the static data set of POIs with a maximum distance threshold . A naive solution to this problem would join the POI data set with the entire streaming spatio-temporal data set, and then filter out the records that have a joined distance higher than . This solution, however, inflicts high computation cost of , where is the number of POIs and is the number of traces in the streaming spatio-temporal data set, thus reducing the efficiency of our solution.
We propose a more efficient algorithm for computing the distance join query, demonstrated in Figure 2b. Our premise is to employ a grid that partitions the spatial space into equally sized cells. All records from both data sets can be easily assigned a cell id, based on their associated spatial information. Since the POI data set is static (i.e. does not change while processing the streaming data set), we start by distributing its records to the available computing nodes, based on their corresponding cell ids. We keep the POI records in the nodes’ main memories to enable fast retrieval later. Then, we start processing the spatio-temporal data set, by distributing every streaming record to the corresponding node, based on the computed cell id. That node performs a join operation between the trace record and all the POI records based on their cell id values. The goal is to evaluate the trace’s distance join result on a single node, thus reducing the communication complexity of the join operation. To this end, we opt to replicate all POI records to nearby cells, located at maximum distance from the POI. This results to a new POI data set where every cell id is associated with all the POIs located at maximum distance from the cell. Hence, the aforementioned join operation is guaranteed to process all candidate results, without needing any additional communication between the nodes. The last step is to refine the results, by filtering out the records that have a joined distance higher than . The computation complexity of this algorithm is significantly reduced to , where is the average number of POIs in a cell, and is the number of traces in the streaming spatio-temporal data set. In the example of Figure 2a, the circle spans through three of the cells. The fourth cell (bottom-right) is located at a distance larger than from the location of the vehicle; by pruning the POIs of that cell, our algorithm achieves higher performance without compromising the correctness of the result.
4 Composite Event Recognition
The enriched data stream from moving commercial vehicles is transmitted to the CER module, in order to recognize various types of vehicle activity. All such activities have been formalized in collaboration with the domain experts of the Track & Know project. Table 1 presents the input and the output of the CER component, i.e. the Event Calculus for Run-Time reasoning (RTEC). In the following sections we present RTEC and illustrate its use for fleet management.
4.1 Run-Time Event Calculus
The time model of RTEC is linear and includes integer time-points. If is a fluent — a property that is allowed to have different values at different points in time — the term denotes that fluent has value . holdsAt is a predicate representing that fluent has value at time-point . holdsFor represents that is the list of maximal intervals for which holds continuously. holdsAt and holdsFor are defined in such a way that, for any fluent , holdsAt if and only if belongs to one of the maximal intervals of for which holdsFor. An event description in RTEC comprises rules that express: (a) event occurrences using the happensAt predicate, (b) the effects of events using the initiatedAt and terminatedAt predicates, (c) the values of fluents, with the use of the holdsAt and holdsFor predicates, as well as other, possibly atemporal, parameters. Table 2 presents the RTEC predicates available to the event description developer.
4.2 Pattern Representation
For a fluent , holds at a particular time-point if has been initiated by an event at some time-point earlier than , and has not been terminated at some other time-point in the meantime. This is an implementation of the law of inertia. The time-points at which is initiated (respectively, terminated) are computed with the use of initiatedAt (resp. terminatedAt) rules. , for example, is a Boolean fluent denoting that a vehicle is moving with a speed greater than a user-specified threshold :
[TABLE]
and are input events, presented in Table 1. is an atemporal predicate recording the numerical thresholds of the patterns — in this case, the user-specified speed threshold of each vehicle in our knowledge base. Such a predicate supports code transferability, since the use of different thresholds in different applications may be realised by modifying only, and not the pattern specifications. Rule-set (1) states that is initiated if a event is reported for vehicle , and the speed of is greater than . Furthermore, is terminated if is moving with a speed less or equal to , or when a event is reported for . By using the initiatedAt and terminatedAt rules of rule-set (1), RTEC computes the maximal intervals for which holds continuously, i.e. holdsFor. This is achieved by first finding all time-points at which is initiated, and then, for each , retrieving the first time-point after at which is terminated. Note that, in this formulation of the Event Calculus, initiatedAt does not necessarily imply that at . (This is similar to the ‘weak interpretation’ of initiation of the Cached Event Calculus, \citeNPchittaro96). Similarly, terminatedAt does not necessarily imply that at . Suppose that is initiated at time-points 100 and 110 and terminated at time-points 125 and 135 (and at no other time-points). In that case holds at all such that .
is useful indicator on its own, but can also be used to define potentially dangerous driving:
[TABLE]
, and are instantaneous input events provided by the accelerometer device installed in each commercial vehicle (see Table 1). is a weather event emitted by the data enrichment module and states that in the location of the road is slippery due to ice. end is a built-in RTEC event indicating the ending points of each maximal interval for which holds continuously. According to rule-set (4.2), therefore, is initiated when a vehicle is engaged in a harsh driving event, such as abrupt acceleration, breaking or cornering, or when there is ice on the road and has speed above the user-specified threshold. is terminated when the speed of vehicle goes below the user-specified threshold, or when it stops moving. is thus useful for driver behavior analysis and safety.
Companies owning commercial fleets place emphasis on fuel consumption. One way to achieve this, is detecting opportunities for refueling. Consider the formalisation below:
[TABLE]
is a spatial relation computed by the data enrichment module (see Table 1), indicating that a vehicle is close to a gas station, which is a type of point of interest. is an instantaneous input event emitted by the fuel sensor of each vehicle. records the tank size of vehicles. According to rule-set (3), our system starts flagging that vehicle should refuel when it is close to a gas station, its speed is above the user-specified threshold (implying uneconomic driving), and the fuel level is lower than half of the tank size. Moreover, we stop flagging the need to refuel when the fuel is more than half of the tank size.
5 Implementation and Empirical Analysis
5.1 Experimental Setup
We evaluated our system on real-world positional data of vehicles, provided by Vodafone Innovus666https://www.vodafoneinnovus.com/, our partner in the Track & Know project, which offers fleet management services. Figure 3 illustrates the geographical coverage of the data, practically covering Greece and some surrounding countries, for a temporal duration of 1 month. The fleet data contains approximately 4M records and is 527 MB in the form of CSV files. We replayed these records, according to their timestamps, in order to simulate a streaming environment. The records are enriched with weather information, acquired by 120 GRIB files with total size 7.4 GB. The POIs were retrieved from OpenStreetMap; we selected only the POIs referring to gas stations which resulted to approximately 140K POIs. The data enrichment module operated on a VM running the CentOs 7.6.1810 operating system, on a hardware with Intel Xeon Processor and 4GB RAM. The CER module operated on a computer with 8 cores (Intel(R) Core(TM) i7-7700 CPU @ 3.6GHz) and 16 GB of RAM, running Ubuntu 16.04 LTS 64-bit and YAP Prolog 6.2.2.
5.2 Data Enrichment
The vehicle position signals were loaded in an Apache Kafka topic, consisting of 6 partitions sorted by the date field. The topic was consumed by the weather enrichment component, and the poll timeout was set to 1 sec777This is the time that defines a batch of messages fetched for processing.. The POI enrichment runs as a separate job, and consumes weather-enriched data that were output in an intermediate Kafka topic, and was configured to use 2 GB of RAM. In this set of experiments, we report on the performance of data enrichment, using total execution time and throughput as main metrics.
Figure 4 depicts the performance results of data enrichment. Figure 4a reports the total execution time for data enrichment when increasing the number of CPU cores. The weather enrichment was completed in 389 sec, corresponding to throughput values of 9,792 messages/sec. Notice that this value is constant in the figure, since weather enrichment does not use parallelization. The cache of the weather data obtainer reached 99.96% hit ratio. This high ratio was expected, since the records are temporally sorted. The POI enrichment results correspond to distance threshold m. As shown in the figure, the total execution time drops when increasing the parallelism from 2 to 8 CPU cores. This result shows that the POI enrichment component can exploit the availability of more CPUs and scale based on the available resources.
Figure 4b shows the throughput of POI enrichment obtained from increasing the value of , while fixing the number of cores to 2. Higher values of result in having more POIs associated with positions of vehicles, as practically defines what is considered as proximity. Also, higher values of imply that a larger spatial area around each vehicle’s position needs to be examined, leading to decreased performance. However, when increasing by a factor of 4, the performance is decreased less than 50%. Hence, our POI enrichment component is efficient for even higher values. Also, it can achieve even better performance by exploiting more CPU resources, as already shown in Figure 4a.
5.3 Composite Event Recognition
In RTEC, the CER process involves the computation of the maximal intervals of fluents. This process takes place at specified query-times . CER at each query-time is performed over the input events that fall within a specified interval, the ‘working memory’ or window . All input events outside the window are discarded and not considered during recognition. This means that at each query-time , CER depends only on the events that took place in the interval . The size of as well as the temporal distance between two consecutive query-times — the slide step (q_{i}-$$q_{i-1}$$) — are user-specified.
Figure 5 illustrates the recognition process of RTEC. Occurrences of instantaneous input events are displayed as dots and those of durative input events as line segments. For CER at query-time , only the events marked in black are considered, whereas the greyed out ones are neglected. Assume that the events marked in bold arrive after . Therefore, two input events are delayed and by using a window size larger than the slide step, these two events are not lost and considered at . In the analysis that follows, we restrict attention to overlapping windows, i.e. windows longer than the slide step.
At each query-time , RTEC computes from scratch the intervals of CEs, without considering the computations of previous windows. In the case of significant delays in the input stream, this simple approach is the best option. However, in cases where CEs are unaffected by delays, computing their intervals from scratch is redundant. To address this issue, we recently developed a process for computing incrementally the maximal intervals of a CE [Tsilionis et al. (2019)]. Consider the first initiation rule of rule-set (4.2) again, and assume that at query-time a delayed arrival of arrived to the CER system or/and a new interval was computed for . In both cases, a new initiation may have to be computed for . To calculate new initiation points, we use the following delta rules (the remaining initiation rules and the termination rules of rule-set (4.2) are handled similarly):
[TABLE]
The superscripts of these rules express the evaluation set of the time argument . In rule (4)(a), is evaluated only over the occurrences that arrived to the CER system between and , i.e. the occurrences in set . The time-points in are examined against all the intervals of overlapping the current window (set ). Rule (4)(b) is similar to (4)(a), but has a small modification which ensures that derivations are not repeated. In this rule, only the intervals computed at are considered for (set ). For the occurrences within the current window that arrived by the previous query-time (set ) are used.
We performed two sets of experiments. First, since the data set is temporally sorted, we evaluated the performance of RTEC without incremental reasoning, on varying window sizes and parallel executions. Second, we injected artificial delays to the data set, to simulate online processing, and thus compared RTEC with and without incremental reasoning. Figure 6 shows the results of the first set of experiments. Initially, we used a single processor to perform CER. Then, we run RTEC in parallel, by launching different instances of the engine, each one operating on a different processing core. Each RTEC instance performed CER for a different set of vehicles. For example, in the case of four processing cores each RTEC instance was responsible for one quarter of operating vehicles. In all sets of experiments the input was the same, that is, there was no data distribution.
We varied the window size from 1 to 8 hours and the slide step was always equal to the size of the window. In the absence of delays, it is redundant to have overlapping windows. Figure 6(a) presents the recognition times of RTEC in CPU milliseconds (ms), while Figure 6(b) presents the throughput. The empirical analysis shows that RTEC is capable of real-time CER even when operating on a single core. Additionally, running RTEC in parallel leads to significant performance gains even without data distribution.
The second set of experiments concerns out-of-order streams where we compared the performance of RTEC and its incremental extension. We injected artificially delays into the data set. We performed three experiments, each time varying the amount of input events being delayed. We selected uniformly 5%, 10% and 20% of the total events to be delayed. We used a uniform distribution for selecting events, since we assume that each event has the same probability to be delayed. In order to mimic reality as much as possible, we used a Gamma distribution to choose the extent of delay. (The Gamma distribution has a shape parameter and a scale parameter .) Thus, a delay small in time has a higher probability to be imposed in a selected event. The average delay time, in all settings, is approximately 8 hours.
Figures 7(a-c), display the average recognition times in CPU milliseconds for windows ranging from 1 hour to 8 hours, and a slide step of 1 hour. As shown in Figures 7(a-c), the incremental version of RTEC outperforms the non-incremental one in the largest windows, i.e. those of 4 and 8 hours. In other words, the performance improvement becomes more profound as the overlap between consecutive windows increases.
6 Discussion
We presented a stream reasoning system for online fleet management. We opted for a separation of activities among different modules. Delegating data enrichment to a separate module allows for the effective integration of spatial reasoning with temporal reasoning for online CER. Additionally, the use of a dedicated module for data enrichment allows to combine heterogeneous data sources in an efficient way. The empirical evaluation on real-world data illustrated the scalability of our system as well as its capacity to operate in real-time.
A challenge that we faced in the development and deployment of our system is the memory leak of various Prolog implementations, such as YAP and SWI-Prolog, on continuous queries. To address this issue, we sometimes had to store the recognised CEs in order to restart the engine, which is suboptimal in online processing.
Similar to other Big Data projects [Artikis et al. (2015), Patroumpas et al. (2017), Artikis et al. (2013)], the datasets of the Track & Know project did not come with a ground truth of CEs. One way to address this issue is to construct the CE patterns in close collaboration with domain experts. This is what we did in Track & Know. However, although the domain experts of the project have some idea about the CEs of interest, the precise conditions in which a CE should be recognized are not always clear. The use of RTEC facilitated the interaction of CE pattern developers and domain experts. Patterns in the language of RTEC were understood, and sometimes directly modified by the domain experts. To facilitate this process further, we have been developing a simple language for RTEC, with the aim of supporting people who are not familiar with the Event Calculus or (logic) programming [Vlassopoulos and Artikis (2017)]. A compiler translates, in a process transparent to the user, a specification in the simple language to an RTEC event description that may be subsequently used for continuous query computation.
To allow for accuracy evaluation, we implemented a way of visualising our recognised CEs by means of videos888See http://cer.iit.demokritos.gr/. Our aim is to enable domain experts offer feedback on our recognised events, i.e. classify them as true or false positives. Using such videos, domain experts were able to perform a preliminary accuracy assessment. The findings of this assessment indicated that some CE intervals ended later than anticipated. This is due to the fact that the position signals of vehicles can be sparse. For example, there are some extreme cases in which there are 24 hours between two consecutive positional signals of the same vehicle, most likely indicating different trips. In some of these cases, the CE was terminated on the signal of the subsequent trip, i.e. the termination was delayed. In order to deal with this issue, we can directly use the ‘deadlines’ mechanism of RTEC, according to which a CE is automatically terminated after a designated number of time-points since the last initiation. A systematic accuracy evaluation based on expert feedback, using the aforementioned visualisations, is part of our current work.
We also aim to refine the manually constructed CE patterns by means of a recently developed technique for semi-supervised learning [Michelioudakis et al. (2019)]. The input of this technique will be the expert feedback as described above, as well as a small set of labels that may be provided with minimal resources by domain experts.
Acknowledgments
This work was funded by European Union’s Horizon 2020 research and innovation programme Track & Know “Big Data for Mobility Tracking Knowledge Extraction in Urban Areas”, under grant agreement No 780754.
The reference list from the paper itself. Each links out to its DOI / PubMed record.
- 1[1]
- 2Alevizos et al . (2017) Elias Alevizos, Anastasios Skarlatidis, Alexander Artikis, and Georgios Paliouras. 2017. Probabilistic Complex Event Recognition: A Survey. ACM Comput. Surv. 50, 5 (2017), 71:1–71:31. https://doi.org/10.1145/3117809 · doi ↗
- 3Artikis and Sergot (2010) Alexander Artikis and Marek J. Sergot. 2010. Executable specification of open multi-agent systems. Logic Journal of the IGPL 18, 1 (2010), 31–65. https://doi.org/10.1093/jigpal/jzp 071 · doi ↗
- 4Artikis et al . (2015) Alexander Artikis, Marek J. Sergot, and Georgios Paliouras. 2015. An Event Calculus for Event Recognition. IEEE Trans. Knowl. Data Eng. 27, 4 (2015), 895–908. https://doi.org/10.1109/TKDE.2014.2356476 · doi ↗
- 5Artikis et al . (2013) Alexander Artikis, Matthias Weidlich, Avigdor Gal, Vana Kalogeraki, and Dimitrios Gunopulos. 2013. Self-adaptive event recognition for intelligent transport management. In Proceedings of the IEEE International Conference on Big Data . 319–325. https://doi.org/10.1109/Big Data.2013.6691590 · doi ↗
- 6Beck et al . (2018) Harald Beck, Minh Dao-Tran, and Thomas Eiter. 2018. LARS: A Logic-based framework for Analytic Reasoning over Streams. Artif. Intell. 261 (2018), 16–70. https://doi.org/10.1016/j.artint.2018.04.003 · doi ↗
- 7Cervesato and Montanari (2000) Iliano Cervesato and Angelo Montanari. 2000. A Calculus of Macro-Events: Progress Report. In Seventh International Workshop on Temporal Representation and Reasoning, TIME 2000, Nova Scotia, Canada, July 7-9, 2000 . 47–58. https://doi.org/10.1109/TIME.2000.856584 · doi ↗
- 8Chittaro and Montanari (1996) Luca Chittaro and Angelo Montanari. 1996. Efficient Temporal Reasoning in the Cached Event Calculus. Computational Intelligence 12 (1996), 359–382. https://doi.org/10.1111/j.1467-8640.1996.tb 00267.x · doi ↗