Sunyaev-Zel'dovich detection of the galaxy cluster Cl J1449+0856 at z = 1.99: the pressure profile in uv space
R. Gobat, E. Daddi, R.T. Coogan, A.M.C. Le Brun, F. Bournaud, J.-B., Melin, D.A. Riechers, M. Sargent, F. Valentino, H.S. Hwang, A. Finoguenov, V., Strazzullo

TL;DR
This study detects the Sunyaev-Zel'dovich effect in a high-redshift galaxy cluster using ALMA, revealing pressure profile characteristics and emphasizing the importance of interferometric methods and galaxy emission subtraction.
Contribution
First SZ detection of a z=2 galaxy cluster with pressure profile analysis in uv space, demonstrating the effectiveness of interferometry and emission subtraction techniques.
Findings
Detected SZ decrement at 5σ significance.
Derived mass constraints consistent with X-ray estimates.
Observed pressure profile consistent with local clusters, with slight central flattening.
Abstract
We present Atacama Large Millimetre Array and Atacama Compact Array observations of the Sunyaev-Zel'dovich effect in the z = 2 galaxy cluster Cl J1449+0856, an X-ray-detected progenitor of typical massive clusters in the present day Universe. While in a cleaned but otherwise untouched 92 GHz map of this cluster, little to no negative signal is visible, careful subtraction of known sub-millimetre emitters in the uv plane reveals a decrement at 5 significance. The total signal is -19036 Jy, with a peak offset by 5"-9" (50 kpc) from both the X-ray centroid and the still-forming brightest cluster galaxy. A comparison of the recovered uv-amplitude profile of the decrement with different pressure models allows us to derive total mass constraints consistent with the 610 M estimated from X-ray data. Moreover, we find no strong evidence for…
Click any figure to enlarge with its caption.
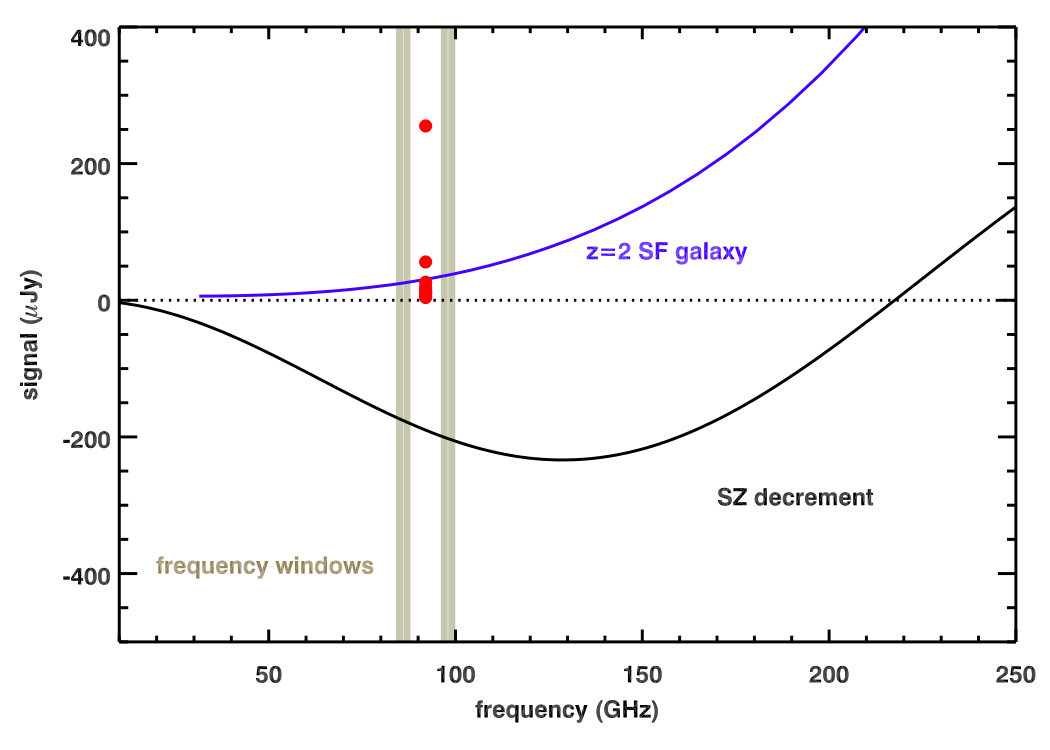 Figure 1
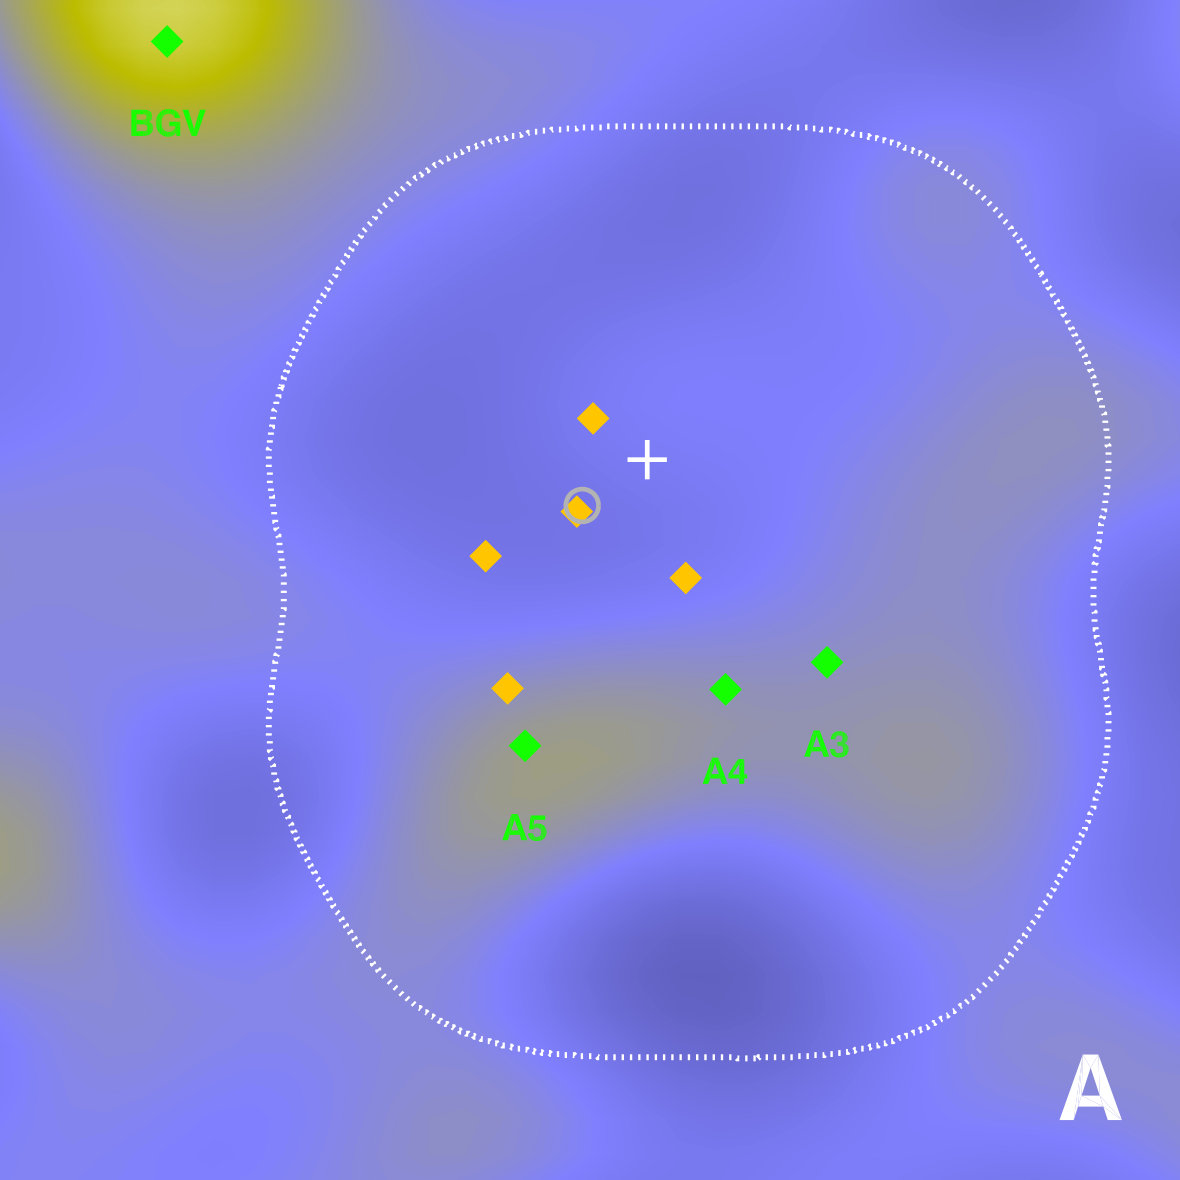 Figure 2
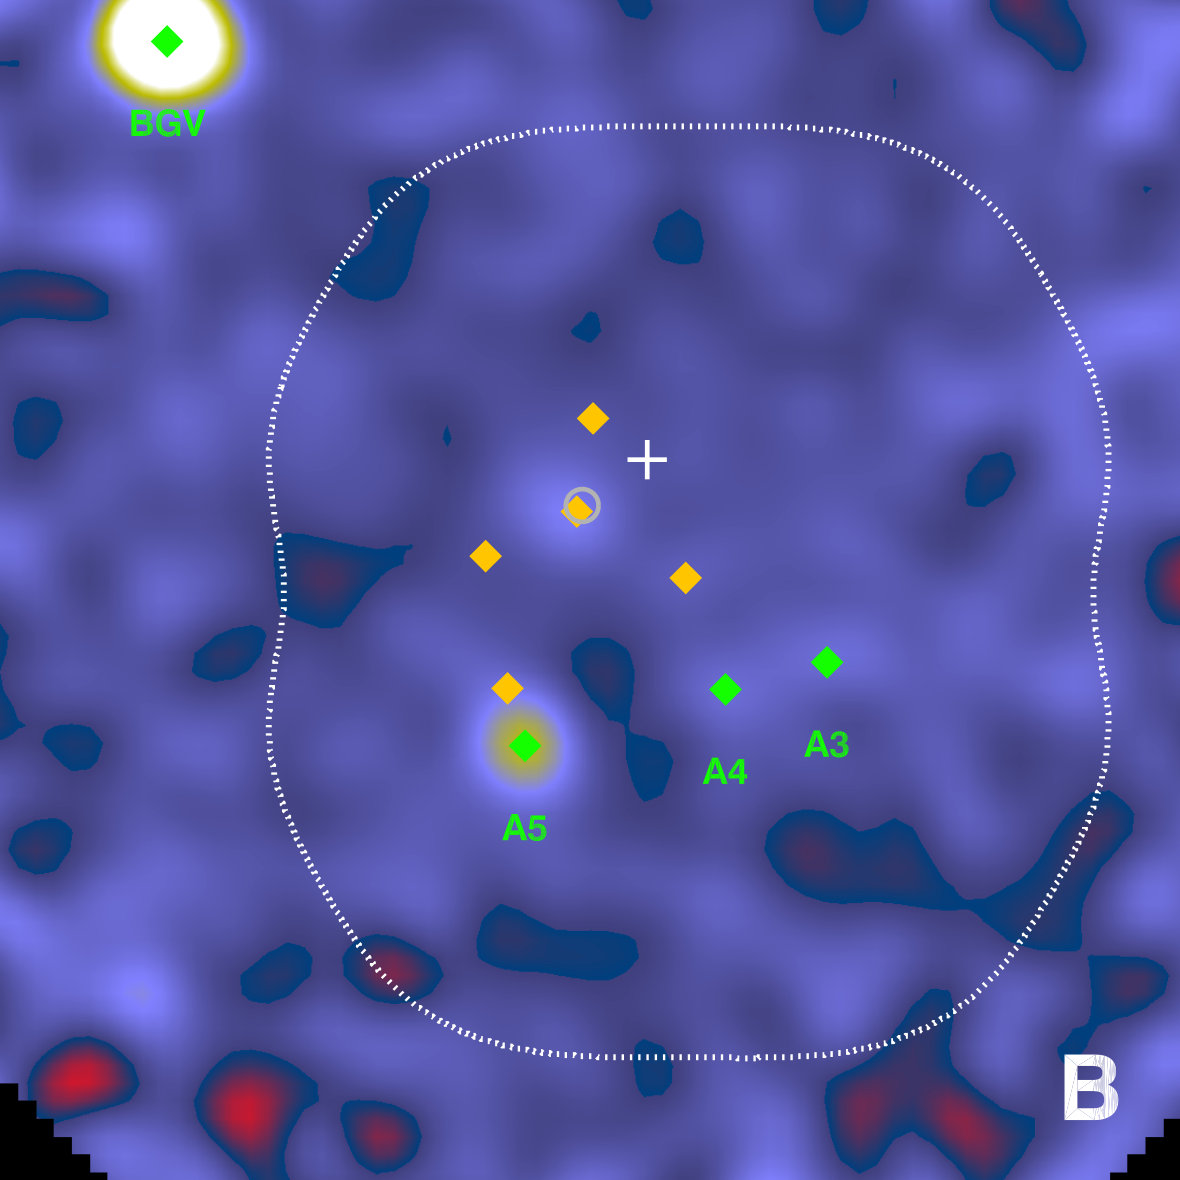 Figure 2
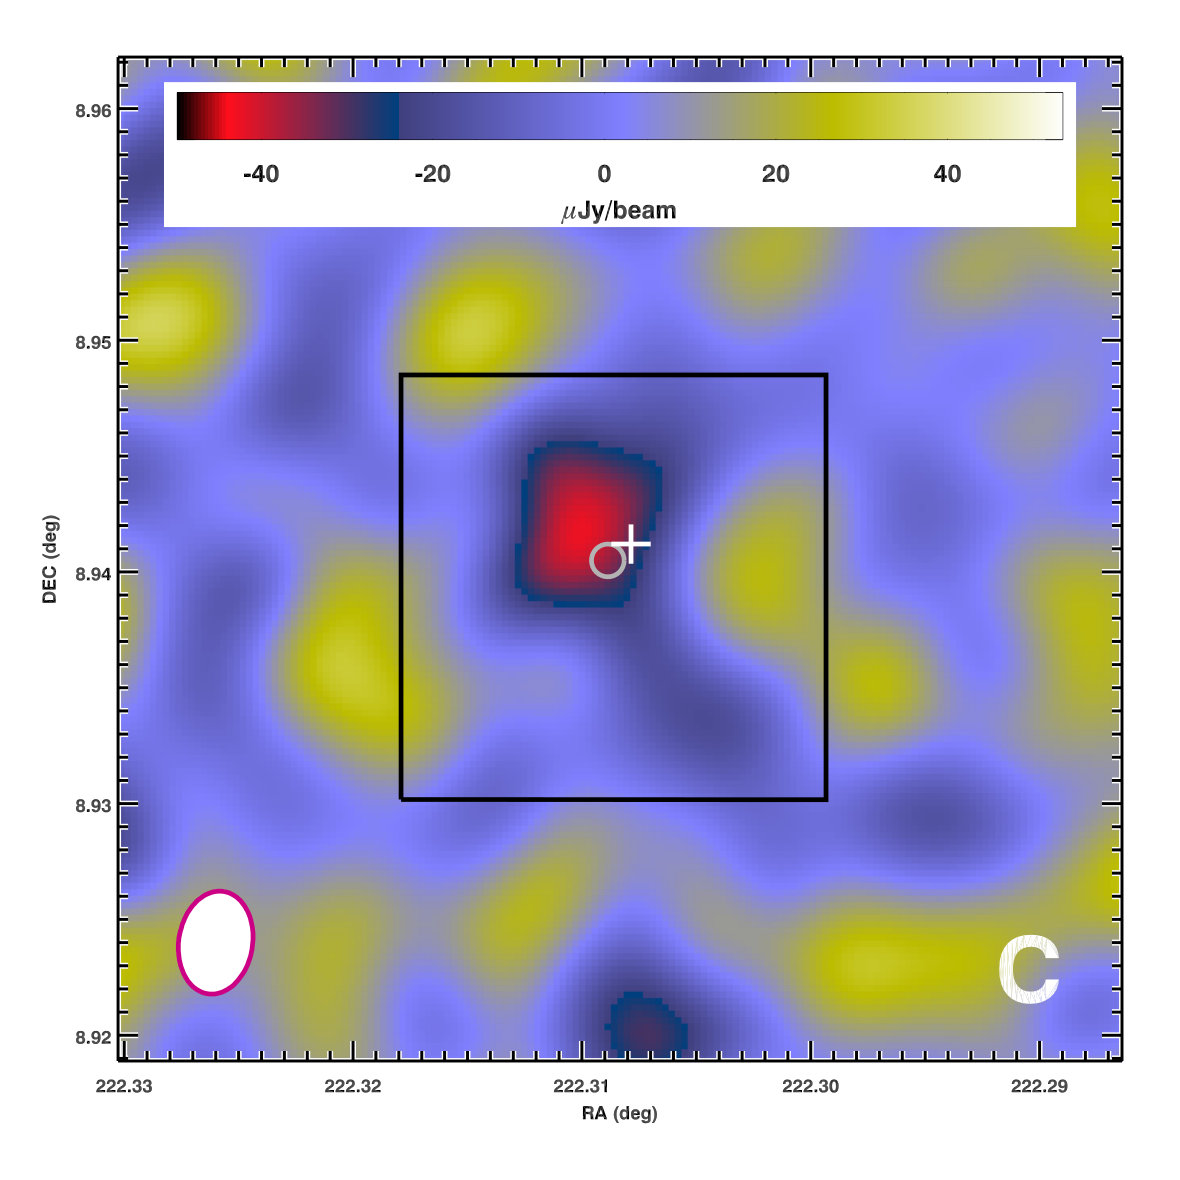 Figure 2
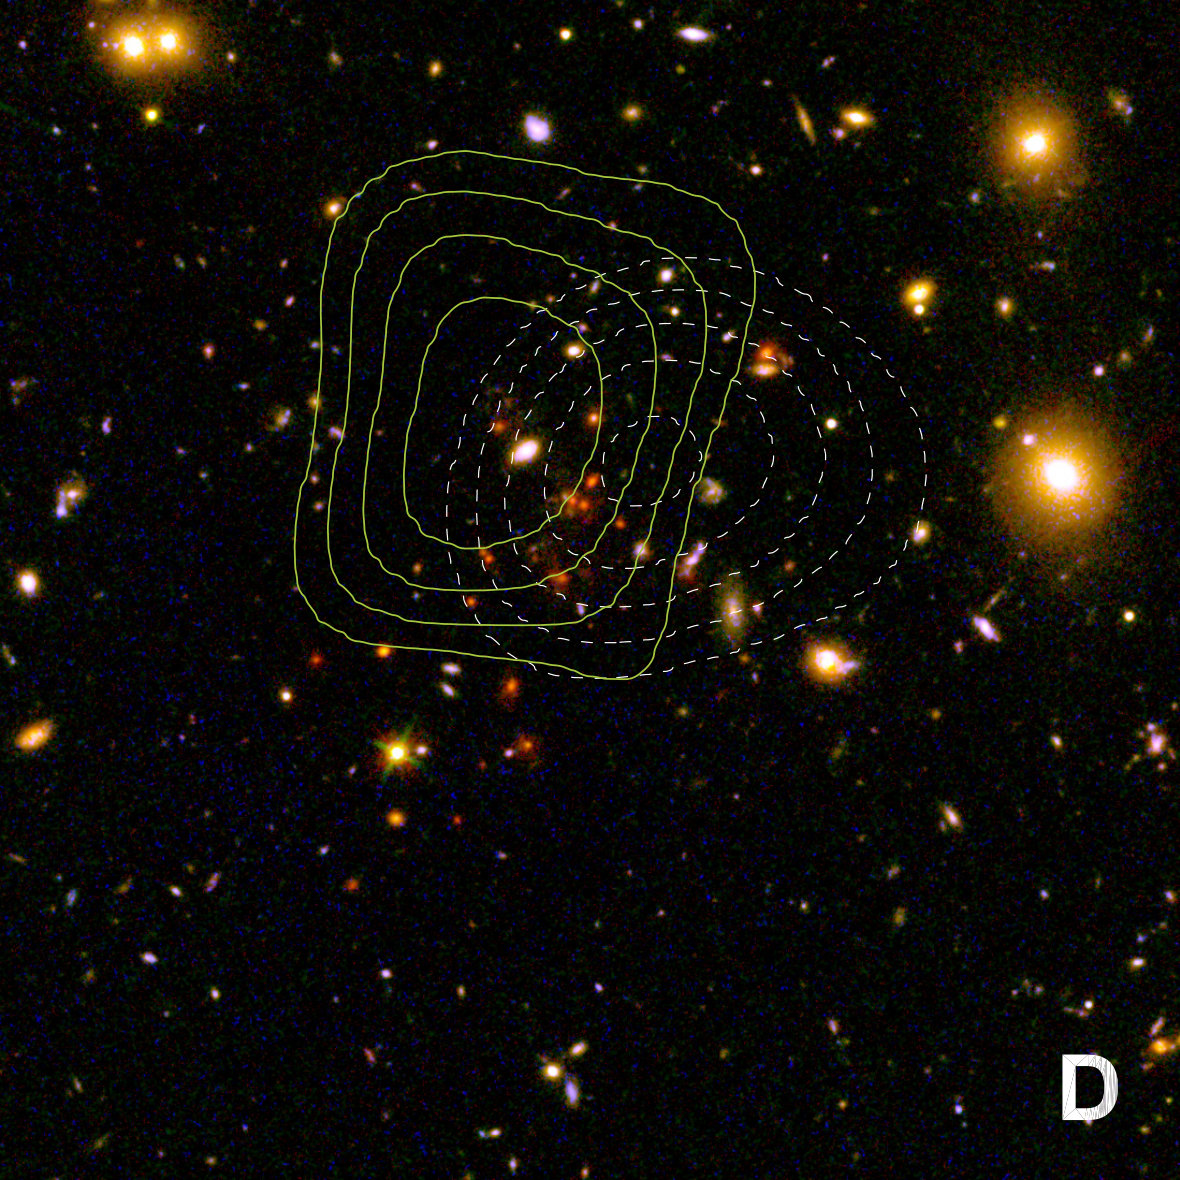 Figure 2
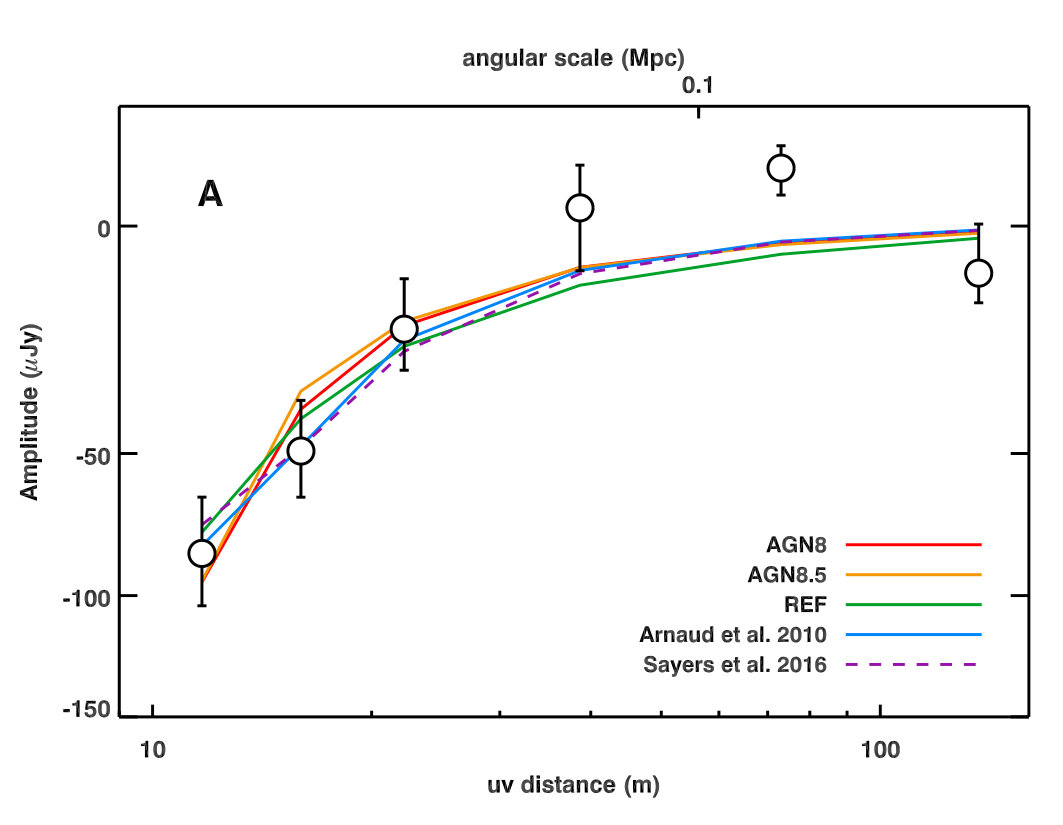 Figure 3
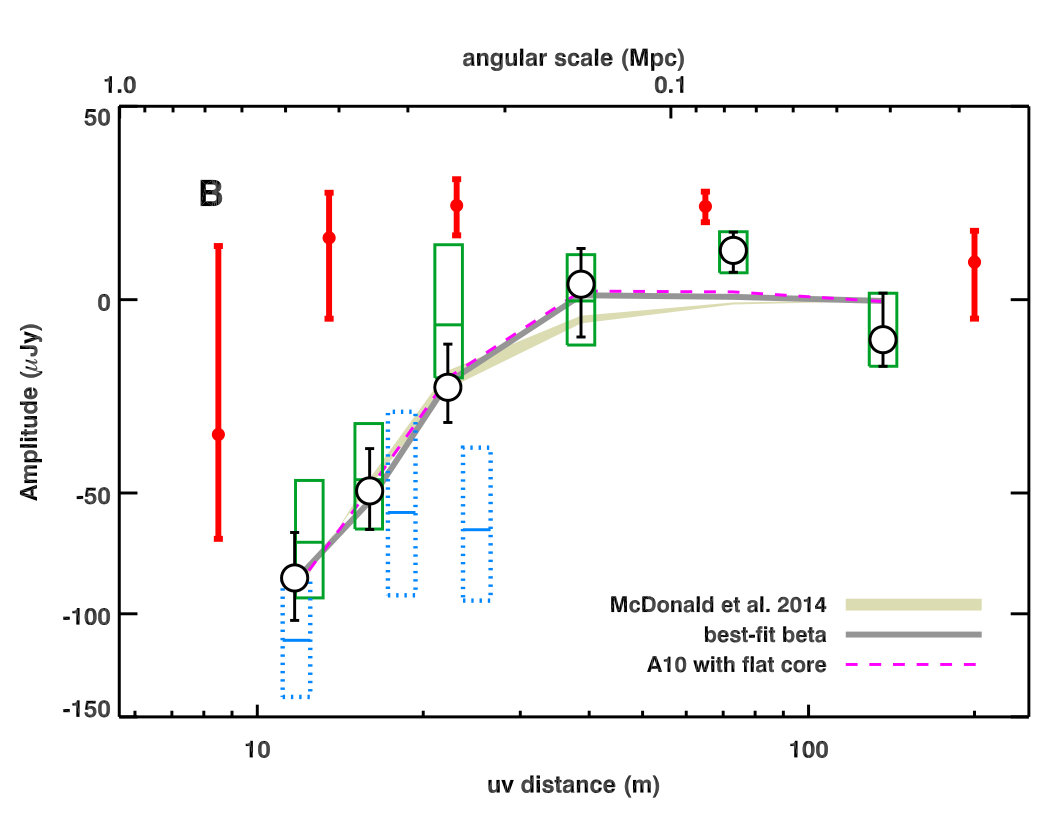 Figure 3
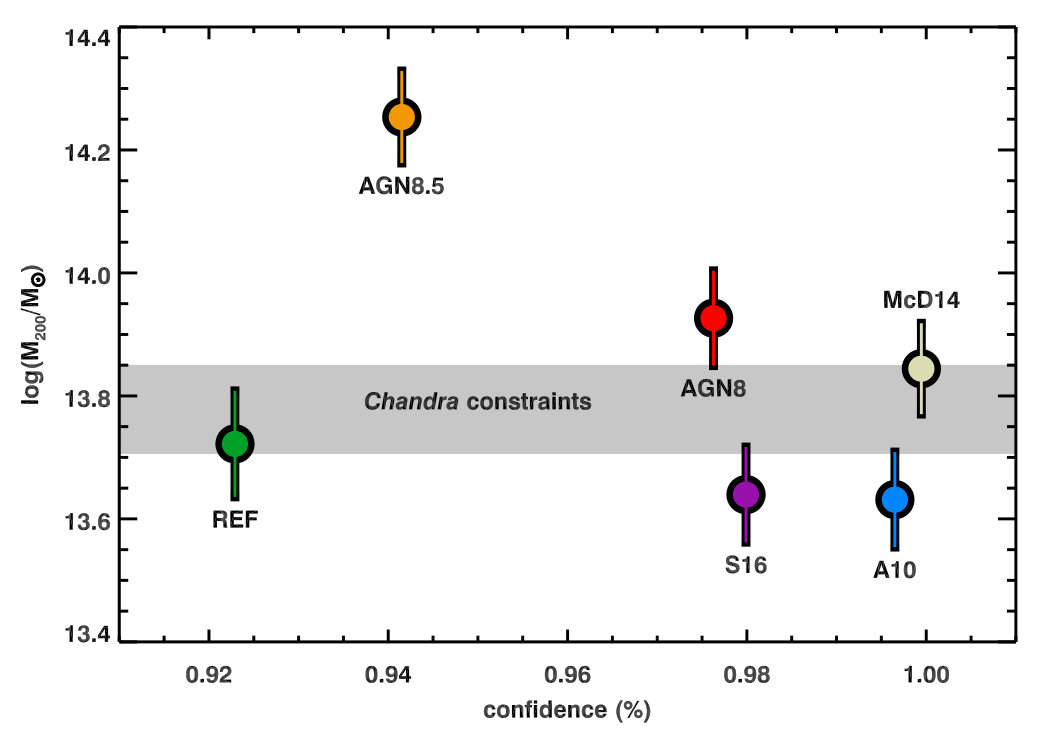 Figure 4
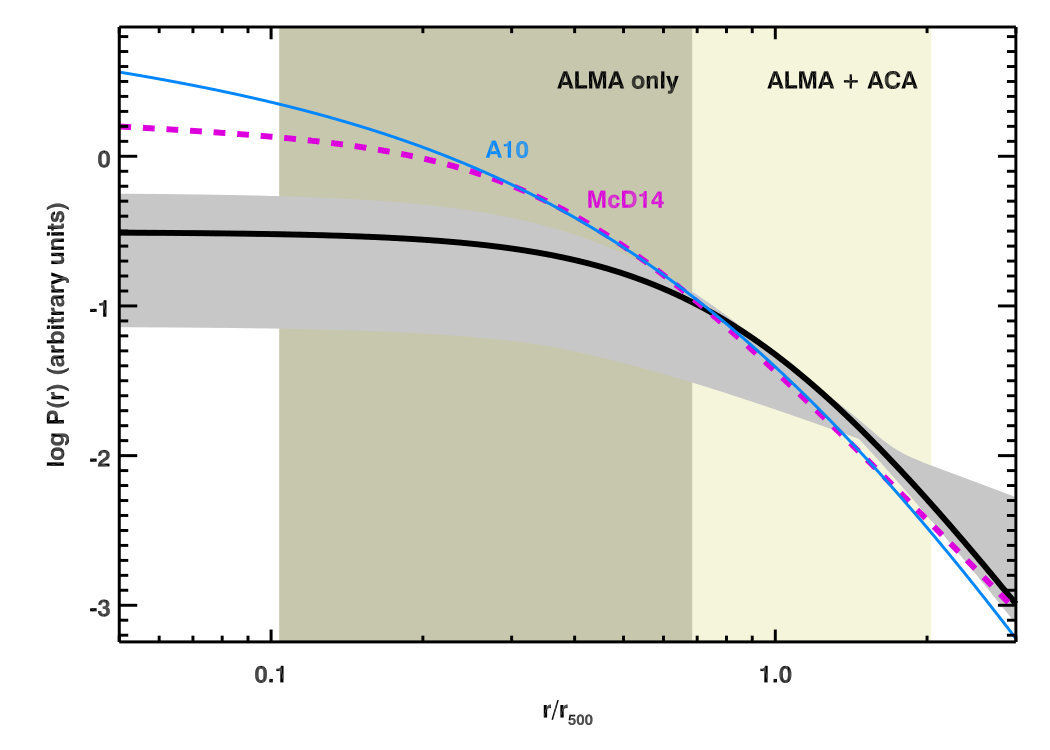 Figure 5
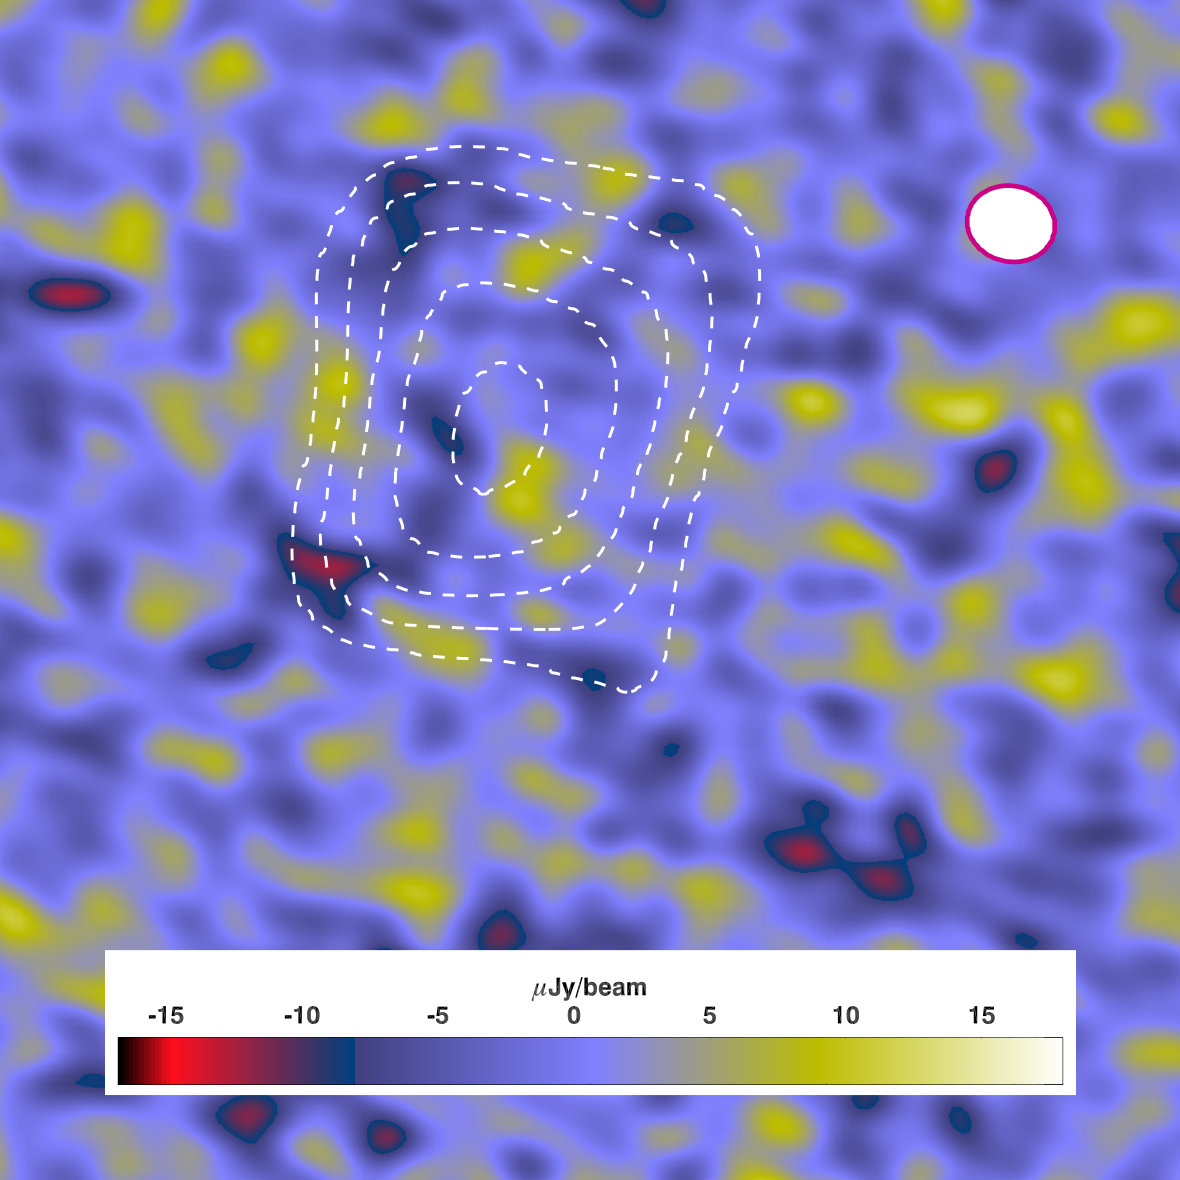 Figure 6
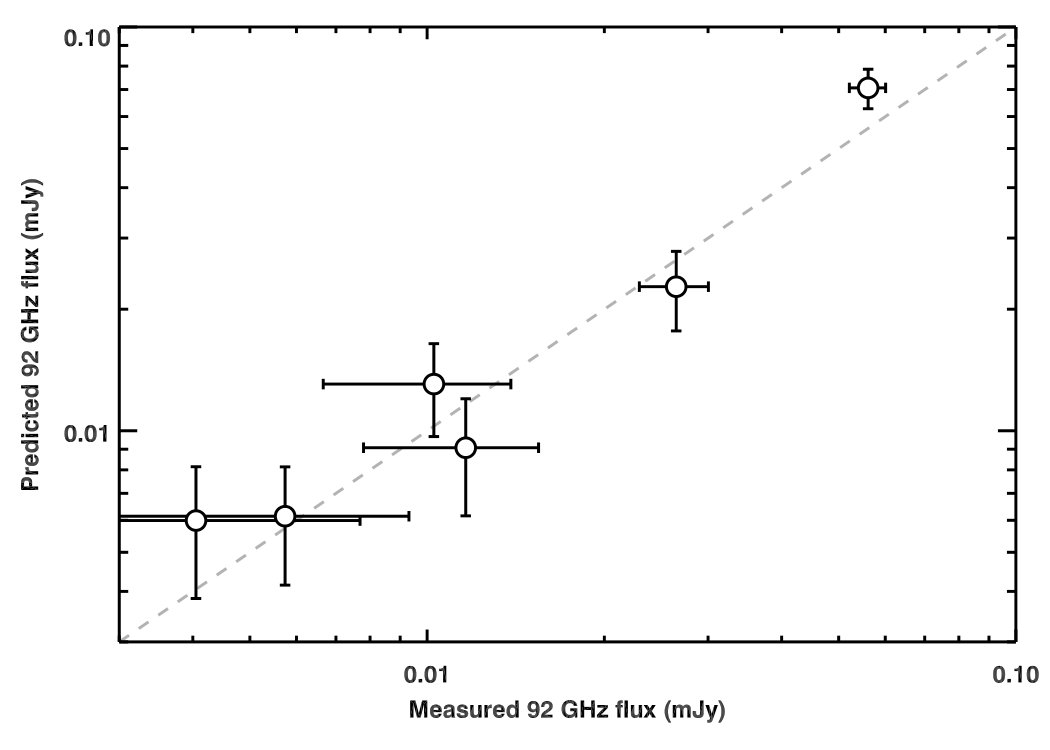 Figure 11
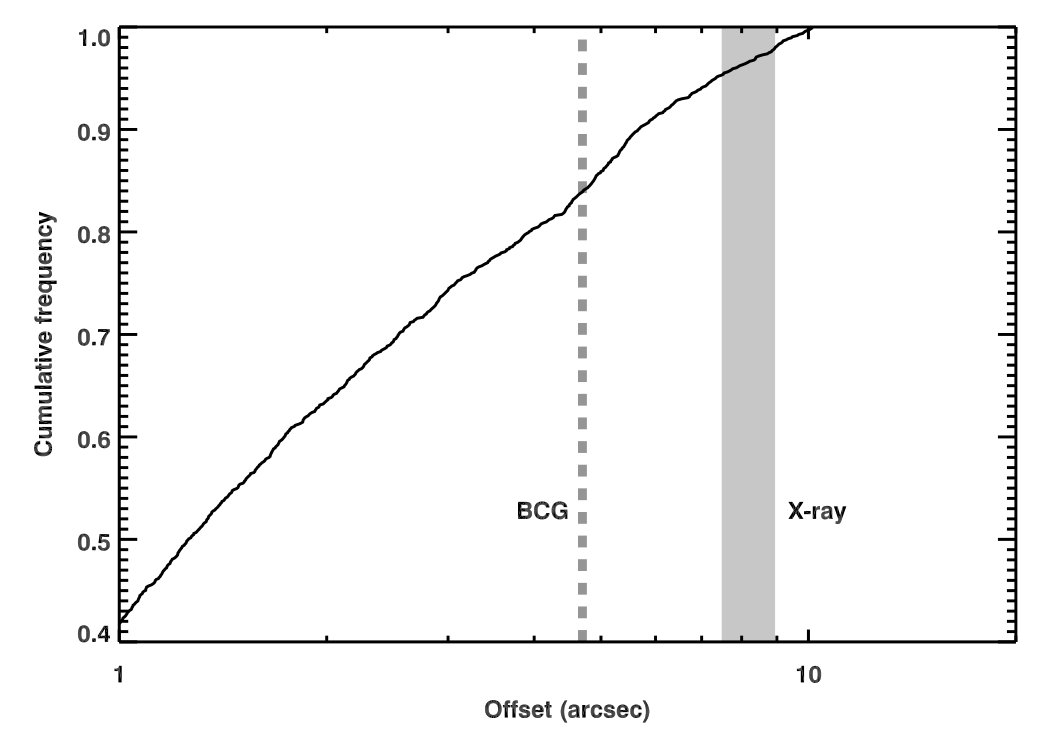 Figure 12
 Figure 13
 Figure 14
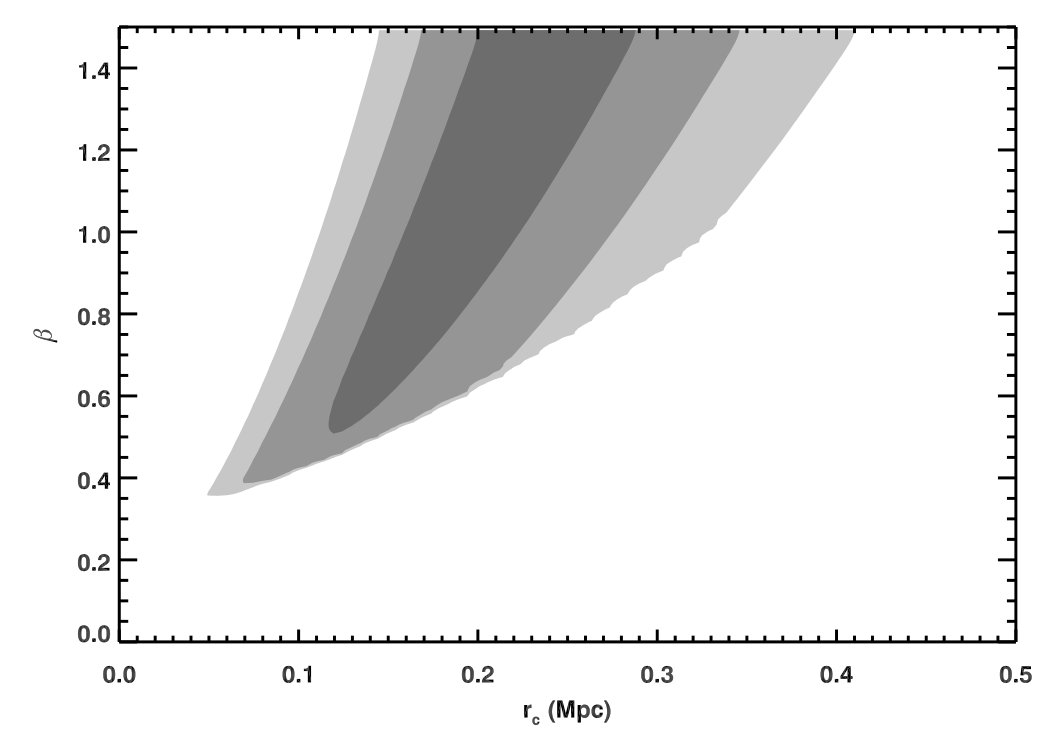 Figure 15
| total time (h) | r.m.s. (Jy/beam) | beam size (”) | |
|---|---|---|---|
| ALMA | 9.7 | 4 | |
| ACA | 49 | 22 |
| ID∗ | R.A. | Dec | Flux | Flux error |
|---|---|---|---|---|
| deg | deg | Jy | Jy | |
| A1+B1∗∗ | 222.30882 | 8.94054 | 26.5 | 3.6 |
| A5 | 222.30963 | 8.93690 | 56.1 | 4.0 |
| 6∗∗ | 222.30991 | 8.93779 | 11.6 | 3.8 |
| BRG | 222.31526 | 8.94785 | 255.2 | 8.5 |
| A2∗∗ | 222.30710 | 8.93951 | 10.3 | 3.6 |
| A3 | 222.30488 | 8.93820 | 14.6 | 4.0 |
| A4 | 222.30648 | 8.93778 | 19.0 | 3.9 |
| 13∗∗ | 222.30856 | 8.94199 | 5.7 | 3.6 |
| N7+S7∗∗ | 222.31025 | 8.93985 | 4.1 | 3.6 |
Peer Reviews
No public reviews on file for this paper yet. If you reviewed it on a platform where reviews are public (OpenReview, ICLR, NeurIPS, ICML), you can paste yours below so the community can read it here.
Videos
No videos yet. Explain this paper in a talk, walkthrough, or lecture? Add one.
11institutetext: Instituto de Física, Pontificia Universidad Católica de Valparaíso, Casilla 4059, Valparaíso, Chile 22institutetext: AIM, CEA, CNRS, Université Paris-Saclay, Université Paris Diderot, Sorbonne Paris Cité, F-91191 Gif-sur-Yvette, France 33institutetext: Astronomy Centre, Department of Physics and Astronomy, University of Sussex, Brighton, BN1 9QH, UK 44institutetext: Cornell University, Space Sciences Building, Ithaca, NY 14853, USA 55institutetext: Max-Planck-Institut für Astronomie, Königstuhl 17, D-69117 Heidelberg, Germany 66institutetext: Humboldt Fellow 77institutetext: Cosmic Dawn Center (DAWN), Niels Bohr Institute, University of Copenhagen, Juliane Maries Vej 30, DK-2100 Copenhagen; DTU-Space, Technical University of Denmark, Elektrovej 327, DK-2800 Kgs. Lyngby, Denmark 88institutetext: Korea Astronomy and Space Science Institute, 776 Daedeokdae-ro, Yuseong-gu, Daejeon 34055, Republic of Korea 99institutetext: Department of Physics, University of Helsinki, Gustaf Hällströpmin katu 2a, FI-00014 Helsinki, Finland 1010institutetext: Department of Physics, Ludwig-Maximilians-Universität, Scheinerstr. 1, D-81679 München, Germany
Sunyaev-Zel’dovich detection of the galaxy cluster Cl J1449+0856 at
: the pressure profile in space
R. Gobat 11
E. Daddi 22
R.T. Coogan 33
A.M.C. Le Brun 22
F. Bournaud 22
J.-B. Melin 22
D.A. Riechers 445566
M. Sargent 33
F. Valentino 77
H.S. Hwang 88
A. Finoguenov 99
V. Strazzullo 1010
We present Atacama Large Millimetre Array and Atacama Compact Array observations of the Sunyaev-Zel’dovich effect in the galaxy cluster Cl J1449+0856, an X-ray-detected progenitor of typical massive clusters in the present day Universe. While in a cleaned but otherwise untouched 92 GHz map of this cluster, little to no negative signal is visible, careful subtraction of known sub-millimetre emitters in the uv plane reveals a decrement at 5 significance. The total signal is Jy, with a peak offset by 5”–9” (50 kpc) from both the X-ray centroid and the still-forming brightest cluster galaxy. A comparison of the recovered uv-amplitude profile of the decrement with different pressure models allows us to derive total mass constraints consistent with the M*⊙* estimated from X-ray data. Moreover, we find no strong evidence for a deviation of the pressure profile with respect to local galaxy clusters, although a slight tension at small-to-intermediate spatial scales suggests a flattened central profile, opposite to what seen in a cool core and possibly an AGN-related effect. This analysis of the lowest mass single SZ detection so far illustrates the importance of interferometers when observing the SZ effect in high-redshift clusters, the cores of which cannot be considered quiescent, such that careful subtraction of galaxy emission is necessary.
Key Words.:
galaxies:clusters:individual:Cl J1449+0856 – galaxies:clusters:intracluster medium
1 Introduction
The study of distant galaxy clusters has experienced a dramatic advance in the past decade, with the discovery of the first clusters (Andreon et al., 2009; Gobat et al., 2011) and the subsequent breaching of that redshift limit into what was then considered then the epoch of protoclusters (Spitler et al., 2012; Yuan et al., 2014; Wang et al., 2016). It is now possible to efficiently identify galaxy clusters at in selected areas of the sky (e.g., Chiang et al., 2014; Strazzullo et al., 2015; Daddi et al., 2017), as well as select relatively large samples up to (e.g., Willis et al., 2013; Bleem et al., 2015). We are thus leaving the discovery stage and are now becoming able to characterise the physical properties of these structures, with an eye toward answering longstanding questions regarding their baryonic content, such as the early evolution of their gaseous atmosphere (i.e., their intracluster medium, or ICM) and its interaction with their stellar component. The injection of energy into the ICM from star formation or active galactic nuclei (AGN) is a long-standing topic (Kaiser, 1991; Ponman et al., 1999; Valageas & Silk, 1999; Tozzi & Norman, 2001). However, high-redshift constraints are difficult to set, except indirectly in special cases (e.g., Valentino et al., 2016), as both common methods for observing the ICM are less effective at higher redshift. X-ray observations, being limited by surface brightness, succumb to the inverse square law. The Sunyaev-Zel’dovich effect (SZ), on the other hand, is in principle distance-independent and has indeed yielded secure detections up to (Brodwin et al., 2012; Mantz et al., 2014, 2018). However, since the thermal SZ effect scales with electron density in the ICM, observations and surveys are still naturally biased towards massive ( M*⊙*) systems. These not only become increasingly rare at higher redshift, but are also typically dominated by well-established quiescent galaxy populations (e.g., Stanford et al., 2012; Newman et al., 2014), i.e., well past the stage where we would expect most of early energy injection to occur.
Cl J1449+0856 (hereafter Cl1449) is a young galaxy cluster at (Gobat et al., 2013) and one of the most distant with detectable X-ray emission. Serendipitously detected as an overdensity of red galaxies in Spitzer/IRAC near-infrared imaging (; Gobat et al., 2011), it is a compact structure that already hosts a significant population of massive, quiescent galaxies (Strazzullo et al., 2013, 2016), but also copious amounts of star formation as well as a kpc Ly emission nebula in its core (Valentino et al., 2016). The presence of a colder ( K) gas phase coexisting with the hot ( K) ICM points to either a cool core (e.g., Heckman et al., 1989), which would be surprising at this early stage in the cluster’s evolution, or feedback and maintenance from galactic outflows powered by either star formation or AGN (Valentino et al., 2016). In terms of mass, Cl1449 is a typical Coma progenitor at and therefore offers a window on the early thermodynamic evolution of typical galaxy clusters as well as the opportunity to study galaxy feedback to the ICM in a developing structure. We thus approach the SZ effect in this cluster from two different perspectives: as yielding an independent constraint on its total mass, providing a test for scaling relations at as well as a clearer picture of its place in galaxy cluster evolution, and as a probe of the thermodynamic status of its diffuse gas component.
Here we present 92 GHz observations of Cl1449 carried out with the Atacama Large Millimetre Array (ALMA) and the Atacama Compact Array (ACA), building upon recent work at millimetre and radio wavelengths (Strazzullo et al., 2018; Coogan et al., 2018, 2019, hereafter S18 and C18, respectively). We describe the observations in Section 2, the analysis of the data in Section 3, and discuss its implication in Section 4, while Section 5 summarises our findings. We assume a CDM cosmology with km s*-1* Mpc*-1*, , and throughout. Stellar masses and star formation rates (SFR) assume a Salpeter (1955) initial mass function.
2 Observations and data reduction
Cl1449 was observed with ALMA and ACA in Cycle 4 under program 2016.1.01107 (PI Gobat). The observations, which are summarised in Table 1, were carried out between November 2016 and March 2017 as single pointings with total observing times of 49h for ACA and 9.7h for ALMA. The data were taken in Band 3, with a central frequency of 92 GHz and a phase centre at R.A. = 14:49:14 and Dec = 8:56:26. Although not probing the peak of the SZ decrement, this frequency was chosen as a compromise to both optimise the total integration time and minimise positive contamination by the redshifted far-infrared emission from cold dust in star forming cluster members or high-redshift interlopers (Fig. 1). Our target of interest being extended, possibly over a scale of several tens of arcseconds, we chose the most compact ALMA configuration to minimise signal loss due to over-resolution (the maximum recoverable scale being 29” in cycle 4) and probe large spatial scales. This is aided by our choice of frequency, generating the widest beam currently possible for both ALMA and ACA. As a result, the ACA and ALMA maps have synthesised beams of and , respectively, with a r.m.s. (root mean square) point-source sensitivity of 22 and 4 Jy/beam, respectively.
We reduce the raw data using the CASA software suite (McMullin et al., 2007) and the script provided by ALMA to generate measurement sets (one per spectral window per array), which were merged into a single UVFITS table per array, for subsequent analysis with the GILDAS111http://www.iram.fr/IRAMFR/GILDAS software suite. We use natural weighting for imaging throughout the paper. These data show, at first glance, little to no SZ signal (Fig. 2, A and B). This is not surprising as the field of Cl1449 is overdense in FIR sources, both within the cluster and in the background (S18; Smith et al., 2019). Despite our choosing a low frequency to mitigate the problem, the combined flux of high-redshift dusty sources is thus sufficient to fill the SZ decrement. We therefore subtract, from the data, point sources at the positions of 9 known FIR emitters (Table 2). This is done on visibilities, i.e., in space. To determine the positions and fluxes of the sources, we use higher-resolution ALMA 870 m and CO(4–3) observations of Cl1449 (described in C18). We first measure their fluxes in the higher-resolution 92 GHz ALMA data, using only visibilities with uv-distance (; hereafter uv) of m, i.e., considering only small spatial scales. These fluxes do not change significantly if we adopt a more stringent cut, such as m (corresponding to 100 kpc). The sources are then subtracted from both the ALMA and ACA 92 GHz data (this time over the whole uv range), at the same fixed positions. In both cases we model them as point sources, since the beams are large compared to the sizes found in C18. Where possible we model and subtract the sources by groups of 4, iteratively from brightest to faintest, to minimise contamination. As a sanity check, we also compare the recovered fluxes to the 92 GHz expectations from Magdis et al. (2012) spectral energy distribution (SED) templates, finding consistency (Fig. 7). A merged ALMA+ACA map of the resulting data is shown in Fig. 2 (C), which shows a noticeable negative signal. Since only galaxies detected in either ALMA continuum or line emission maps were subtracted from the ALMA and ACA observations, some residual positive signal from below-threshold faint and/or low-mass galaxies might be still present in the data. The amplitude, and significance thereof, quantified in Section 3 can thus be considered as conservative.
3 Analysis
For both the ALMA and ACA data we extract fluxes by fitting, in bins of uv, the complex visibilities with a point source using the UV_FIT task GILDAS. We choose the point-source model for simplicity, as it corresponds in space to , where is the position of the source with respect to the phase centre and are here in units of cycles/distance. At phase centre, this is equivalent to averaging visibility amplitudes within the chosen uv range. However, we give in metres throughout the text for convenience, using the central frequency to convert these coordinates into distances. We first perform the fit in a large bin of m, leaving the offset free to determine the location of the peak of the signal, then extract fluxes at fixed position in uv bins of 6–13.5 m, 13.5–18.75 m, 18.75–25.5 m, 25.5–50 m, 50–100 m, and 100–300 m. We do not take the formal errors on the point-source fit as uncertainties to the signal in each uv bin, but instead use the r.m.s. noise as measured in each bin with a point-source fit at randomised large offset positions. This yields slightly larger error bars on average. The resulting uv-amplitude profile, shown in Fig. 3, displays a negative signal in the m range, i.e., at angular scales kpc. When combining ALMA and ACA visibilities, the total signal over all angular scales is Jy, with a significance of 5.3. Including the errors on the fluxes of subtracted sources, weighted by their positions with respect to the best-fit pressure model (see Section 4), would conservatively add another 4 Jy in quadrature to the uncertainty, which does not strongly affect the level of significance of the SZ detection. Prior to the subtraction of positive sources, on the other hand, the SZ signal is only Jy, i.e., is almost entirely filled, with only the shortest uv distances providing any tentative hint of a SZ decrement. If, on the other hand, we only remove sources which are either known to be interlopers or have not been conclusively proven to be at the cluster’s redshift (i.e., A3, A4, A5, and BRG in Table 2), a signal is marginally detected at Jy. The filling of the decrement by confirmed cluster members thus amounts to 35% of the signal, possibly more if either one of the unconfirmed sources (A4 and A5) is associated with the cluster. Assuming that Cl1449 is representative of its halo mass range and redshift, this test can be understood as an ideal unsubtracted case where no bright FIR interlopers are present along the cluster’s line of sight. However, we currently have no reason to think that the field of Cl1449 is particularly overdense in FIR sources with respect to other, as-yet undiscovered clusters of its size and epoch. We also note a slight tension between the ALMA and ACA profiles within their range of overlap (Fig. 3, B), with the latter showing more decrement than the former. This cannot in principle be explained by differences between the two instruments, as simulated observations (see Section 3.1) would rather suggest an opposite trend than the one observed, and might perhaps be due to a calibration issue. On the other hand, the significance of this difference is small enough (1.5) that it can safely be attributed to noise.
Cl1449 had previously been observed at 31 GHz with the Combined Array for Research in Millimeter-wave Astronomy (CARMA). This observation, which has a r.m.s. noise of 90 Jy/beam, did not yield a detection aside from some positive emission. Here we revisit the CARMA data and perform a similar point-source subtraction (Appendix C) as discussed above. We find a loose constraint for the SZ signal of -360 Jy at 3, which is certainly consistent with the expectation of -32 Jy from the 92 GHz data when assuming a standard spectral shape. On the other hand, Mantz et al. (2014) report a secure detection of the similar-redshift cluster XLSSU J021744.1-034536 (hereafter XLSSC 122) with the same instrument and central frequency, but a 68% larger integration time, matching its much larger mass.
The peak of the weighted-average ALMA+ACA signal is offset from the phase centre by ”, which translates into a separation of 4.7” from the forming brightest cluster galaxy (BCG) and 9.5” with respect to the peak of the X-ray emission, i.e., the putative centre(s) of mass of the cluster (Fig. 2, panels C and D). Interestingly, Mantz et al. (2014) also report an offset between the SZ signal and the BCG of XLSSC 122, which is of comparable amplitude when accounting for the different beam sizes of both datasets. That detection is consistent across different observations (Mantz et al., 2018) and thus rather unlikely to be a product of noise. Offsets of this amplitude between either the BCG or X-ray peak and the SZ centroid are not unexpected, especially in clusters that are in a unrelaxed state (e.g., Zhang et al., 2014) as we would expect Cl1449 to be given its relative youth, and are commonly observed in high-redshift clusters (e.g., Brodwin et al., 2016; Strazzullo et al., 2019). We perform a Monte Carlo simulation to estimate the significance of this offset (see Appendix B), subtracting the combined astrometric uncertainty of ACA/ALMA and Chandra in quadrature. We find that the difference between the SZ peak and the BCG positions is well within the normal variation of the simulation, while the offset between the SZ and X-ray peaks falls within the top 1.5% of realisations, corresponding to a significance of at most 2.4. We therefore still cannot discount the possibility that this observed discrepancy between the peaks of the SZ and X-ray signals is simply due to random noise.
3.1 Modelling
To investigate the characteristics of the ICM in Cl1449 and link the observed SZ signal to actual physical properties of the cluster, such as total mass, we fit the uv-amplitude profile extracted from the ALMA and ACA data to a range of models with freely varying amplitudes. We first consider several models of the electron pressure profile of the ICM based on a generalised Navarro-Frenk-White functional form (GNFW; Nagai et al., 2007) with fixed parameter values:
the theoretical median profiles from Le Brun et al. (2015, hereafter LB15) based on cosmological hydrodynamical simulations, with different levels of feedback from AGN. In that paper, they are referred to as REF, AGN 8.0, and AGN 8.5. The last two, as the names suggest, include a prescription for AGN feedback with increasing intensity, while the REF model does not.
the empirical Arnaud et al. (2010) profile (hereafter A10), derived from local M*⊙* galaxy clusters. This is also the profile used by Mantz et al. (2018) to fit the SZ signal of the cluster XLSSC 122 and thus allows for direct, easy comparison with both this study and the low-redshift universe. For completeness, we also include the empirical profile from Sayers et al. (2016, hereafter S16), which is based on A10 but with a different outer slope. We adopt as given in that paper, but note that S16 also find a mass and redshift dependence to the slope which, for Cl1449, would correspond to its A10 value.
the empirical “high-z” profile from McDonald et al. (2014, hereafter McD14), which is based on a sample of , >$$10^{14} M*⊙* galaxy clusters observed with the South Pole Telescope. It differs from the A10 profile mainly by being flatter (i.e., having less pressure) at small radii. We consider both the cool core and non-cool core versions of this profile.
For each model we create a map of the intrinsic signal by projecting the profile on the plane of the sky at the coordinates of the cluster, including an average Compton-y background of derived from the 25 deg2 simulated maps described in LB15. For simplicity all models are spherical, i.e., axisymmetric when projected. We also consider the contribution of a gravitationally lensed infrared background to the decrement. However, we estimate it to be minute (%; Appendix D) due to a combination of low halo mass, decreasing lensing efficiency at higher redshift, and low 92 GHz background density. We use the 2D models as inputs for noise-free simulations of ACA and ALMA observations using the simalma task in CASA, taking care to adopt the same integration times and hour angles as with the data. We then compare the model and data visibilities, merging the ALMA and ACA deviates as the last step. While we keep the GNFW parameters fixed to the various models’ values, we let the mass vary freely. However, while the models are given in function of , our previous works (Gobat et al., 2011; Valentino et al., 2016) instead discuss the “total” mass . We here therefore extrapolate from , assuming that the mass distribution follows the GNFW profile. The fits of the A10, LB15, S16, and McD14 models to the observed uv-amplitude profile are shown in Fig. 3.
Additionally, we also attempt a parametric fit using the simpler -model historically used to describe the X-ray luminosity profiles of galaxy clusters (Cavaliere & Fusco-Femiano, 1978), leaving both the core radius and the index free to vary. For practicality, in this case we fit the ALMA and ACA visibilities with the forward Fourier transform of each -model sampled at the same positions as the data. At our signal-to-noise ratio (S/N) this is essentially equivalent to the full simalma model (see Appendix E), and allows us to explore the parameter space of the models more rapidly and at little to no detriment to precision.
4 Results and discussion
We find that the McD14 profile matches the observed data best, as determined by its value, followed by A10 and the AGN-feedback LB15 models with only the REF one falling below the 2 confidence level. Most suggest total cluster masses that are consistent with the Chandra constraint of M*⊙* (Valentino et al., 2016) (Fig. 4), i.e., at least a factor 2 below the limit of typical SZ surveys at any redshift (Bleem et al., 2015; Planck Results, XXVII; Hilton et al., 2018). Among the various models considered, only AGN 8.5 yields a higher mass of \sim$$1.8\times 10^{14} M*⊙*. In this case, the somewhat higher value is unsurprising since, in the models, the gas fraction decreases with increasing AGN feedback as more material is ejected, thereby requiring a higher mass to reproduce the same integrated signal. Overall, the constraining power of the observed uv-amplitude profile with respect to the pressure model is somewhat limited, especially at large scales/small baselines where the GNFW models appear to be equivalent to one another, in part due to the relatively modest S/N of the data. Of the fixed-parameter models, only the McD14 one fits noticeably better, at intermediate uv. We also note that the profile can be reproduced best with a -model (Fig. 3, B), which is unsurprising as it has two additional free parameters. However, owing to parameter degeneracy (see Appendix F, Fig. 11), the constraints it provides remain loose as well, with . Nevertheless, we note that the core radius is consistently large, of the order of the (putative, X-ray derived) of the cluster whereas, by comparison, the galaxy density profile has kpc (Strazzullo et al., 2013). Consequently, the best-fitting profiles are essentially flat at (i.e., in the inner kpc; Fig. 5).
This is due to the apparent lack of power of the observed profile at m (corresponding to ”), which only the McD14 profile reproduces at all uv within the uncertainties of the data (the non-cool core and cool core versions of the profile show here little difference; Fig. 3, B). The other GNFW models only fit completely if we force the projected signal to be constant (i.e., flat) within the inner 15” (see Fig. 3, B). Assuming for the sake of speculation that this flatness at intermediate and large uv distances is not simply due to noise fluctuations, as suggested by the evolution observed in higher-mass (but lower-redshift) clusters (Battaglia et al., 2012, McD14), at least two different causes can be envisioned. On the one hand, left-over flux from incomplete point source subtractions could indeed remove power from the SZ signal at small scales. This might either arise from an underestimate of the (here, 92 GHz) flux of detected star-forming sources or from the emission of galaxies below the detection threshold. In the second case, this would correspond for this cluster to an additional flux of 10 Jy, or about 60 M*⊙* yr*-1* for main sequence (MS) galaxies at the cluster redshift (Magdis et al., 2012). This would represent 8% of the SFR within the region covered by the SZ signal (C18), considering cluster members and interlopers. For comparison, this corresponds to three \sim$$10^{10} M*⊙* MS galaxies at the redshift of the cluster or 30–40 M*⊙* galaxies (Schreiber et al., 2015). The mass completeness limit of our deepest near-infrared imaging being 1010 M*⊙* (Strazzullo et al., 2013), it is not impossible that a few galaxies might have been missed even in the priors catalogue. Diffuse emission could also provide another source of positive signal at slightly larger scales. In addition to its hot ICM and giant Ly nebula, Cl1449 also hosts intracluster light (ICL), on a similar scale to the Ly emission and possibly of stellar origin (Dimauro et al., in prep.). Thermal emission from intracluster dust might have been detected at lower redshift (however, the low resolution of the data makes it unclear; Planck Intermediate Results, XLIII), although constraints on the gas-to-dust ratio of the ICM place it at a much lower level than in star forming galaxies (Kitayama et al., 2009; Gutiérrez & López-Corredoira, 2017). However, since Cl1449 is in a much younger dynamical state, as also evidenced by its relatively bright ICL, its FIR emission could be comparatively higher.
On the other hand, if the lack of negative power at m is an intrinsic property of the SZ signal, it suggests lower central electron density and/or temperature with respect to lower-redshift clusters. This could either simply reflect a secular evolution in clusters’ ICM pressure distribution or be the result of feedback effects from galaxies. In the latter case, AGN-generated cavities in the ICM, for example, typically have lower electron density and pressure than the thermal ICM, leading to a decreased signal with respect to the thermal case (e.g., Pfrommer et al., 2005; Ehlert et al., 2019; Abdulla et al., 2019). It would not be entirely surprising for one to be present in Cl1449, as the cluster hosts at least two X-ray detected AGNs, whose putative outflows are likely associated with the powering and/or maintenance of the Ly emission nebula in its core (Valentino et al., 2016). Furthermore, while the extent of the “flat” pressure region necessary to reproduce the observed profile is large, of the order of 100 kpc, it is not unheard of in clusters (e.g., Abdulla et al., 2019). One might therefore find it puzzling that the McD14 and A10 models, which assume no baryonic physics, match the observed profile and X-ray mass constraint better than the AGN 8.0 and AGN 8.5 models, which include them. Additionally, these models were calibrated on data and assume self-similar evolution with redshift, as do the scaling relations (Leauthaud et al., 2010) used in the Chandra analysis. Contrarily, more recent work suggest that the assumption of self-similarity does not quite hold when AGN feedback is considered (Le Brun et al., 2017).
Finally, we note that a deviation from axisymmetry in the SZ signal, such as non-zero ellipticity, imply that either of the effects discussed above (or combination thereof) would be stronger, as it would transfer power to smaller scales, i.e., flatten the uv-amplitude profile. The excellent agreement between the observed profile and models shown in Fig. 3 (B) suggests however that the SZ decrement of the cluster has a fairly circular geometry. On the other hand, no elliptical or multi-component fit was attempted given the S/N of the data. Even with ALMA, we are, in the regime, probing the limits of the recoverable information. The r.m.s. noise of the ALMA data and the lack of detectable structure in its residuals after subtracting both the point sources and the SZ signal (as shown in Fig. 6) allows us to put a 3 upper-limit on individual inhomogeneities in the SZ signal of 6% of the total decrement. However, lower-amplitude pressure discontinuities might still be present. The current data nevertheless provide an interesting baseline for comparison with future observations of similar or higher-redshift galaxy clusters, such as Cl J1001+0220 at (Wang et al., 2016), in which feedback from highly-active galaxies is expected to be strong. Conversely, averaging the SZ signal over a population of high-redshift galaxy clusters, by increasing the S/N and minimising cosmic variance, would allow us to set true constraints on ICM pressure models at early stages of cluster formation.
5 Conclusions
Combined ALMA and ACA observations of Cl1449 at 92 GHz have yielded a secure 5 detection of the SZ decrement associated with its ICM. Comparing the uv-amplitude profile of the SZ signal to a variety of pressure models, we confirm the total mass estimates obtained from Chandra X-ray observations of the cluster. While the SZ signal provides independent constraints, these still depend on the adopted model and its calibration. We find a factor 2 spread in mass estimates among models at similar significance levels, with the SZ constraints nevertheless clustering around the mass inferred from Chandra X-ray data.
In this work we measure the 92 GHz flux of galaxies in the cluster’s field and subtract it from the complex visibilities, i.e., in the Fourier space of the data. We perform the rest of the analysis entirely on the visibilities, rebinning them into a uv-amplitude profile. The final S/N of the data, conservatively estimated, is not quite high enough to strongly constrain ICM pressure models. We see no sign of a cool core and, while the empirical Arnaud et al. (2010) profile appears to hold on here as well, we notice a small tension between the data and locally-calibrated models. This could either be produced by residuals from the subtraction of positive sources or might reflect a pressure deficit in parts of the cluster’s ICM compared to expectations, as suggested by the redshift trend seen in less distant and more massive clusters. Distinguishing between these two scenarios is not possible with the current data.
The density of star formation present within Cl1449 is sufficient to almost entirely fill the SZ decrement unless corrected for. This issue is likely to affect all clusters and to grow in severity with redshift due to both the increased activity of galaxies within cluster cores (e.g., Wang et al., 2016, 2018) and the negative -correction of their FIR dust emission at the frequencies of the SZ effect. It can nevertheless be slightly minimised by observing at lower frequencies, since at the tail of dust emission in galaxies falls somewhat steeper than the SZ decrement. For example, we would expect in the case of Cl1449 a 30% improvement in contrast when observing with ALMA/ACA in Band 1 (40 GHz; not yet commissioned at the time of writing) instead of Band 3. At , on the other hand, the gain would be closer to 80%. Although the SZ signal in Band 1 is also expected to be lower by a third compared to that in Band 3, it will be sampled by a beam a factor 3 larger. A simple calculation using our best fitting profile and the noise predictions from the current exposure time calculator then suggests that we can reach a comparable S/N at 40 GHz with the same integration time as for 92 GHz, but with considerably less uncertainty on the contamination from positive emitters.
Our observation of the lowest mass single SZ detection so far demonstrates the power of ALMA for the study of the ICM of emerging galaxy clusters. It also illustrates the usefulness of combining short- and long-baseline interferometric observations in the context of SZ surveys. Indeed, the necessity for point-source subtraction, which requires a good prior knowledge of FIR emitters in the target field, as well as the increasing activity of cluster galaxies as we peer further back in time, casts doubts on the viability of single-dish telescopes for high-redshift SZ surveys. In this case multi-band observations would be absolutely necessary, as well as a high S/N to compensate for the steeply rising FIR SED of star forming galaxies, in both frequency and redshift, with respect to the SZ signal. However, this might still not be sufficient without accurate redshift information, as such observations could be susceptible to degeneracies between the spectral shape of the SZ signal and the line-of-sight distribution of FIR emitters. We can thus expect a significant and increasing number of structures to be misidentified or missed entirely due to star formation filling their decrement, suggesting that any SZ census of clusters is at risk of being biased towards older galaxy populations rather than simply higher relative total masses.
Acknowledgements.
We thank the anonymous referee for their constructive for their constructive report, which helped improve the presentation of this work. This work is based on data from ALMA program 2016.1.01107, as well as programs 2012.1.00885.S and 2015.1.01355.S. ALMA is a partnership of ESO (representing its member states), NSF (USA) and NINS (Japan), together with NRC (Canada), MOST and ASIAA (Taiwan), and KASI (Republic of Korea), in cooperation with the Republic of Chile. Support for CARMA construction was derived from the G. and B. Moore Foundation, the K. T. and E. L. Norris Foundation, the Associates of the California Institute of Technology, the states of California, Illinois, and Maryland, and the NSF. Ongoing CARMA development and operations are supported by the NSF under a cooperative agreement, and by the CARMA partner universities. R.T.C. acknowledges support from the Science and Technology Facilities Council grant ST/N504452/1; F.V. acknowledges support from the Villum Fonden research grant 13160 ”Gas to Stars, Stars to Dust: Tracing Star Formation across Cosmic Time; A.M.C.L.B. was supported by the European Research Council under the European Union’s Seventh Framework Programme (FP7/2007-2013) / ERC grant agreement number 340519; D.R. acknowledges support from the National Science Foundation under grant number AST-1614213 and from the Alexander von Humboldt Foundation and the Federal Ministry for Education and Research through a Humboldt Research Fellowship for Experienced Researchers.
Appendix A 92 GHz continuum sources
Table 2 shows the 92 GHz fluxes of known FIR sources in the field of Cl1449, measured on our ALMA data. We compare these to the predictions of Magdis et al. (2012) templates (Fig. 7), assuming MS SEDs based on the overall consistency between the MS at and the SFRs derived by C18.
Appendix B Peak offset significance
To investigate the significance of the observed offset between the positions of the peaks of the SZ and X-ray signals, we carry out a simple Monte Carlo simulation using a simulated SZ decrement based on the A10 pressure model and best-fit total mass value for Cl1449 (see Section 3.1). We take the Fourier transform of this model, according to Eq. 2 and add noise to the model complex visibilities based on the weights of the observed ones, assuming natural weighting, and merge the ACA and ALMA simulated observations. We then perform a point-source extraction with free position, as described in Section 3, which we compare to the observed offsets. In the case of the X-ray centroid, we consider both the combined astrometric uncertainty of ALMA/ACA and Chandra (1”) and a more realistic 5” precision appropriate for the extended emission (Valentino et al., 2016). As shown in Fig. 8, we find different probabilities for the SZ-BCG and SZ-X-ray offsets, with the latter falling within the top 1.5-5% of realisations.
Appendix C 31 GHz observations
Cl1449 was observed at 31 GHz with CARMA between March and April 2012, using the 3.5 m sub-array in the SL configuration (project c0865; PI Riechers). This consisted of 6 antennas in a 20 m close-packed configuration probing 2’ scales, and 2 outrigger antennas to add baselines of 50 m and provide 0.3’ resolution for point-source subtraction, for a total baseline range of 4–83 m. The observation covered 11 tracks, resulting in a combined on-source observing time of 31.4 h. Bandpass calibration was performed during each track using the quasars J1512–090 and 3C 279, and complex gain calibration using the radio quasar J1504+104. The planet Mars was used as the primary flux calibrator. The data were then reduced using the Miriad (Sault et al., 1995) software package. Imaging with natural baseline weighting results in a synthesised beam size of 135"$$\times123, while uniform baseline weighting provides a 22"$$\times16 beam (for comparison, the primary beam FWHM of the 3.5 m antennas is 11’ at 31 GHz). We find a continuum r.m.s. noise limit of 90 Jy/beam across the full 8 GHz bandwidth.
Here we fit point sources using the long-baseline data ( m) from the outrigger antennas and subtract them from all visibilities. When extrapolating the 92 GHz -190 Jy signal assuming a standard spectral shape for the thermal SZ effect, the decrement at 31 GHz should be -32 Jy. Consequently we see no detectable signal, as expected given the noise of the data. We nevertheless fit the visibilities with the best-fit model to the 92 GHz data (see Section 4) at fixed positions corresponding to either the cluster’s centre of mass or the peak of the 92 GHz decrement. We find Jy, which implies a 3 “upper” limit to the 31 GHz signal of -360 Jy (i.e., about ten times the expectation value).
Appendix D Lensed background
Gravitational lensing of background sources by the halo of a galaxy cluster can affect its observed SZ decrement in at least two ways: boosting of their flux, which contributes to the filling of the decrement, and number count depletion by reducing their surface density, which can add signal to the decrement. Here we assume that background sources boosted above the detection limit will be identified and subtracted, and therefore concentrate on the second effect. In this case, the surface brightness of undetected sources (i.e., the background) can be written as a function of the observed-luminosity function and detection threshold :
[TABLE]
where is the magnification at angular distance from the halo’s centre (see, e.g., Broadhurst et al., 1995; Wright & Brainerd, 2000; Umetsu et al., 2014), assuming spherical symmetry. As increases with decreasing , the infrared background also decreases towards the cluster’s centre with respect to the unlensed () case at large radii (e.g., Zemcov et al., 2013; Sayers et al., 2018). Here we use the 3 mm number counts distribution of Zavala et al. (2018), extrapolating it to arbitrarily low fluxes, the redshift distribution of sub-millimetre galaxies of Weiß et al. (2013, we assume that the number counts distribution is independent of redshift), and a detection limit of five times our ACA r.m.s. Even under this latter conservative assumption (the detection limits of both C18 and our ALMA data being lower) we find that the contribution of the integrated lensed 3 mm background to the total decrement is negligible compared to the SZ one, as shown in Fig. 9.
Appendix E uv plane modelling
For single-pointing observations, the complex visibilities can be approximated as
[TABLE]
where is the on-sky intensity distribution of the model and the primary beam response of the antennae. We compare this to the output of noise-free (pwv=0 option in simalma) simulated simalma observations, using the GNFW models described in Section 3.1. We find a relative difference between both of at most 4% (Fig. 10), which is well below the noise level of our data. The approximation given in Equation 2 therefore allows us to quickly explore the parameter space of models at little to no cost of precision, given our S/N (see Fig. 3). On the other hand, while the full observation model used by simalma is certainly more accurate, a single iteration requires significantly more time and thus makes automation less feasible.
Appendix F -model fit
To explore a larger range of pressure profiles we substitute, in the method described in Section 3.1, the GNFW profiles with a deprojected -model for the gas density:
[TABLE]
where is the core radius and the outer slope of the model. We then assume primordial abundances and assume the gas fraction and temperature model A from Dvorkin & Rephaeli (2015). We use an expanding parameter grid with and steps of . The result of the fit is shown in Fig. 11.
The reference list from the paper itself. Each links out to its DOI / PubMed record.
- 1Abdulla et al. (2019) Abdulla, Z. et al. 2019, Ap J, 871, 195
- 2Andreon et al. (2009) Andreon, S. et al. 2009, A&A, 507, 147
- 3Arnaud et al. (2010) Arnaud, M. et al. 2010, A&A, 517, A 92
- 4Battaglia et al. (2012) Battaglia, N. et al. 2012, Ap J, 758, 75
- 5Bleem et al. (2015) Bleem, L.E. et al. 2015, Ap JS, 216, 27
- 6Broadhurst et al. (1995) Broadhurst, T.J., Taylor, A.N., Peacock, J.A. 1995, Ap J, 438, 49
- 7Brodwin et al. (2012) Brodwin, M. et al. 2012, Ap J, 753, 162
- 8Brodwin et al. (2016) Brodwin, M. et al. 2016, Ap J, 817, 122