Using the Extragalactic Gamma-Ray Background to Constrain the Hubble Constant and Matter Density of the Universe
Houdun Zeng, Dahai Yan

TL;DR
This paper uses the extragalactic gamma-ray background data to independently estimate the Hubble constant and matter density, providing constraints consistent with other cosmological measurements.
Contribution
It introduces a novel method to constrain cosmological parameters using the EGB spectrum, focusing on energies above 10 GeV and the EBL-absorption cutoff.
Findings
Estimated H_0 = 64.9^{+4.6}_{-4.3} km/s/Mpc
Estimated Ω_m = 0.31^{+0.13}_{-0.14}
Method shows degeneracy between H_0 and Ω_m
Abstract
The attenuation produced by extragalactic background light (EBL) in -ray spectra of blazars has been used to constrain the Hubble constant () and matter density () of the Universe. We propose to estimate and using the well measured 10 GeV extragalactic -ray background (EGB). This suggestion is based on the facts that the 10 GeV EGB is totally explained by the emissions from blazars, and an EBL-absorption cutoff occurs at 50 GeV in the EGB spectrum. We fit the 10 GeV EGB data with modeled EGB spectrum. This results in and . Note that the uncertainties may be underestimated due to the limit of our realization for EBL model. and are degenerate in our method. Independent determination of …
Click any figure to enlarge with its caption.
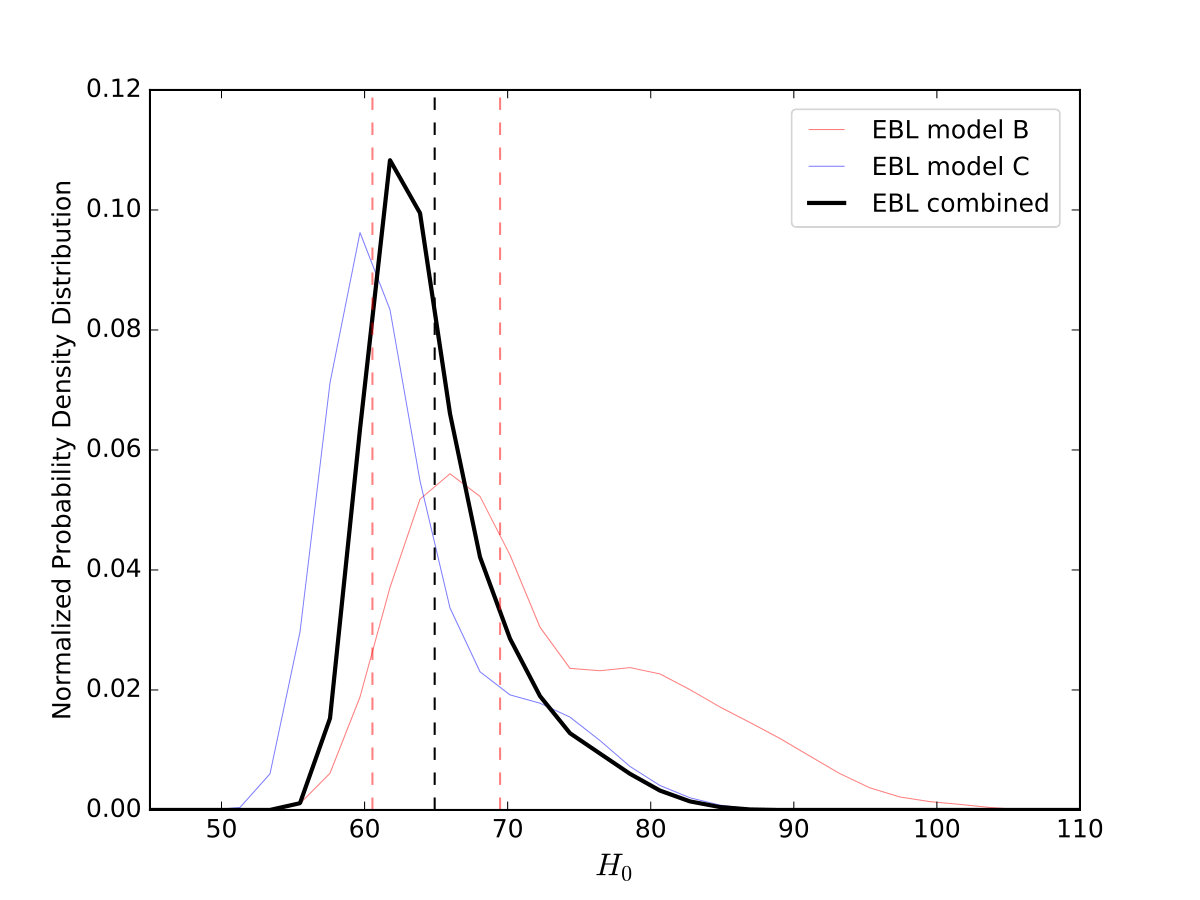 Figure 1
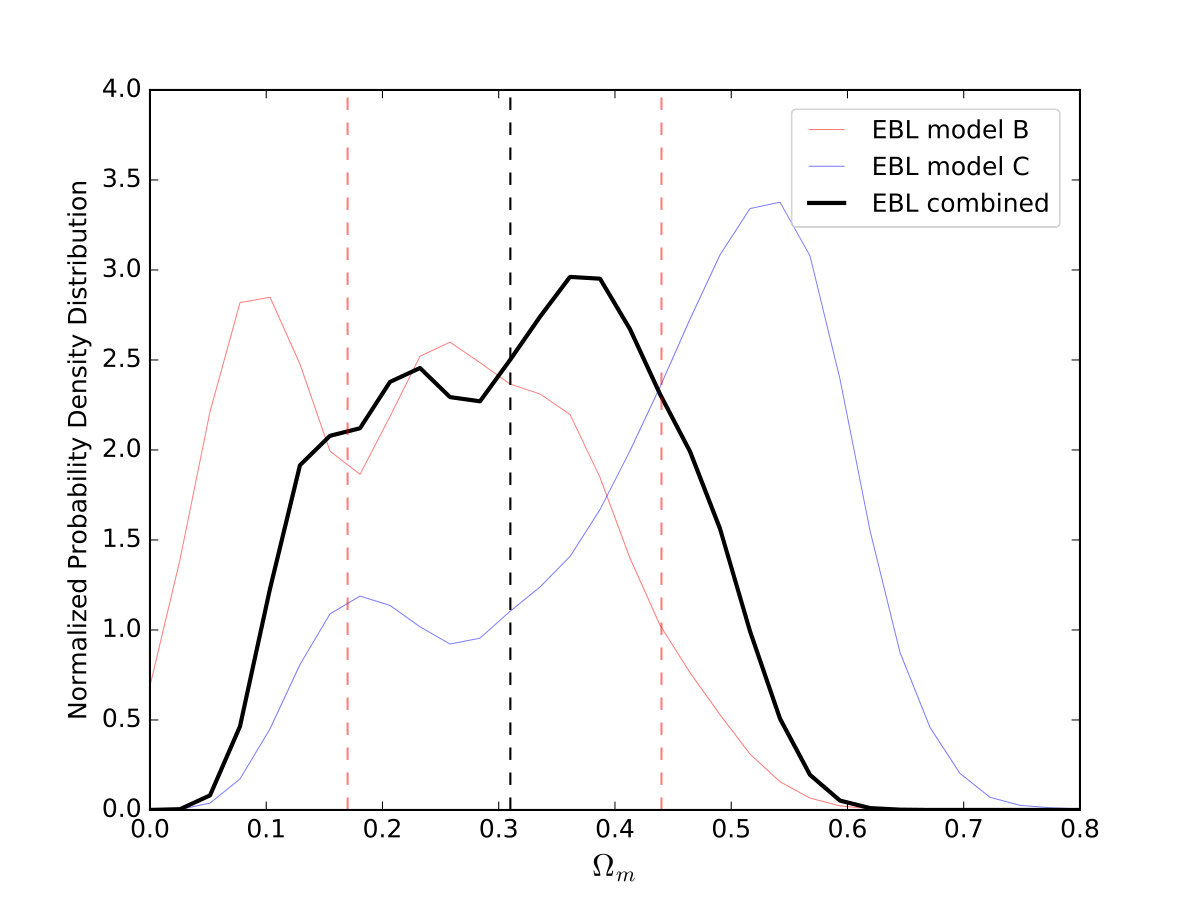 Figure 2
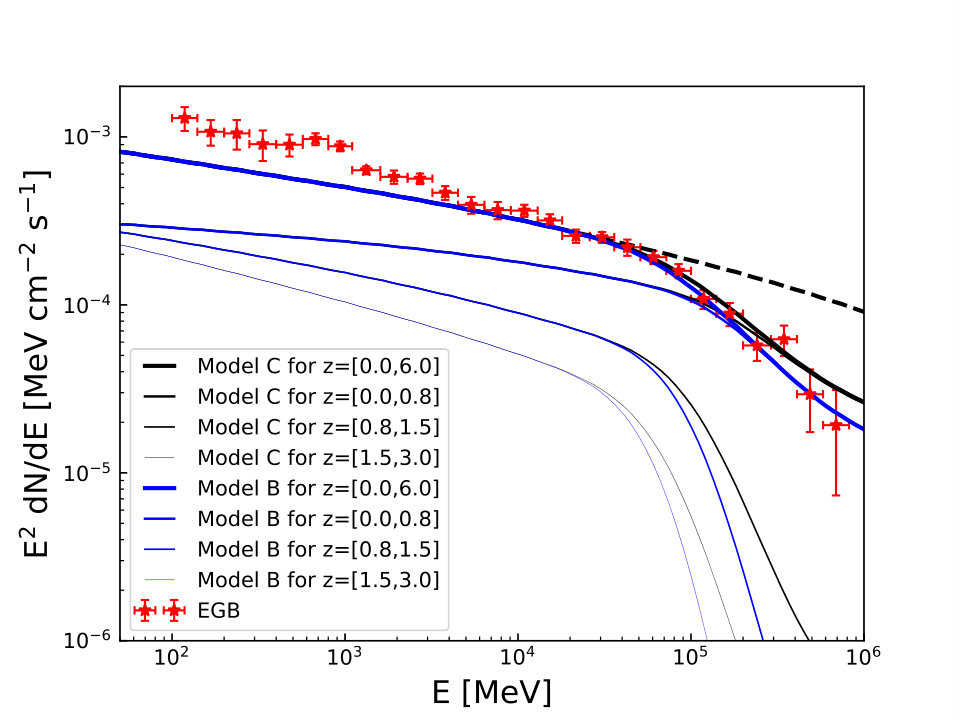 Figure 1
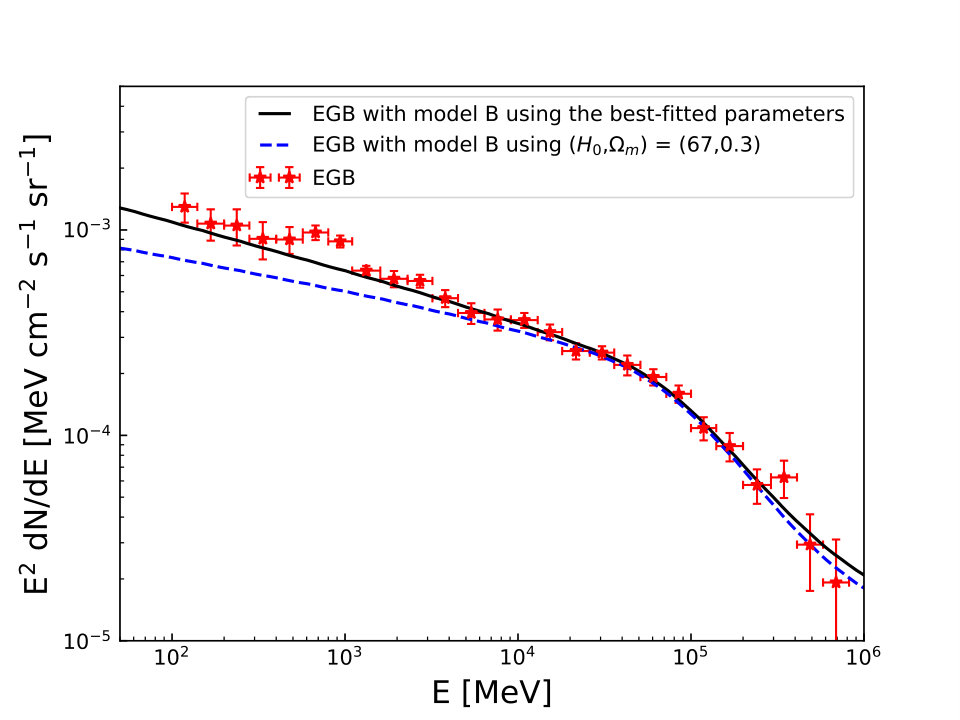 Figure 3
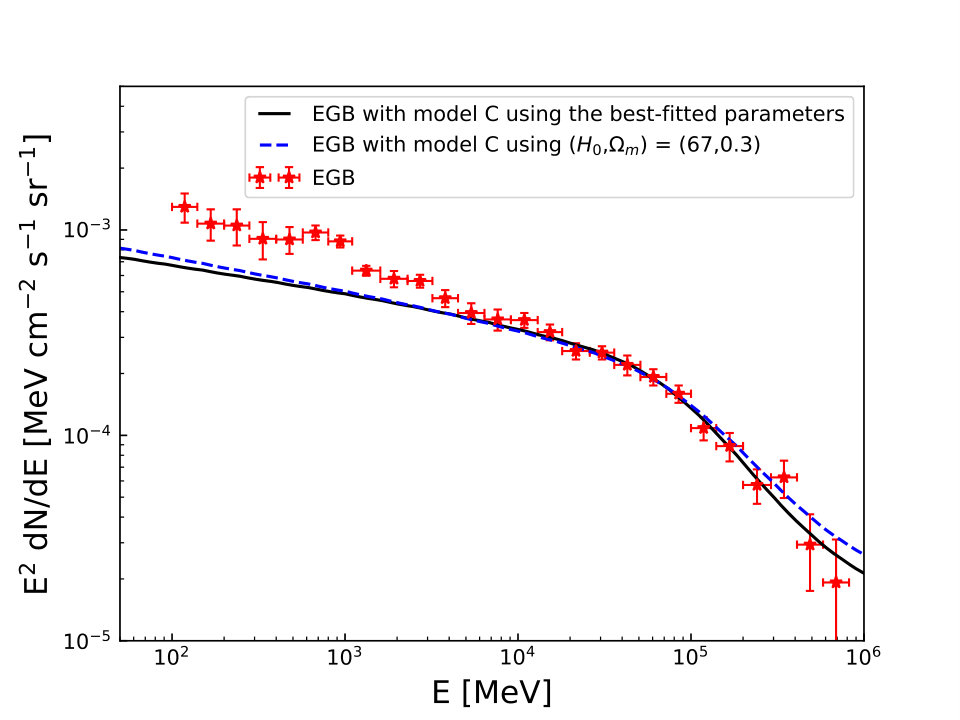 Figure 4
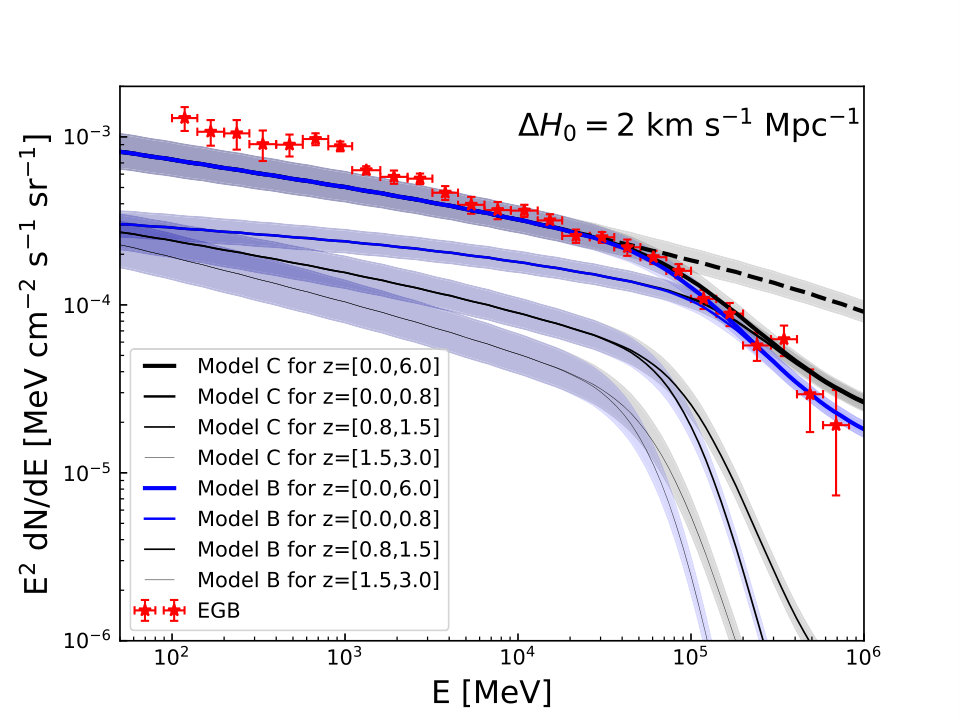 Figure 2
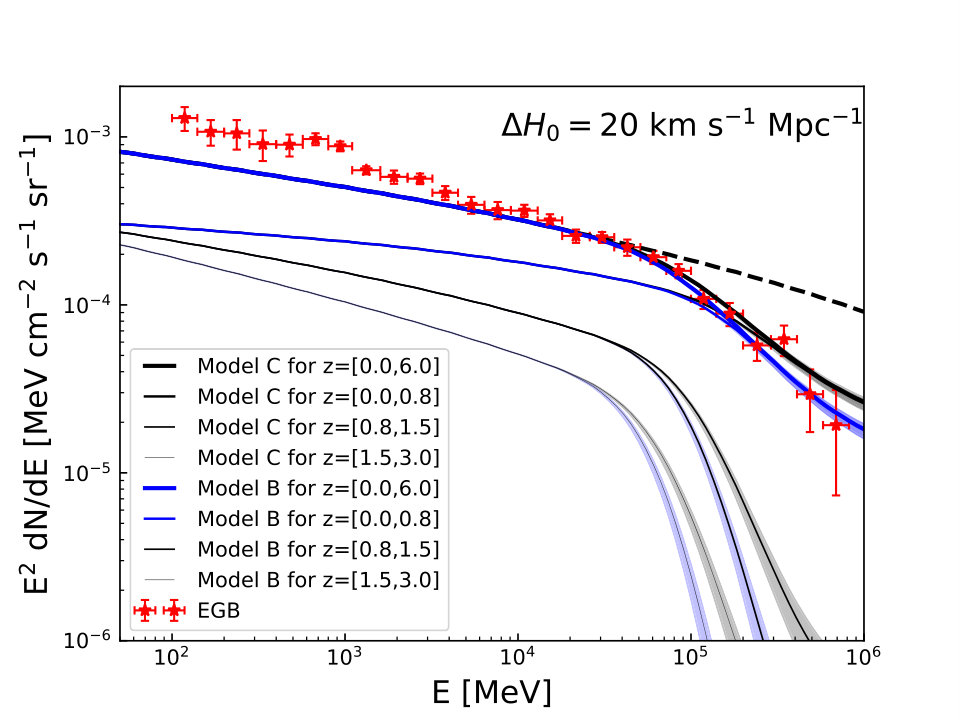 Figure 2
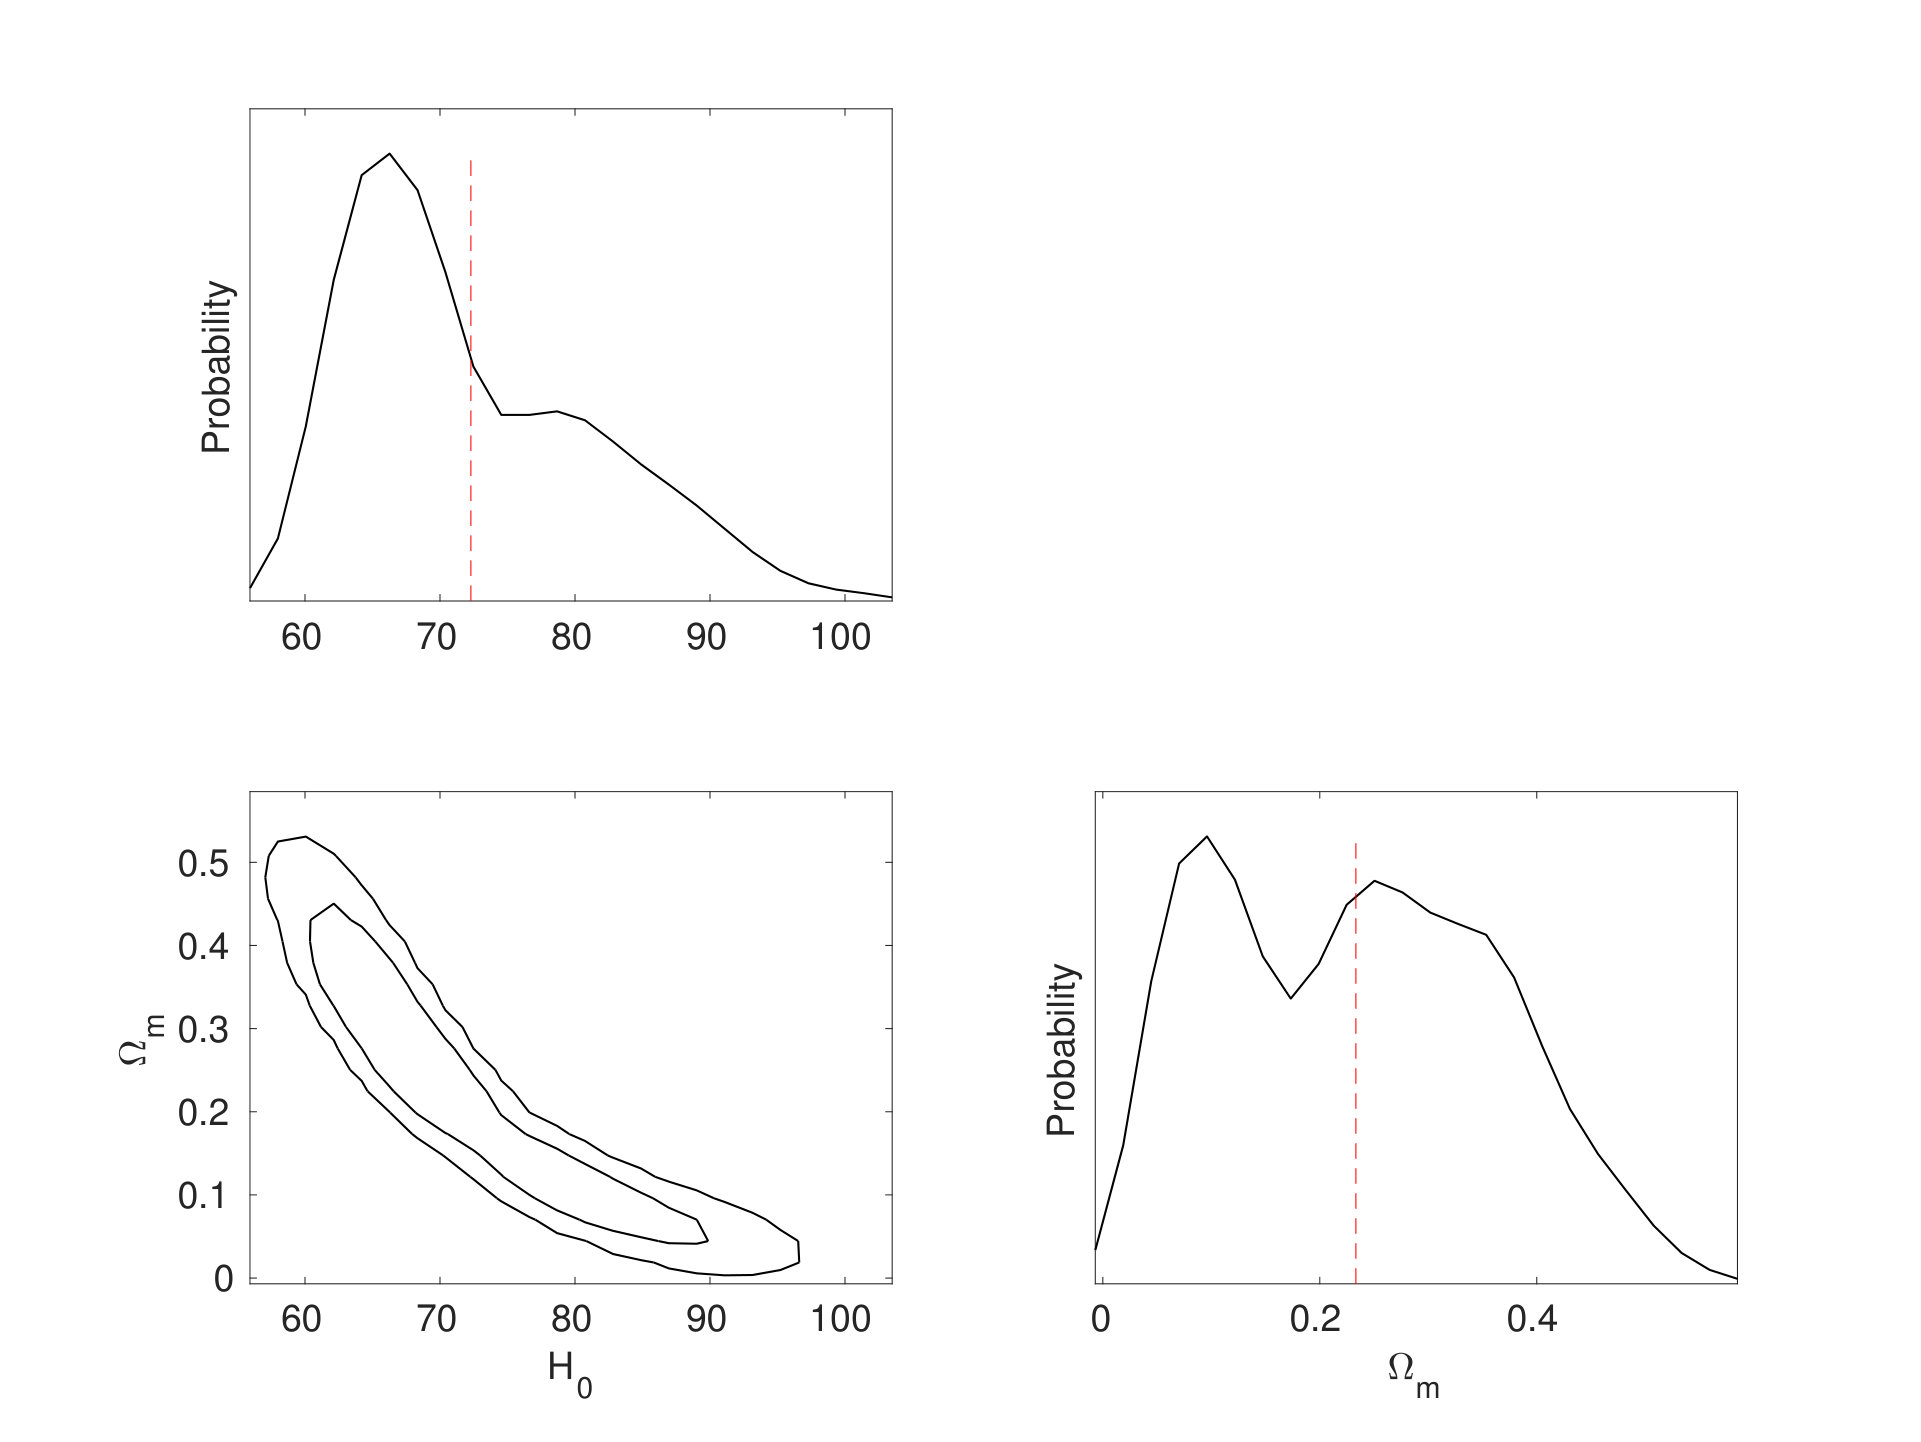 Figure 8
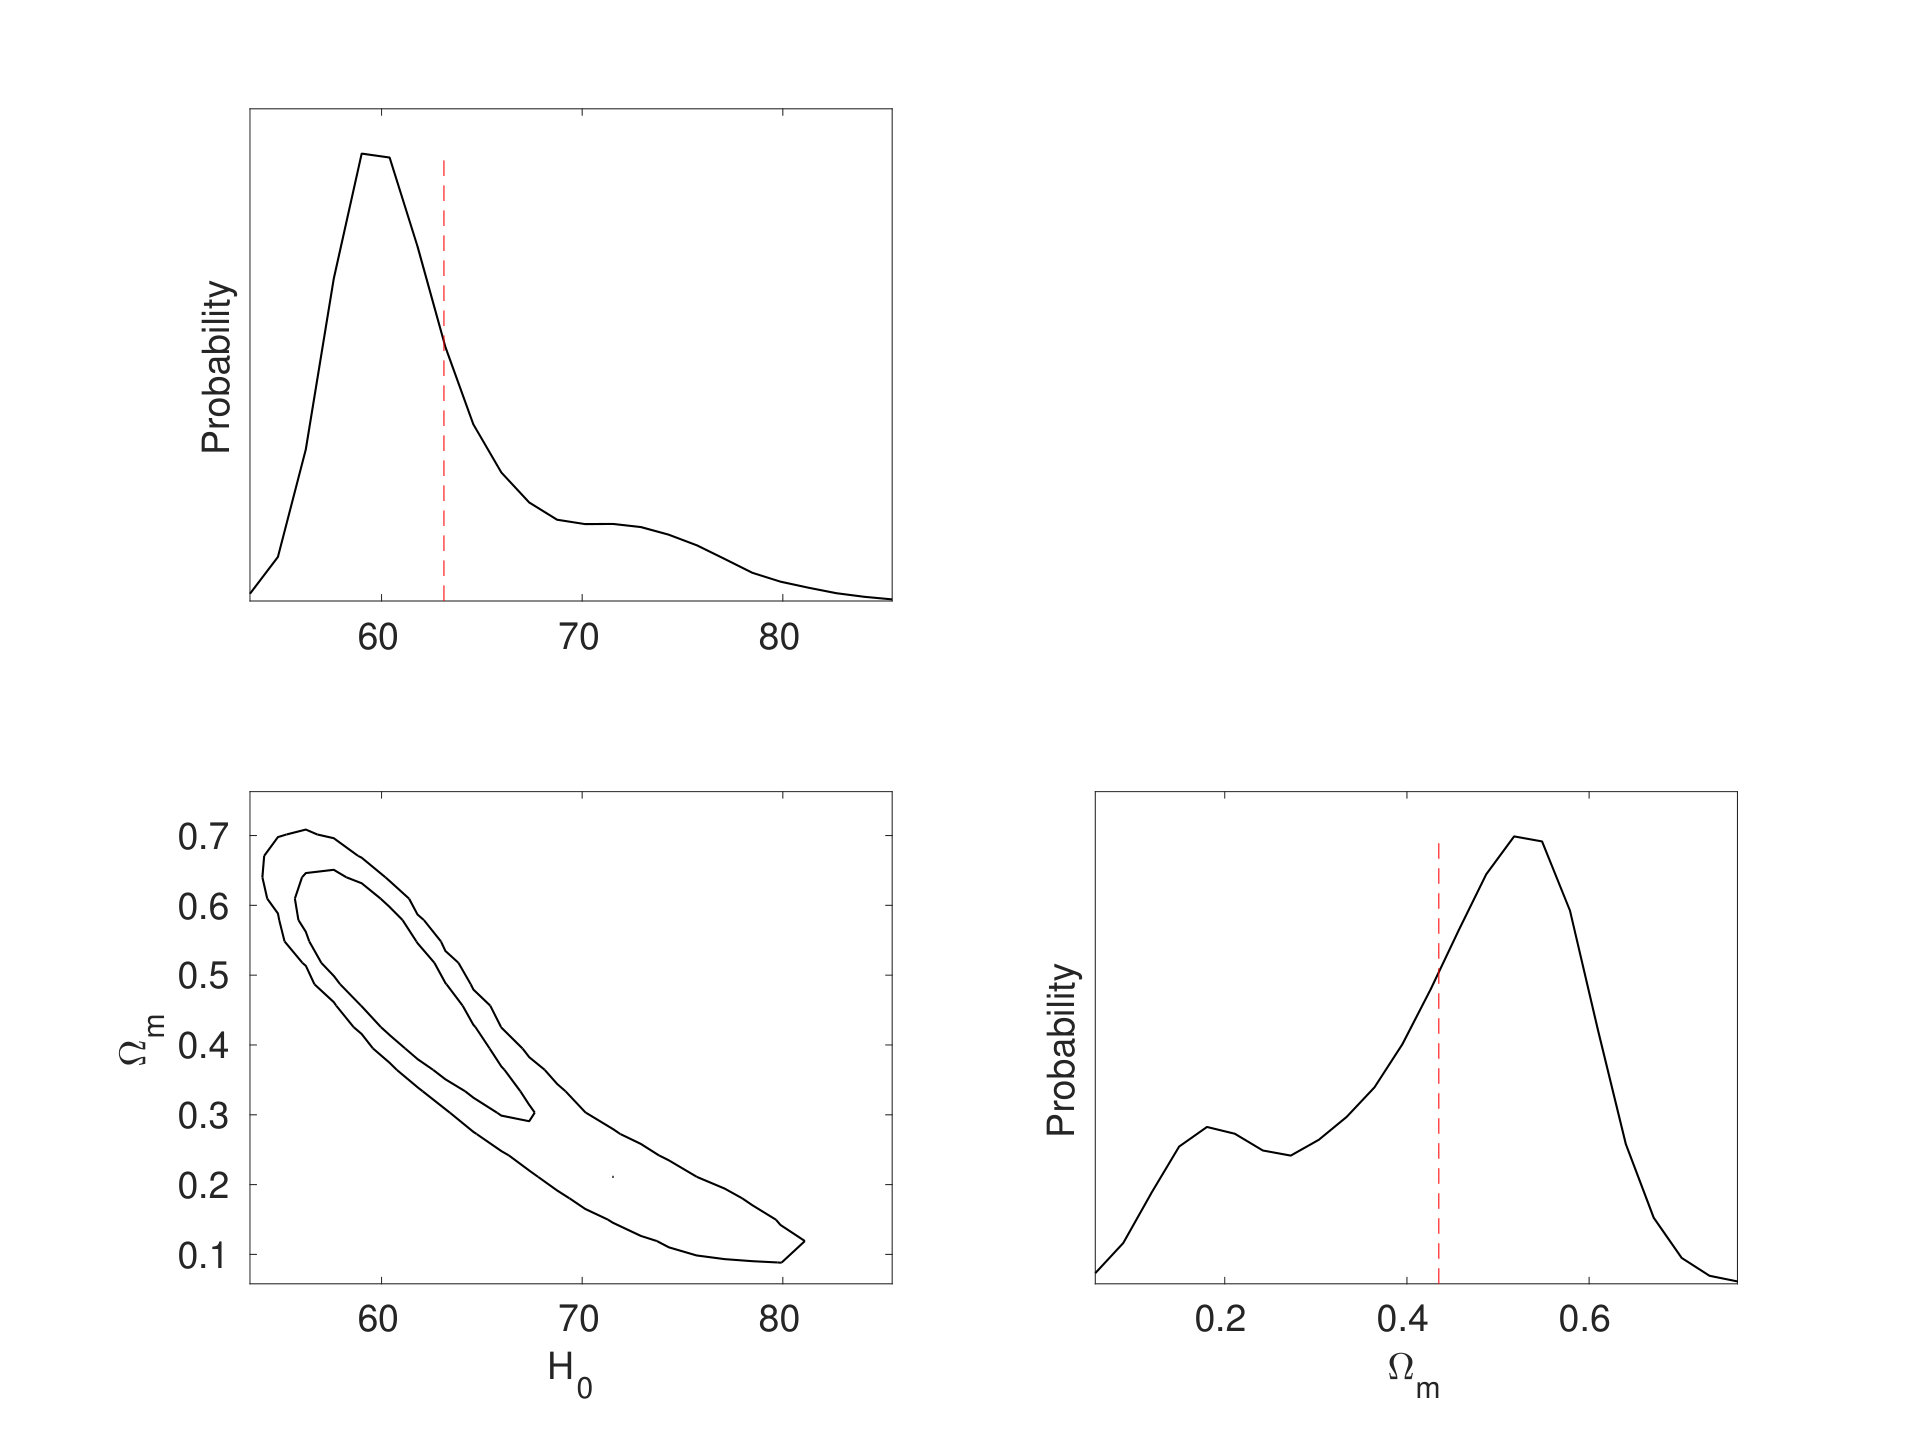 Figure 9
Peer Reviews
No public reviews on file for this paper yet. If you reviewed it on a platform where reviews are public (OpenReview, ICLR, NeurIPS, ICML), you can paste yours below so the community can read it here.
Videos
No videos yet. Explain this paper in a talk, walkthrough, or lecture? Add one.
Using the Extragalactic Gamma-Ray Background to Constrain the Hubble Constant and Matter Density of the Universe
Houdun Zeng
Key Laboratory of Dark Matter and Space Astronomy, Purple Mountain Observatory, Chinese Academy of Sciences, Nanjing 210008, China; [email protected]
Dahai Yan
Key Laboratory for the Structure and Evolution of Celestial Objects, Yunnan Observatories, Chinese Academy of Sciences, Kunming 650216, China; [email protected]
Center for Astronomical Mega-Science, Chinese Academy of Sciences, 20A Datun Road, Chaoyang District, Beijing 100012, China
Department of Astronomy, Key Laboratory of Astroparticle Physics of Yunnan Province, Yunnan University, Kunming 650091, China
Abstract
The attenuation produced by extragalactic background light (EBL) in -ray spectra of blazars has been used to constrain the Hubble constant () and matter density () of the Universe. We propose to estimate and using the well measured 10 GeV extragalactic -ray background (EGB). This suggestion is based on the facts that the 10 GeV EGB is totally explained by the emissions from blazars, and an EBL-absorption cutoff occurs at 50 GeV in the EGB spectrum. We fit the 10 GeV EGB data with modeled EGB spectrum. This results in and . Note that the uncertainties may be underestimated due to the limit of our realization for EBL model. and are degenerate in our method. Independent determination of by other methods would improve the constraint on .
galaxies: jets - gamma rays: galaxies - gamma rays: diffuse background - cosmology: observations
1 Introduction
A precise and accurate measurement of the Hubble constant () would provide deep understanding of fundamental physics questions. Multiple paths to independent estimates of are needed in order to access and control its systematic uncertainties (Suyu et al., 2012).
Gamma-ray astronomy provides a new approach to estimate (Salamon et al., 1994; Mannheim, 1996). The optical depth of the -ray photons emitted by extragalactic objects, , scales as , where is the photon density of the extragalactic background light (EBL), is the Thomson cross section, and is the distance from the -ray source to Earth. is inversely proportional to , and also depends on . Therefore, through determining the optical depth , one can estimate .
Such an approach has been pursued by latter studies. With simulated TeV spectra of blazars, Blanch & Martinez (2005) studied the possibility of using -ray absorption to constrain cosmological parameters. Using the EBL density based on galaxy counts, Barrau et al. (2008) derived at the 68% confidence level, from the TeV spectrum of Mrk 501. With the cosmic -ray horizon extracted from multiwavelength observations of TeV blazars (Domínguez et al., 2013), Domínguez & Prada (2013) derived . Biteau & Williams (2015) derived by analyzing 106 TeV spectra of 38 blazars. The Fermi Large Area Telescope (Fermi-LAT) observations of blazars provide good determinations of (Abdollahi et al., 2018). Using measured from Fermi-LAT GeV spectra (Abdollahi et al., 2018) and TeV spectra (Desai et al., 2019), Domínguez et al. (2019) derived and with the combination of the EBL models of Finke et al. (2010) and Domínguez et al. (2011). The constraint on from -ray attenuation has been significantly improved in the past ten years.
The above constraints on are all derived from point sources. Here, we propose to constrain and using the extragalactic -ray background (EGB). The EGB spectrum has been well measured from 0.1 GeV to 800 GeV by the Fermi-LAT. This spectrum can be described by a power law with a photon index of 2.32 that is exponentially cut off at 50 GeV (Ackermann et al., 2015). The cutoff is caused by the EBL absorption (Ajello et al., 2015). Similar to the idea proposed by Salamon et al. (1994), the -ray absorption in the EGB spectrum could also be used to constrain the cosmological parameters.
EGB is dominated by the emission of -ray blazars (Ajello et al., 2015; Ackermann et al., 2016). With the source count distribution of hard-spectrum blazars, Ackermann et al. (2016) estimated that blazars can explain almost the totality () of the 50 GeV EGB. In particular, the calculation performed with improved luminosity function (LF) and modeling of the spectral energy distributions (SEDs) of blazars showed that blazars account for the totality of the 10 GeV EGB (Ajello et al., 2015). Besides, modeling of the EGB spectrum also depends on . Therefore, we can use the above information to constrain and .
2 Method
2.1 Calculation of the EGB spectrum
We follow Ajello et al. (2015) to compute the EGB spectrum contributed by blazars,
[TABLE]
where the LF, (at redshift , for sources of -ray luminosity ), is described as a broken power law multiplied by the photon index distribution (Equation (1) in Ajello et al., 2015). The -ray spectrum of each blazar, , is modeled as a broken power law (Equation (11) in Ajello et al., 2015). is the comoving volume element per unit redshift and unit solid angle, which is written as,
[TABLE]
where , in a flat CDM cosmology, and is the luminosity distance.
2.2 Absorption of -rays
The optical depth of the -ray photons emitted at redshift as a function of observed -ray photon energy, , is calculated by (e.g., Razzaque et al., 2009)
[TABLE]
where , , and is adopted from Gould & Shréder (1967). We use the model of Razzaque et al. (2009) to calculate the comoving EBL density,
[TABLE]
where is the star formation rate (SFR) in unit of yr*-1* Mpc*-3*, is the initial mass function (IMF), is the escape fraction of photons from the host galaxy, and is the total number of photons emitted from a star. The normalization is determined by . is the redshift of the star (born at redshift ) that had evolved off the main sequence. See Razzaque et al. (2009) for more details.
The uncertainties in modeling the EBL density primarily come from SFR and IMF. We adopt the Models B and C in Razzaque et al. (2009). Both models use the same SFR (Cole et al., 2001; Hopkins & Beacom, 2006), but different IMFs. Model B uses Salpeter A IMF (Salpeter, 1955), and Model C uses Baldry-Glazebrook IMF (Baldry & Glazebrook, 2003).
Note that the EBL model of Razzaque et al. (2009) only includes the contribution from starlight. This underestimates the EBL density below 1 eV (Finke et al., 2010), and consequently underestimates above 0.3/(1+z) TeV.
2.3 Verification of our calculations
We calculate the contribution to the EGB from blazars with the pure luminosity evolution (PLE) LF in Ajello et al. (2015) and the EBL Models B and C. The parameters in Table 1 in Ajello et al. (2015) are used. Here we adopt and , same as that in Ajello et al. (2015). The results are shown in Fig. 1. One can see that EGB above 100 GeV can be explained by the emission from the blazars below the redshift of 0.8, whereas EGB between 10 GeV and 100 GeV can be explained by the blazars below the redshift of 1.5.
We compare our results with Ajello et al. (2015) who adopted the EBL model of Finke et al. (2010). We found that our results are almost the same as that in Ajello et al. (2015) (see their Fig. 3) below 300 GeV. Above 300 GeV, the intensity that we calculated with EBL Model C is higher than the one in Ajello et al. (2015). This is due to our underestimation of the EBL intensity. However, we note that above 300 GeV, the intensity in Ajello et al. (2015) agrees with ours within the errors of the data points.
The results in Fig. 1 show two points: (1) the emission from blazars could be used to explain the EGB above GeV; (2) the difference between EBL models of Razzaque et al. (2009) and Finke et al. (2010) has little impact on explaining the origins of EGB.
3 Results
Calculations of LF and SFR depend on the measurements of and . Ajello et al. (2015) constructed the LF with and . In our purpose, the LF should be modified with different cosmological parameters. Therefore, the LF in Equation (1) is,
[TABLE]
The SFR in Equation (4) is modified as (e.g., Domínguez et al., 2019),
[TABLE]
The primed quantities are computed with for the LF, and for the SFR, and .
3.1 Dependence on
Calculations of both the intrinsic EGB spectrum and depend on and . In Fig. 2, we can see that the intrinsic spectrum strongly relies on , especially at the energies below 100 GeV (left panel; is fixed to in the calculation of the optical depth); and the dependence of on occurs at the energies above 100 GeV (right panel; is fixed to in the calculation of the intrinsic EGB spectrum).
3.2 Fitting results
We use the modeled EGB spectrum to fit the 10 GeV observed data. and are set to free, and the other parameters are fixed to those in Ajello et al. (2015) and in Razzaque et al. (2009). The Markov Chain Monte Carlo (MCMC) technique is used to perform our fitting. More details of our MCMC method can be found in Yan et al. (2013).
Fig. 3 shows the best-fitting results with EBL Model B. We obtain and 111We here report the posterior probability means for the parameters.. In the fitting, is anti-correlated with (see the 2D confidence contours of the parameters in the right panel), which is consistent with the result obtained by using the EBL model of Finke et al. (2010) in Domínguez et al. (2019). We note that the calculated EGB spectrum below 5 GeV is more sensitive to and (see the solid and dashed lines in the left panel of Fig. 3). This effect is brought by the LF.
Fig. 4 shows the best-fitting results with EBL Model C. We obtain and . The uncertainties on are at the 9% level. Again, there is a strong degeneracy between and in this model. The EGB spectrum calculated with and is almost same with the best-fitting EGB spectrum.
Supposing that the two EBL models are equally possible, we derived the combined results in Fig. 5 of and .
4 Discussion and Conclusions
We simultaneously constrain and via fitting the GeV EGB spectrum. Two EBL models are adopted to investigate their impacts on the constraints. The EBL Model B in Razzaque et al. (2009) leads to and , and the EBL Model C in Razzaque et al. (2009) leads to and . The constraints obtained by using the two EBL models are consistent. The combined results are and . Our constraints are mainly given by the blazars below the redshift of 1.5 (see Fig. 1).
Using the latest -ray attenuation data obtained from -ray spectra of blazars, Domínguez et al. (2019) obtained and with the EBL model of Finke et al. (2010), and and with the EBL model of Domínguez et al. (2011). Their combined results are and . Our results are in agreement with theirs.
The uncertainties on are comparable with those obtained by Domínguez et al. (2019). There is a clear degeneracy between and in our calculation. Measurement of using other independent methods would improve the constraint on .
We choose the two easily calculated EBL models to examine the uncertainties introduced by the EBL models. Actually, these two models belong to the same methodology, i.e., the physically motivated model. These two models use the same assumption for SFR, and only differ in IMFs. Different assumptions for SFR may introduce extra uncertainties on . In addition, we cannot examine the uncertainties introduced by different methodologies of building EBL models (e.g., Domínguez et al., 2019). The uncertainties in our results mainly come from EBL models. Therefore, we may underestimate the uncertainties in our results.
Currently, the values of measured from type Ia supernovae and from cosmic microwave background radiation (CMB) are discrepant at (Riess et al., 2018). Alternative methods of measuring the Hubble constant, like the method presented here, is helpful to understand this discrepancy.
Acknowledgements
We thank the referee for the constructive comments. We acknowledge financial supports from the National Natural Science Foundation of China (NSFC-11703094, NSFC-U1738124, NSFC-11803081, NSFC-11573060, and NSFC-11661161010) and the joint foundation of Department of Science and Technology of Yunnan Province and Yunnan University [2018FY001(-003)]. The work of D. H. Yan is also supported by the CAS “Light of West China” Program and Youth Innovation Promotion Association.
The reference list from the paper itself. Each links out to its DOI / PubMed record.
- 1Abdollahi et al. (2018) Abdollahi, S., Ackermann, M., Ajello, M., et al. 2018, Science, 362, 1031
- 2Ackermann et al. (2015) Ackermann, M., Ajello, M., Albert, A., et al. 2015, Ap J, 799, 86
- 3Ackermann et al. (2016) Ackermann, M., Ajello, M., Albert, A., et al. 2016, Ph Rv L, 116, 151105
- 4Ajello et al. (2015) Ajello, M., Gasparrini, D., Sánchez-Conde, M., et al. 2015, Ap JL, 800, L 27
- 5Baldry & Glazebrook (2003) Baldry, I. K., & Glazebrook, K. 2003, Ap J, 593, 258
- 6Barrau et al. (2008) Barrau, A., Gorecki, A., & Grain, J. 2008, MNRAS, 389, 919
- 7Biteau & Williams (2015) Biteau, J., & Williams, D. A. 2015, Ap J, 812, 60
- 8Blanch & Martinez (2005) Blanch, O., & Martinez, M. 2005, Astroparticle Physics, 23, 588