Nearly coeval intermediate-age Milky Way star clusters at very different dynamics evolutionary stages
Andr\'es E. Piatti, Mateus S. Angelo, Wilton S. Dias

TL;DR
This study analyzes 12 intermediate-age Milky Way open clusters beyond the Sun's orbit, revealing their ages, metallicities, structural properties, and the influence of galactic tides on their evolution.
Contribution
First metallicity estimates for these distant clusters and insights into their internal and external dynamical evolution stages.
Findings
Clusters are of intermediate age (0.8-4.0 Gyr) with metallicities [Fe/H]~-0.5 to +0.1.
Inner regions shaped mainly by internal dynamics, outer regions influenced by galactic tides.
Clusters show different levels of two-body relaxation and tidal effects, affecting their sizes and densities.
Abstract
We report astrophysical properties of 12 Milky Way open clusters located beyond the circle around the Sun where the number of catalogued open clusters is thought to be statistically complete. By using deep optical photometry, we estimated their ages and metallicities on the basis of a maximum likelihood approach, using cluster members identified from Gaia DR2 data and likelihood procedures. The studied clusters turned out to be of intermediate-age (0.8 - 4.0 Gyr), with metallicities spanning the range [Fe/H] ~ -0.5 - +0.1 dex, and distributed within the general observed trend of the Milky Way disc radial and perpendicular metallicity gradients. As far as we are aware, these are the first metal abundance estimates derived for these clusters so far. From the constructed stellar density radial profiles and cluster mass functions we obtained a variety of structural and internal dynamics…
Click any figure to enlarge with its caption.
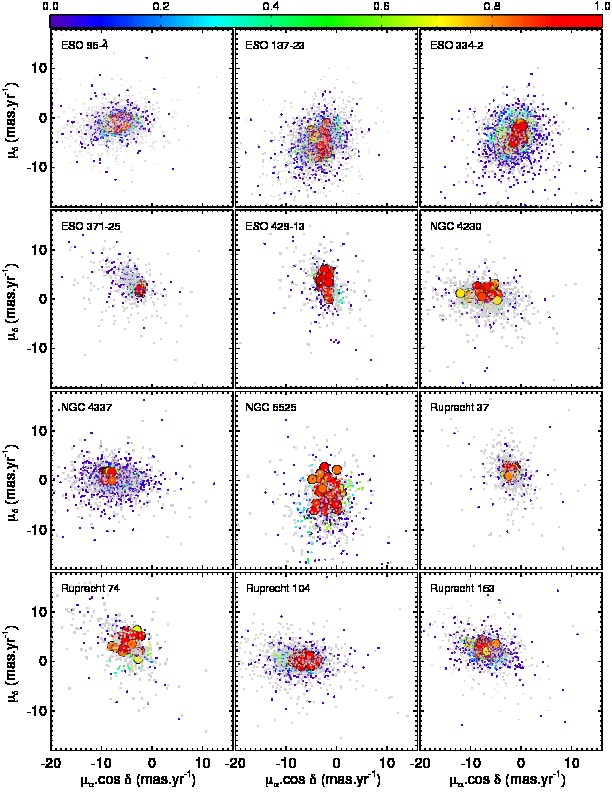 Figure 1
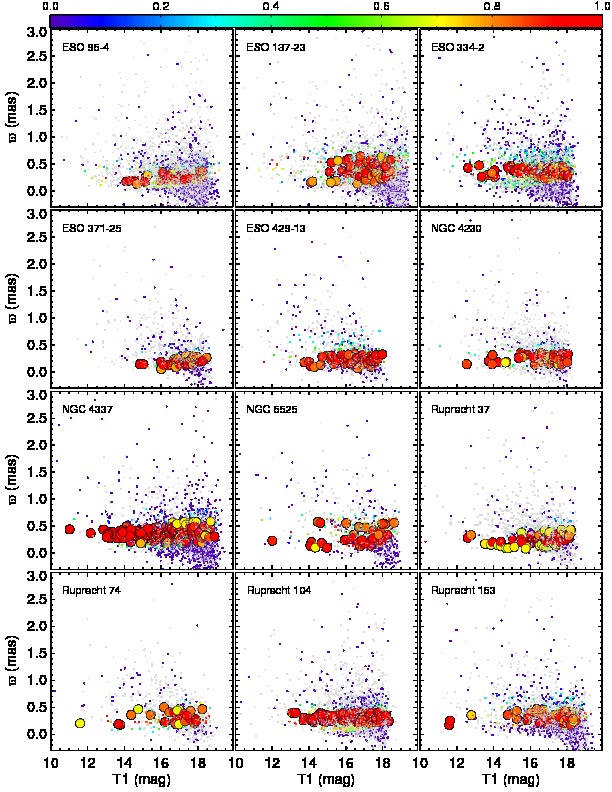 Figure 2
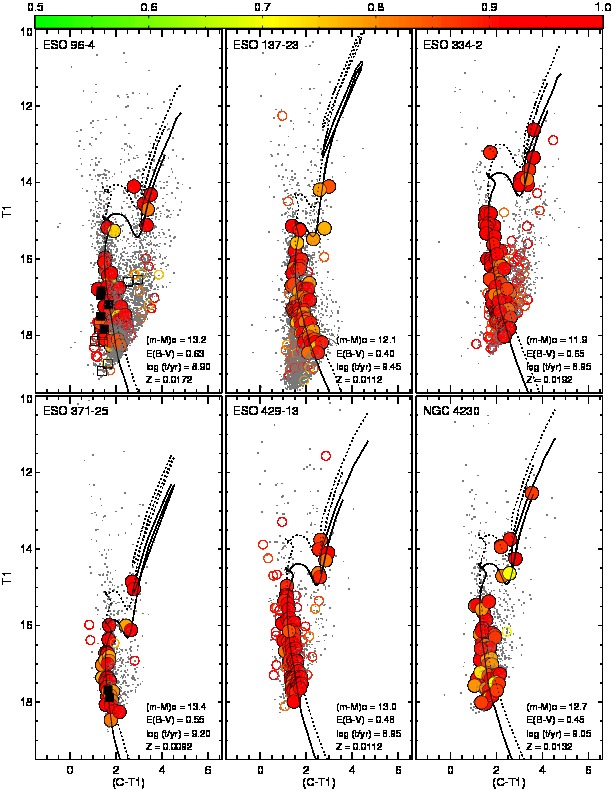 Figure 3
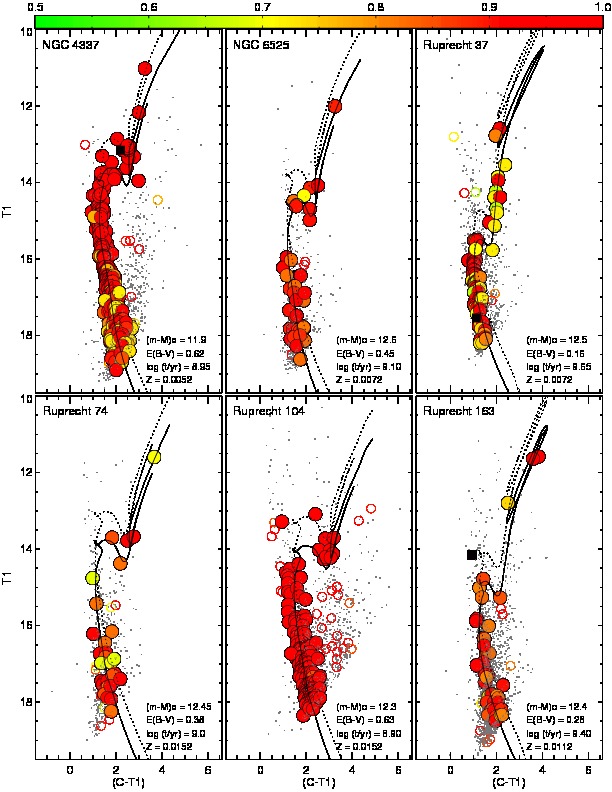 Figure 3
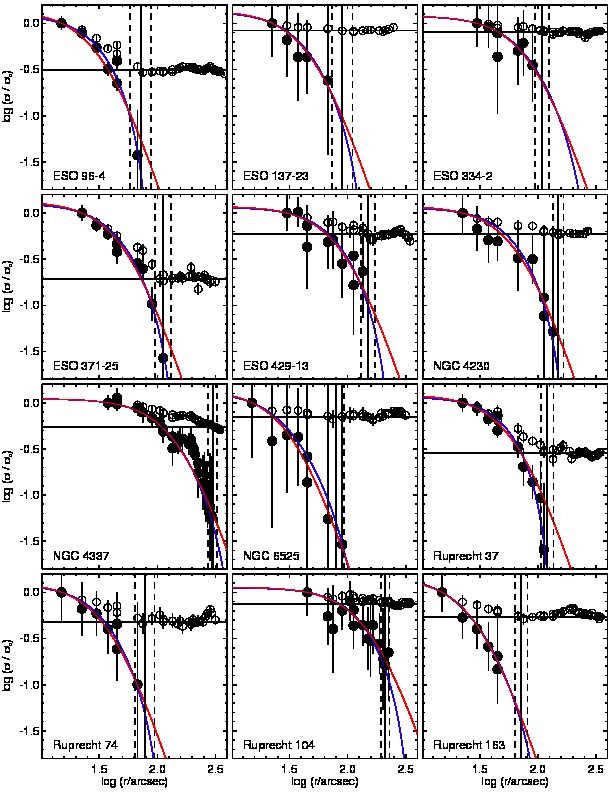 Figure 4
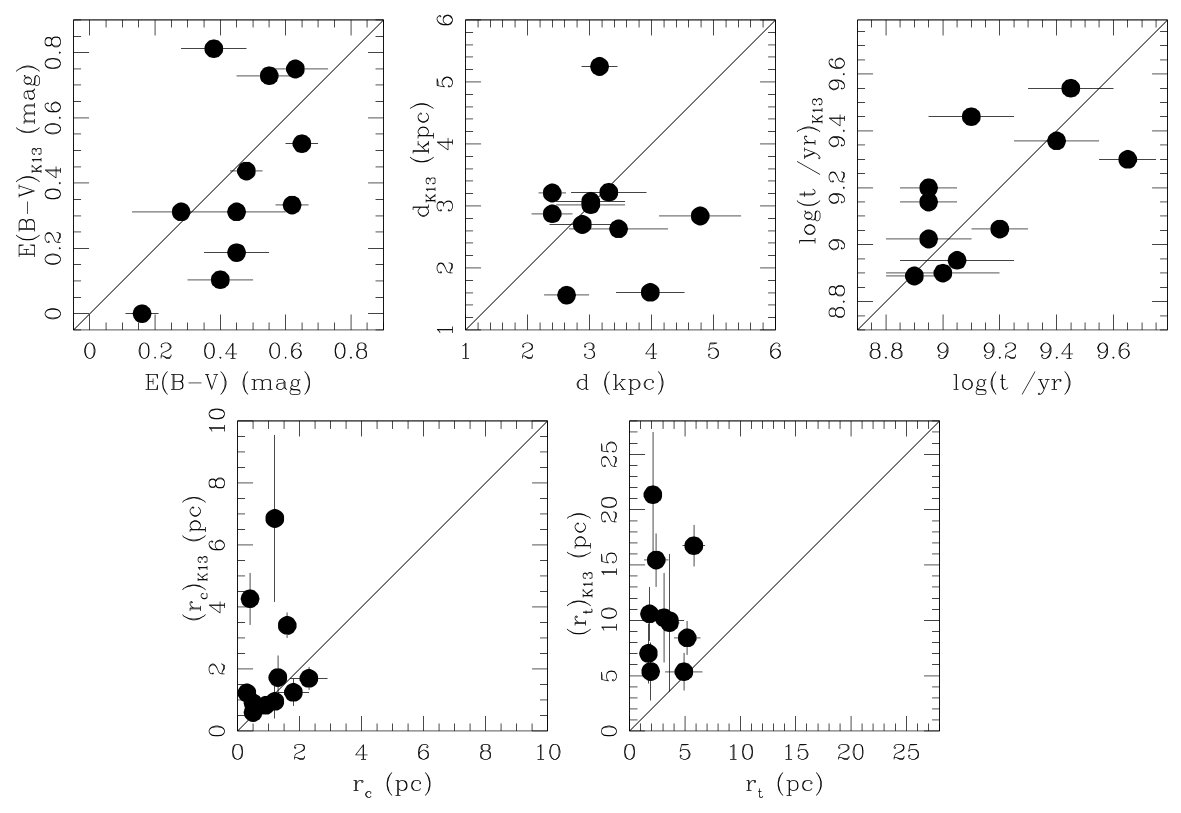 Figure 5
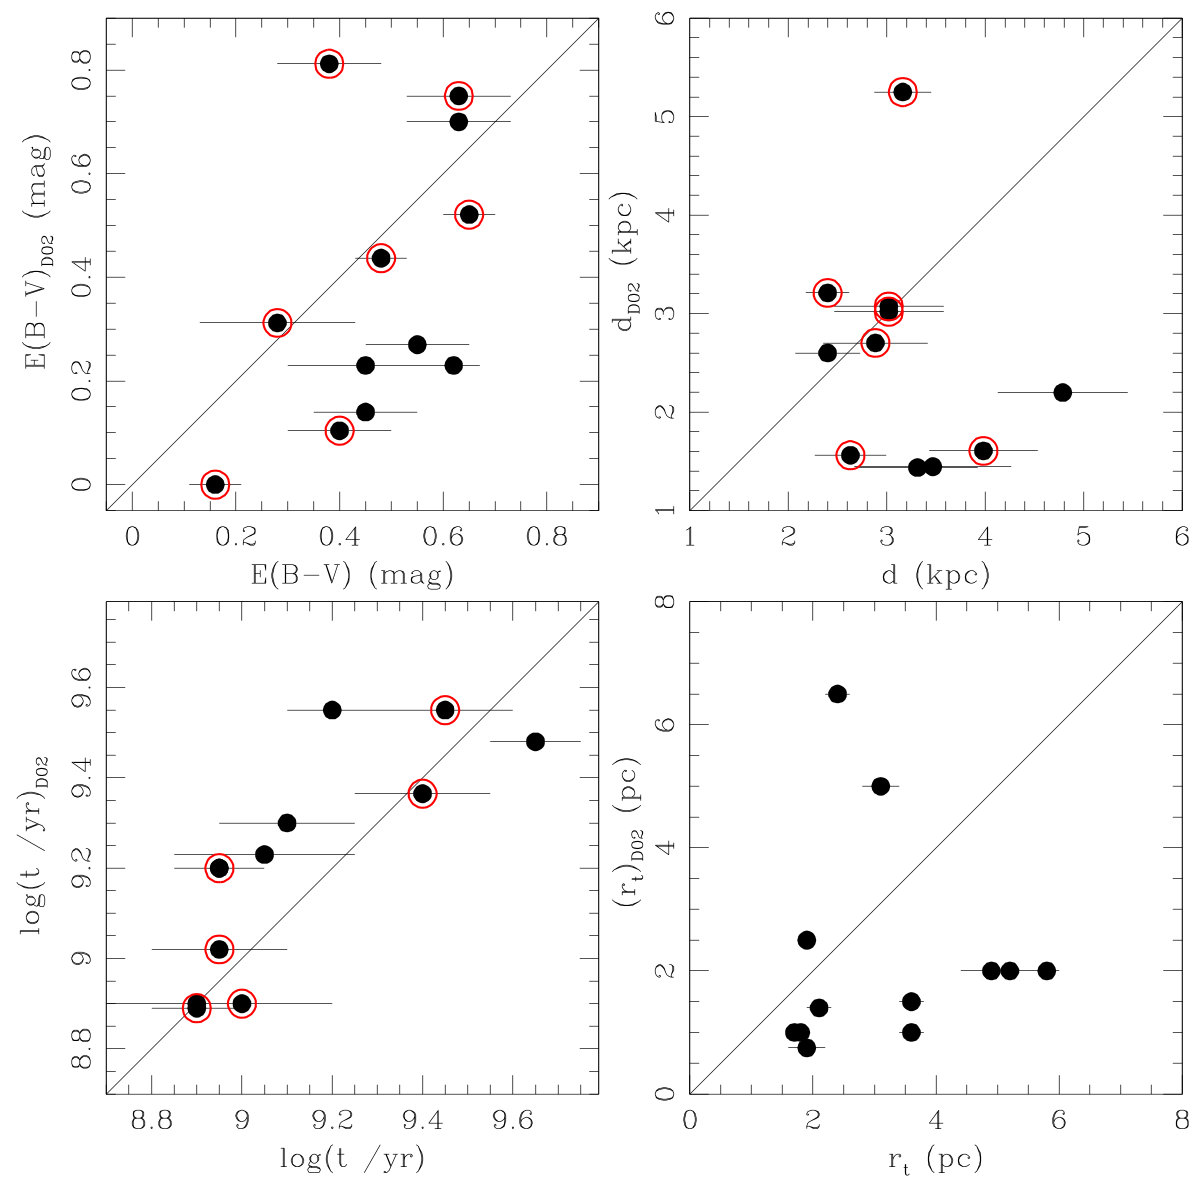 Figure 6
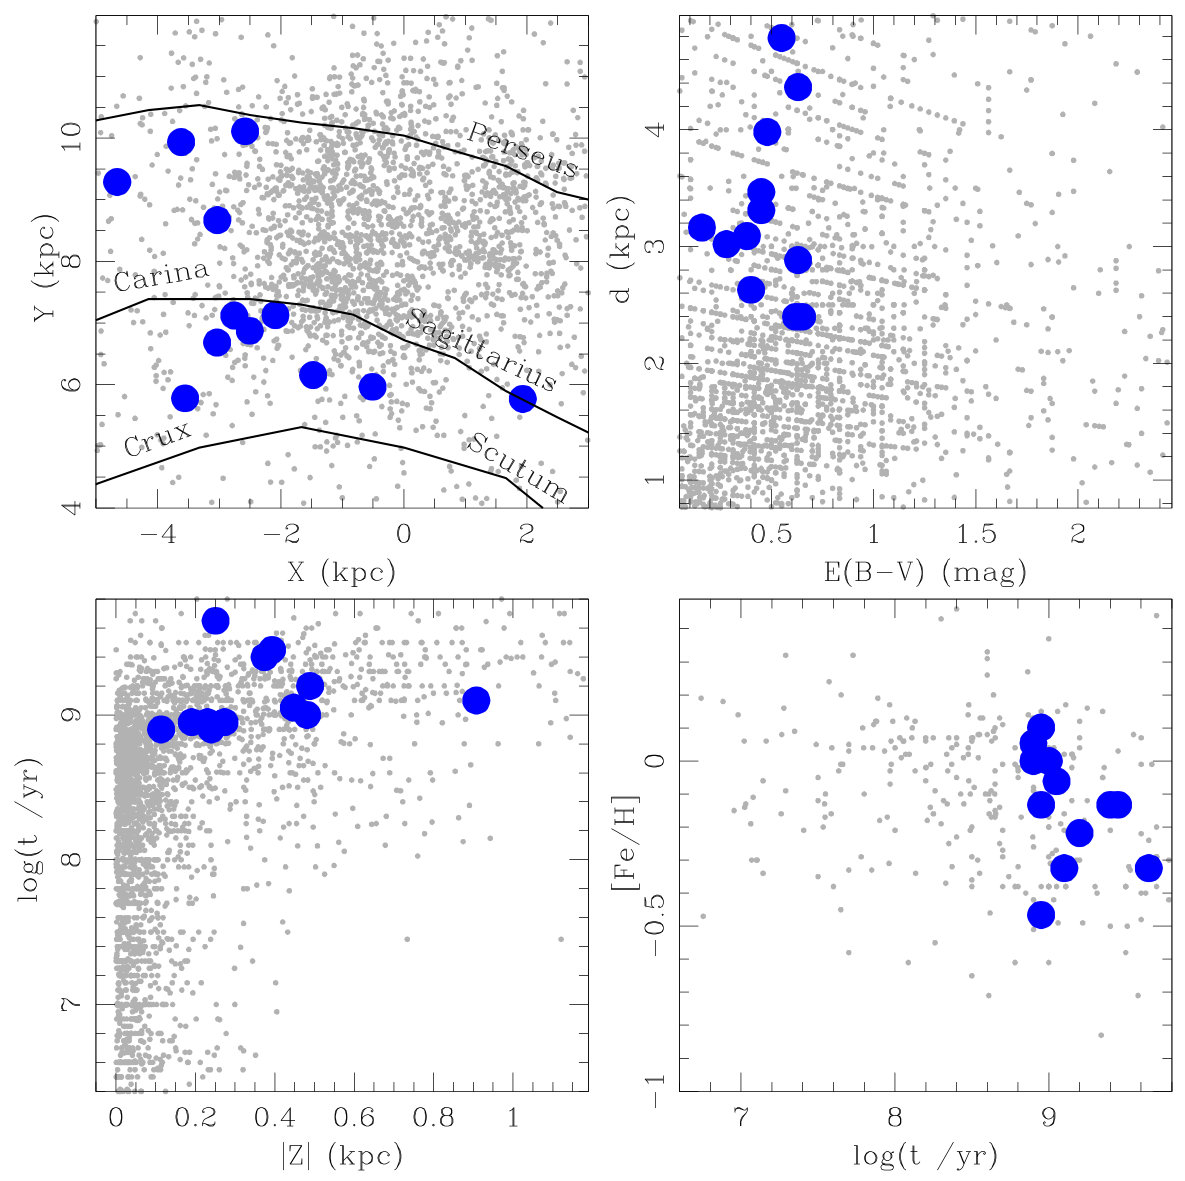 Figure 7
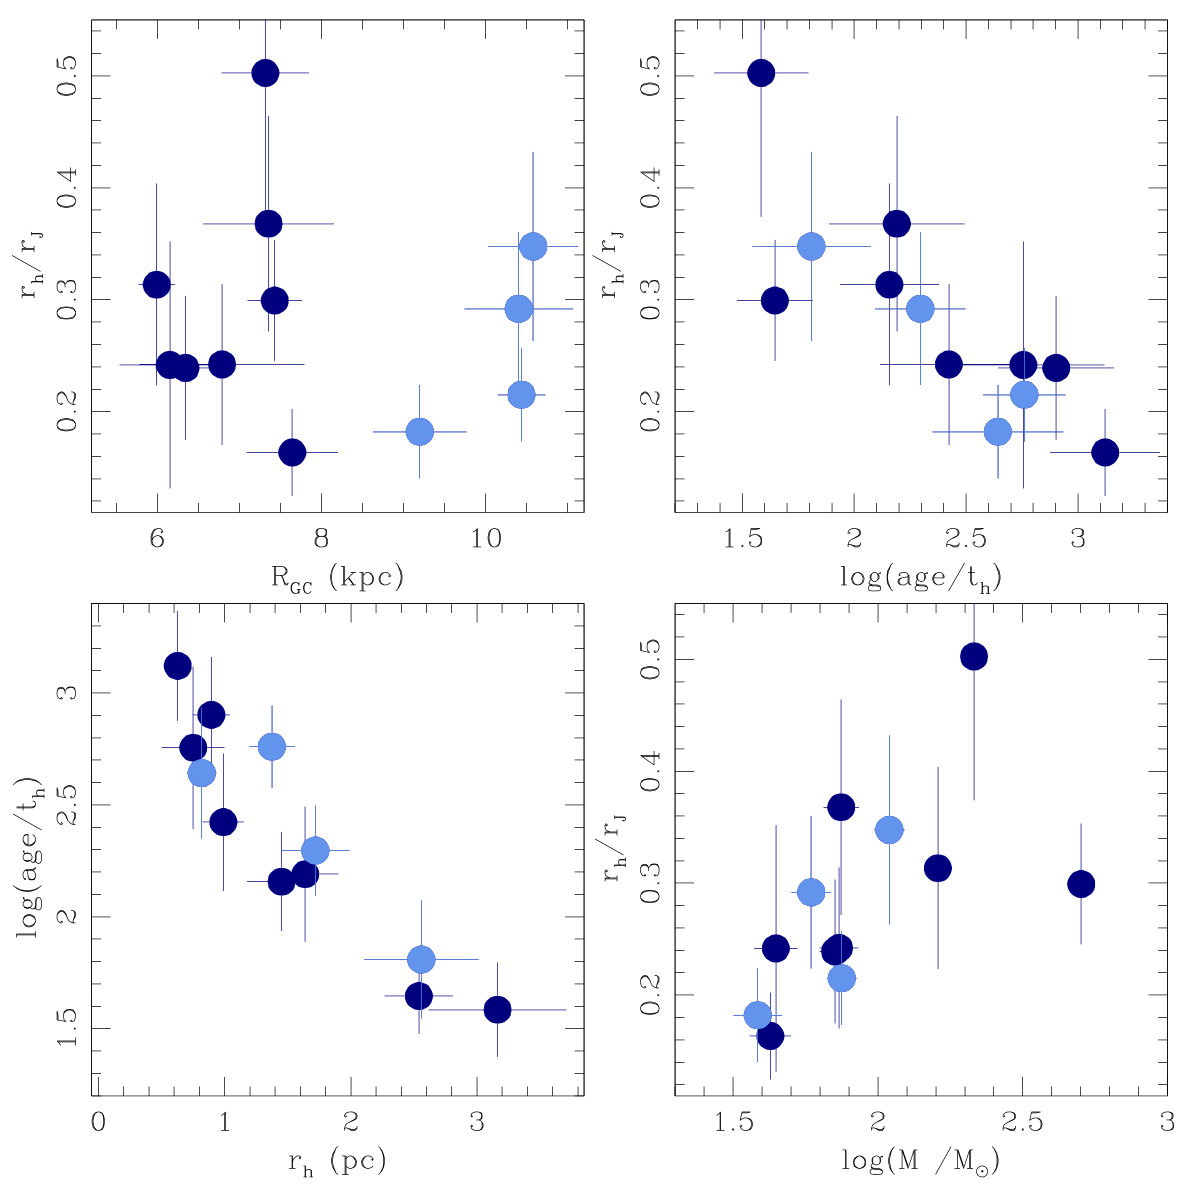 Figure 8
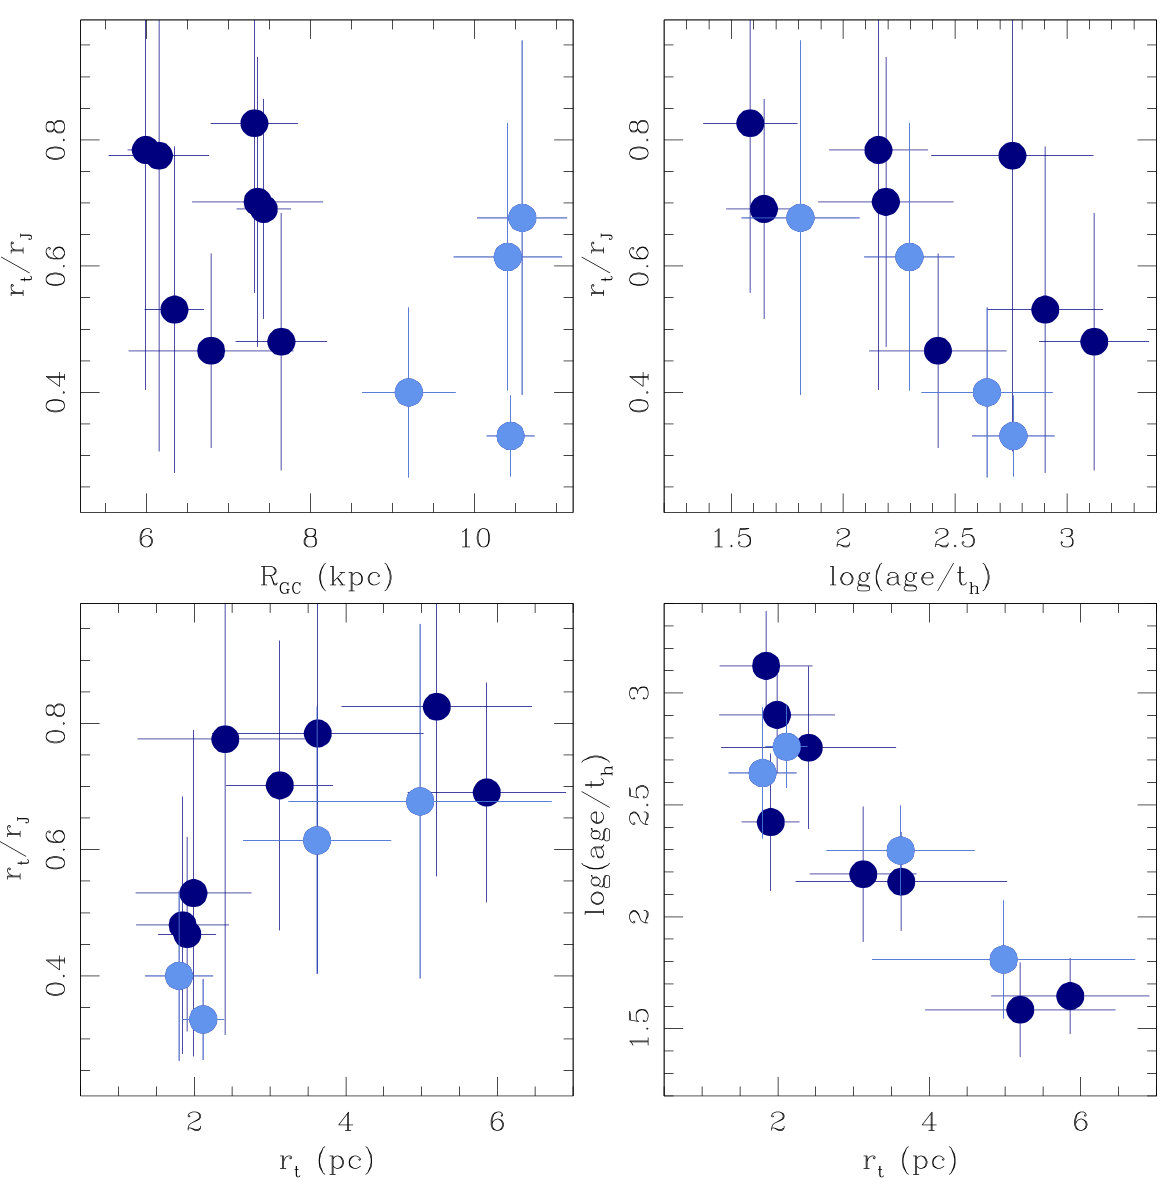 Figure 9
| Cluster | Filter | Exposure | FWHM | ||||
|---|---|---|---|---|---|---|---|
| (::) | (::) | (∘) | (∘) | (s) | () | ||
| ESO 96-SC04 | 13:15:16.0 | -65:55:16 | 305.36 | -03.16 | 230, 2300 | 1.1,1.1,1.1,1.1 | |
| 25,230 | 1.0,1.0,1.0,1.0 | ||||||
| ESO 137-SC23 | 16:24:30.5 | -61:43:59 | 325.50 | -08.59 | 230,45,300,450 | 1.0,1.0,1.0,1.1,1.1 | |
| 5,7,30,45 | 1.0,1.0,1.0,1.0 | ||||||
| ESO 334-SC02 | 17:36:56.9 | -42:14:06 | 347.75 | -05.51 | 230,2300 | 1.2,1.2,1.2,1.2 | |
| 35,230 | 1.1,1.1,1.1,1.1,1.0 | ||||||
| ESO 371-SC25 | 08:53:00.0 | -35:28:01 | 258.00 | +05.86 | 15,20,2350 | 1.1,1.1,1.1,1.1 | |
| 15,30,60,2120 | 1.0,1.0,1.1,1.0,1.0 | ||||||
| ESO 429-SC13 | 07:41:03.0 | -30:44:06 | 245.63 | -03.94 | 15,330,90 | 1.1,1.2,1.2,1.2,1.2 | |
| 210,60 | 1.2,1.2,1.2 | ||||||
| NGC 4230 | 12:17:20.4 | -55:07:12 | 298.02 | +07.42 | 30,45 | 1.3,1.3 | |
| 5,7 | 1.2,1.2 | ||||||
| NGC 4337 | 12:24:00.0 | -58:07:01 | 299.30 | +04.56 | 230, 2300 | 1.1,1.1,1.1,1.1 | |
| 25,230 | 1.0,1.0,1.1,1.1 | ||||||
| NGC 6525 | 18:02:00.0 | +11:01:24 | 037.36 | +15.91 | 10,15,2300 | 1.2,1.2,1.2,1.2 | |
| 25,230 | 1.1,1.1,1.1,1.1 | ||||||
| Ruprecht 37 | 07:49:51.6 | -17:13:30 | 234.92 | +04.54 | 240,300,450 | 1.0,1.0,1.1,1.1 | |
| 10,330,90 | 1.0,1.0,1.0,1.0,1.1 | ||||||
| Ruprecht 74 | 09:21:00.0 | -37:07:01 | 263.03 | +08.96 | 30,60,2600 | 1.3,1.3,1.3,1.3 | |
| 10,15,2120 | 1.2,1.2,1.2,1.2 | ||||||
| Ruprecht 104 | 12:25:01.2 | -60:26:42 | 299.67 | +02.25 | 60,90,900 | 1.2,1.2,1.3 | |
| 230,180 | 1.2,1.2,1.2 | ||||||
| Ruprecht 163 | 11:04:53.3 | -67:56:35 | 293.16 | -07.11 | 90,180,900 | 1.1,1.1,1.2 | |
| 40,60,2180 | 1.1,1.1,1.1,1.1 |
| Cluster | log( /yr) | [Fe/H] | ||||||||
|---|---|---|---|---|---|---|---|---|---|---|
| (mag) | (mag) | (dex) | (pc) | (pc) | (pc) | (pc) | () | (Myr) | ||
| ESO 96-SC04 | 0.630.10 | 13.20.5 | 8.900.20 | 0.050.15 | 0.80.3 | 0.90.1 | 1.90.3 | 4.00.5 | 7311 | 3.00.7 |
| ESO 137-SC23 | 0.400.10 | 12.10.3 | 9.450.15 | -0.130.23 | 0.50.1 | 0.80.1 | 1.90.7 | 3.70.3 | 718 | 3.50.8 |
| ESO 334-SC02 | 0.650.05 | 11.90.2 | 8.950.10 | 0.100.13 | 0.90.2 | 1.40.2 | 3.61.3 | 4.60.4 | 16115 | 6.21.7 |
| ESO 371-SC25 | 0.550.10 | 13.40.3 | 9.200.10 | -0.210.18 | 1.20.2 | 1.70.2 | 3.60.9 | 5.80.4 | 589 | 8.01.9 |
| ESO 429-SC13 | 0.480.05 | 13.00.3 | 8.950.15 | -0.130.15 | 1.80.5 | 2.50.4 | 4.91.7 | 7.30.4 | 10913 | 13.83.6 |
| NGC 4230 | 0.450.15 | 12.70.5 | 9.050.20 | -0.060.19 | 1.30.3 | 1.60.2 | 3.10.7 | 4.40.4 | 7410 | 7.21.7 |
| NGC 4337 | 0.620.05 | 11.90.3 | 8.950.10 | -0.460.33 | 1.60.2 | 2.50.2 | 5.81.0 | 8.40.6 | 50328 | 20.13.2 |
| NGC 6525 | 0.450.10 | 12.60.4 | 9.100.15 | -0.320.24 | 0.40.2 | 0.70.2 | 2.41.1 | 3.10.3 | 447 | 2.21.1 |
| Ruprecht 37 | 0.160.05 | 12.50.2 | 9.650.10 | -0.320.24 | 1.20.2 | 1.30.1 | 2.10.2 | 6.30.4 | 758 | 7.71.5 |
| Ruprecht 74 | 0.380.10 | 12.40.4 | 9.000.20 | 0.000.22 | 0.50.1 | 0.80.1 | 1.70.4 | 4.40.3 | 387 | 2.20.4 |
| Ruprecht 104 | 0.630.10 | 12.30.4 | 8.900.10 | 0.000.17 | 2.30.6 | 3.10.5 | 5.21.2 | 6.20.5 | 21418 | 20.65.3 |
| Ruprecht 163 | 0.280.15 | 12.40.4 | 9.400.15 | -0.130.23 | 0.30.1 | 0.60.1 | 1.80.6 | 3.80.3 | 427 | 1.90.4 |
Peer Reviews
No public reviews on file for this paper yet. If you reviewed it on a platform where reviews are public (OpenReview, ICLR, NeurIPS, ICML), you can paste yours below so the community can read it here.
Videos
No videos yet. Explain this paper in a talk, walkthrough, or lecture? Add one.
Nearly coeval intermediate-age Milky Way star clusters
at very different dynamics evolutionary stages
Andrés E. Piatti1,2, Mateus S. Angelo3 and Wilton S. Dias4
1Consejo Nacional de Investigaciones Científicas y Técnicas, Godoy Cruz 2290, C1425FQB, Buenos Aires, Argentina
2Observatorio Astronómico de Córdoba, Laprida 854, 5000, Córdoba, Argentina
3Centro Federal de Educação Tecnológica de Minas Gerais, Av. Monsenhor Luiz de Gonzaga, 103, 37250-000 Nepomuceno, MG, Brazil
4UNIFEI, Instituto de Física e Química, Universidade Federal de Itajubá, Av. BPS 1303 Pinheirinho, 37500-903 Itajubá, MG, Brazil E-mail: [email protected]
(Accepted XXX. Received YYY; in original form ZZZ)
Abstract
We report astrophysical properties of 12 Milky Way open clusters located beyond a 2 kpc circle around the Sun by using deep optical photometry. We estimated their age and metallicities on the basis of a maximum likelihood approach using astrometric members determined from Gaia DR2 data. The studied clusters turned out to be of intermediate-age (0.8 - 4.0 Gyr), with metallicities spanning the range [Fe/H] -0.5 - +0.1 dex, and distributed within the general observed trend of the Milky Way disc radial and perpendicular metallicity gradients. As far as we are aware, these are the first metal abundance estimates derived for these clusters so far. From the constructed stellar density radial profiles and cluster mass functions we obtained a variety of structural and internal dynamics evolution parameters. They show that while the innermost cluster regions would seem to be mainly shaped according to the respective internal dynamics evolutionary stages, the outermost ones would seem to be slightly more sensitive to the Milky Way tidal field. The nearly coeval studied clusters are experiencing different levels of two-body relaxation following star evaporation; those at more advanced stages being more compact objects. Likewise, we found that the more important the Milky way tides, the larger the Jacobi volume occupied by the clusters, irrespective of their actual sizes and internal dynamics evolutionary stages.
keywords:
(Galaxy:) open clusters and associations: general – (Galaxy:) open clusters and associations: individual – technique: photometric.
††pubyear: 2019††pagerange: Nearly coeval intermediate-age Milky Way star clusters at very different dynamics evolutionary stages–Nearly coeval intermediate-age Milky Way star clusters at very different dynamics evolutionary stages
1 Introduction
The study of Galactic open clusters has long helped improve our understanding of the Milky Way disc formation and evolution. For instance, from their positions, ages and metallicities, the radial metallicty gradient as well as that perpendicular to the Galactic plane have been derived, which in turn have been used to constrain Milky Way formation theoretical models (Magrini et al., 2009; Sahijpal & Kaur, 2018). Different photometric and spectroscopic surveys have been exploited in order to derive improved cluster parameters and first estimates of the astrophysical properties of unstudied ones (e.g. Cantat-Gaudin et al., 2018; Carrera et al., 2019). Although there has been an interesting progress in constructing open clusters’ parameter catalogues (Dias et al., 2002; Kharchenko et al., 2013), the remaining work is still huge, because of the growing number of identified new open clusters (Cantat-Gaudin et al., 2018; Castro-Ginard et al., 2018; Ferreira et al., 2019).
With the aim of contributing to a comprehensive knowledge of the open cluster system, we searched the National Optical Astronomy Observatory (NOAO) Science Data Management Archives111http://www.noao.edu/sdm/archives.php. looking for Washington photometric system images centred on mostly unstudied open cluster fields. We chose the Washington photometric system because of our experience in estimating star cluster fundamental parameters and its ability in estimating cluster metallcities (see, e.g. Piatti et al., 2004, 2017, and references therein). From the search, we found that the Cerro Tololo Interamerican Observatory (CTIO) programme no. 2008A-0001 (PI: Clariá) was aimed at observing nearly 80 mostly unstudied open clusters. We have started to analyse them in Angelo et al. (2018) and Angelo et al. (2019a). Here, we focus on all the remaining clusters with ages 1 Gyr, because their structural properties tell us about the wide range of internal dynamical evolutionary stages they can span.
In Section 2 we present the unpublished publicly available Washington data sets used in this work, alongside a brief description of the procedure followed to obtained the standardised photometry, and hence, the resulting clusters’ features. Section 3 deals with the analysis of their astrophysical properties in the context of the Milky Way chemical evolution framework, and of their structural parameters. The latter are discussed to the light of the disruption processes due to stellar evolution and tidal forces. Finally, Section 4 summarises the main conclusions of this work.
2 cluster parameter estimates
The collected Washington and Kron-Cousins images were obtained at the CTIO 0.9m telescope with the Tek2K CCD imager attached (scale = 0.4 arcsec pixel-1, FOV = 13.613.6 arcmin2). We downloaded calibrations frames (bias, dome- and sky-flats), standard star field and programme images (see Table 1), which were processed following the standard pipeline with quadred tasks in the iraf222IRAF is distributed by the National Optical Astronomy Observatories, which is operated by the Association of Universities for Research in Astronomy, Inc., under contract with the National Science Foundation. package. PSF photometry was obtained through the starfinder code (Diolaiti et al., 2000) by modelling the PSF from high signal-to-noise and relatively isolated stars and by keeping only magnitudes of stars with the correlation coefficients between the measured profile and the modelled PSF greater than 0.7. Astrometric coordinates for all the stars were obtained by transforming the CCD ones into those given by Gaia DR2 (Gaia Collaboration et al., 2016, 2018), while their magnitudes in the standard Washington system were obtained from transforming the instrumental magnitudes using the transformation equations derived in Angelo et al. (2018).
2.1 Selection of cluster members
In order to disentangle probable cluster members from field stars in the present Washington data set, we applied the method developed by Angelo et al. (2019b), which runs on the basis of Gaia DR2 proper motions (α, δ) and parallaxes (). The method compares in the 3D parameter space (α, δ, ) the distributions of stars located within the cluster tidal radius and beyond that. Such a comparison is carried out in three steps, namely: a uniform grid of cells is built with sizes 10\times$$\Delta(\mu$${}_{\alpha}), 10\times$$\Delta(\mu$${}_{\delta}) and 1\times$$\Delta(\varpi), where \Delta(\mu$${}_{\alpha}), \Delta(\mu$${}_{\delta}) and are the mean uncertainties for the whole sample of cluster and control field stars. Then, the 3D Gaussian distributions of stars located inside and outside the cluster tidal radius for each defined cell are compared, looking for local stellar overdensities that are statistically distinguishable from the distribution of field stars, and flagged those stars located inside the tidal radius with 1 (probable member) or 0 (non-member). Finally, the individual membership likelihood for stars flagged 1 are estimated from the comparison of the number of them in a particular cell with respect to the weighted average number of them throughout all the cells.
We repeated these steps for cells one third smaller and bigger than those initially used, so that for each star we assigned 27 different membership likelihood, whose median was adopted as the final membership probability (). In the subsequent analysis we considered probable clusters members those with 0.7. Figs. 1 and 2 show, respectively, the vector-point diagrams and the versus plane for all the stars measured in the field of the selected clusters coloured according to the resulting membership probabilities (colour-coded bar placed at the top of the figures). Large and small symbols represent probable members and non-members, respectively. Particularly small grey symbols are field stars located beyond the cluster tidal radii.
2.2 Cluster fundamental properties
Mean ages (log( /yr)), metallicities ([Fe/H]), true distances moduli () and reddenings () for the cluster sample were estimated using stars with 0.7. In some cases, we added some few stars without Gaia DR2 data to which we assigned photometric membership probabilities higher than 0.7 on the basis of the procedure developed by Maia et al. (2010). Basically, their method compares the distributions of stars in the versus colour-magnitude diagram (CMD) located inside and outside the cluster tidal radius. Such distributions are built using a grid of cells uniformly distributed in the CMD, and the comparison iterated for grids with cells of different sizes and then averaged all the individual photometric memberships.
Since the four cluster properties are not fully independent one to each other, we employed the Automated Stellar Cluster Analysis suit of functions (ASteCA, Perren et al., 2015) – devised for running for Washington photometry – to build thousands of synthetic cluster CMDs which were matched to the observed ones in order to find the best solutions for the cluster astrophysical parameters (see, e.g. Piatti, 2017; Piatti & Cole, 2017). These synthetic CMDs are generated using the theoretical isochrones of Bressan et al. (2012), an initial mass function according to Chabrier (2001), a 50 per cent of binaries (von Hippel, 2005) with secondary masses drawn from a uniform distribution between the mass of the primary star and a fraction of 0.7 of it, and the appropriate magnitude completeness and photometric errors. We used a grid of , , log( /yr) and [Fe/H] values with steps of () = 0.01 mag, () = 0.1 mag, (log( /yr)) = 0.01, and () = 0.002 ([Fe/H] = log() with = 0.0152, Bressan et al. (2012)), respectively. Particularly, a first guess for the distance moduli were obtained from = 5 log(100/), where are the mean cluster parallaxes derived from astrometric membership.
Fig. 3 shows the versus CMDs for all the measured stars in the fields of the studied clusters. We have highlighted those with 0.7 and superimposed the isochrones corresponding the best-matched synthetic cluster CMDs, while Table 2 lists the resulting cluster astrophysical properties.
2.3 Cluster structural parameters and masses
We used all the measured stars in the selected cluster fields to construct cluster stellar density radial profiles by counting the number of stars within concentric rings centred on the clusters’ centres. We considered annuli of the same width, from 0.50 up to 1.50 arcmin, in steps of 0.25 arcmin. From the five constructed radial profiles per cluster we computed the average stellar density and dispersion as a function of the distance from the cluster centre and built the mean cluster radial profiles shown with open circles and error bars in Fig. 4. As can be seen, the background level of each cluster has been properly traced, so that we adopted the mean value of them to be subtracted to the observed radial profiles and obtain the background subtracted ones (filled circles). The cluster radii, defined as the distance from the cluster centre where the combined cluster plus background stellar density profile is no longer readily distinguished from a constant background value within 1 of its fluctuation, are also depicted with vertical lines.
King (1962)’s (eq.(1)) and Plummer (1911)’s (eq.(2)) models were fitted to the background subtracted radial profiles in order to derive the cluster core (), half-light () and tidal () radii, respectively. is related to the Plummer radius by the relation 1.3. We used a grid of (,,) values to fit the radial profiles by minimisation. Fig. 4 illustrates the resulting best-fitted curves.
[TABLE]
[TABLE]
We also derived the cluster Jacobi radii () – the distance from the cluster centre beyond which the Milky Way gravitational field dominates the stellar dynamics – using the expression:
[TABLE]
where is the cluster mass and is the Milky Way mass comprised within a radius equal to the Galactocentric cluster distance (). The latter is obtained from the cluster Galactic coordinates (,b) (see Table 1) and the cluster heliocentric distance = 1010 (see Table 2). As for the Milky Way mass, we used 1.01011 (Carraro & Chiosi, 1994; Bonatto et al., 2005; Taylor et al., 2016). In order to obtain the cluster masses, we employed the individual masses of probable members () from interpolation from the corresponding theoretical isochrones (Bressan et al., 2012), properly shifted according to the clusters distance modulus and reddening, to build the cluster mass functions, i.e., () = . For each mass bin, () was weighted by the star membership probabilities, corrected by photometric completeness (see Fig. 2 of Angelo et al., 2018) and assumed Poisson statistics for uncertainty determination. were then estimated from summing the masses along the different mass bins of the observed () with uncertainties coming from propagation of errors.
Finally, we estimated the half-light relaxation times from (Spitzer & Hart, 1971) :
[TABLE]
where is the average mass of the cluster stars obtained from the cluster mass distribution functions. The resulting different radii (, , , ), cluster photometric masses and relaxation times are listed with their uncertainties in Table 2.
3 Analysis and discussion
We first compared the resulting cluster parameters with those included in the Kharchenko et al. (2013, hereafter K13) open cluster catalogue, which were derived from the 2MASS database (Skrutskie et al., 2006). Note that they cleaned cluster CMDs from the contamination of field stars on the basis of the PPMXL astrometric catalogue (Roeser et al., 2010), thus dealing with the brighter parts of the cluster CMDs (Kharchenko et al., 2012). The results obtained by K13 are based on photometric data less deep than the present Washington photometric data sets and on assumed solar values for the cluster metallicities of those not published in Dias et al. (2002, version 3.5, January 2016, hereafter DAML02). Fig. 5 illustrates the results of the comparison, where we plotted the values for 11 clusters in common (ESO 96-SC04 is the only one not included in K13). As can be seen, there is not a tight agreement, particularly for the clusters’ tidal radii.
K13 did not fit the stellar density cluster radial profiles as we did in Sect. 2.3, because that method did not work for the majority of their cluster sample; the main reason being that they reached a relatively bright magnitude limit, so that the low number of members led to uncertainties in the radial profiles. Instead, K13 fitted cumulative radial profiles, with a particular care in choosing the integration limits and background levels, because of the relative high proportion of field stars along the cluster line-of-sight (Piskunov et al., 2007). Similarly to Fig. 5 (bottom-right panel), they found that clusters in common with Froebrich et al. (2007) show systematically larger core and tidal radii.
DAML02 compiled a catalogue of open cluster parameters taken from the literature, which we also compared with the present ones. All the 12 studied clusters are included in DAML02. Fig. 6 illustrates the results.The interstellar reddenings, heliocentric distances and ages compare with our values similarly as those from K13 did (see Fig. 5). However, the tidal radii – here we used ( DAML02’s diameter)/2 – are in a better agreement, thus bringing some additional evidence about the contraints in the K13’s tidal radii mentioned above. In the subsequent analysis, we will use the resulting parameters derived in this work. We notice that the studied clusters are relatively small objects as compared to the observed range of sizes of Milky Way open clusters (DAML02).
Fig. 7 depicts different relationships between cluster parameters with the aim of bringing the reader an overview of the selected cluster sample. The top-left panel shows that the studied clusters are located beyond the bulk of catalogued open clusters. They are not the farthest open clusters detailed studied until know, but populate a region where studied open clusters are remarkably less in number than those distributed within 2 kpc from the Sun, so that the present cluster sample objectively contributes to our knowledge to the open cluster system.
Despite their relatively large heliocentric distances, the studied clusters have interstellar reddenings similar to those located much closer to the Sun (top-right panel of Fig. 7), possibly because they are placed above the Milky way plane (Z 0.1 kpc, bottom-left panel of Fig. 7). The latter is also a feature of intermediate-age open clusters that have been formed out of the thick disc’s gas, so that due to their orbital motions they can be found at relatively large heights out of the plane (Joshi, 2018). Interestingly, the clusters’ metallicities span a relative wide range in the age-metallicity relationship (bottom-right panel), in very good agreement with the observed Milky Way disc metallicty gradient (Reddy et al., 2016; Magrini et al., 2017). Note that we have used ages and [Fe/H] values from the DAML02’s catalogue as a reference. From their present heights, their intermediate-ages and expected orbital motions, they could have passed across the Milky Way plane several times, and thus have experienced tidal shocks, interaction with giant molecular clouds, etc, that could have contributed somehow in shaping their present internal structures.
It is widely accepted that star clusters lose mass through two main processes, namely: stellar evolution and disruption caused by the interaction with the host galaxy (Lamers et al., 2005). The former is more important during the first hundred Myrs, while the latter dominates afterwards, when the mass loss due to stellar evolution starts to decrease very slowly (Shukirgaliyev et al., 2018). Because of the Milky Way potential gravitational field varies with the distance from its centre, it is expected that mass loss by tidal effects follows a similar trend. Hence, the amount of mass lost in very distance star clusters should be smaller than those moving in the Milky Way bulge.
Fig. 7 (top-left panel) hints at two groups of open clusters among the studied sample, i.e, those located closer or farther than 8 kpc from the Milky Way centre. In Fig. 8 (top-left panel) we have drawn the ratio of the half-light radius to Jacobi radius as a function of the Galactocentric distance. As can be seen, there is no trend suggesting that the ratios of the clusters in our sample located inside or outside the solar circle ( = 8.3 kpc de Grijs & Bono (2017)), which very close to the corotation radius (8.510.64 kpc Dias et al., 2019), have been differentially affected by the Milky Way tidal field. From this outcome, we interpret that any difference in the cluster ratios has been mainly due to the internal dynamics evolution. Indeed, the top-right panel of Fig. 8 clearly shows that the ratio correlates with the times the clusters have lived their median relaxation times, in the sense that the more dynamically evolved a cluster, the smaller its ratio. This means that clusters in more advanced dynamics evolutionary stages have their integrated light ( mass) more centrally concentrated. Note that these clusters are of nearly similar intermediate-age, so that the different evolutionary stages would not seem to come from an age difference but rather from distinct cluster masses. As shown in the bottom-right panel of Fig. 8, more massive clusters have larger ratios, and hence they are also less dynamically evolved (see top-right panel of Fig. 8). They have also half-light radii larger than those more dynamically evolved (see bottom-left panel of Fig. 8).
According to Lamers & Gieles (2006), low mass clusters in the solar neighbourhood are easily destroyed by tidal shocks due to e.g. giant molecular clouds and spiral arms. They found that a cluster located closer than 600 pc from the Sun with an initial mass of 104 is disrupted in 1.7 Gyr, while 0.4 Gyr are needed to destroy a cluster with a initial mass of 103. We cannot directly apply these numbers to the present cluster sample, since they are distributed outside the solar neighbourhood, but these numbers suggest us that the studied clusters could have had initial masses larger than 103. Therefore, the small observed masses lead us to conclude that these clusters have lost most of their initial masses. Recently, Reina-Campos et al. (2019) found in the E-MOSAICS simulations of present-day Milky Way mass galaxies (Pfeffer et al., 2018) that low-mass clusters lose more mass than those more massive, in very good agreement with our findings.
The mechanisms from which the studied clusters could have lost mass are possibly two-body relaxation following star evaporation. These processes make that the initially dynamically warmer inner regions of a cluster transfer energy to the cooler outer regions, so that low-mass stars reach the outer cluster regions, while the cluster core contracts (Portegies Zwart et al., 2010). Those low-mass stars that travel over the Jacobi radius become gravitationally unbounded and disperse into the background (Bonatto et al., 2004). Consequently, clusters that have lost more low-mass stars are relatively more compact (smaller values), and have experienced more advanced internal dynamics evolutionary stages.
Piatti & Mackey (2018) showed that the dependence of the gravitational potential with the distance from the centre of the host galaxy could imprint differential tidal effects in the outermost structure of the star clusters, while the innermost one were mostly insensitive to such changes. We investigated this issue in Fig. 9, where instead of using half-light radii, we employed tidal ones (). The studied clusters exhibit a very light correlation with the Galactocentric distance (see top-left panel), in the sense that the larger the values the smaller the ratios. This result could suggest that the Milky Way gravitational field has been acting differentially on the outermost cluster regions, making that the expansion due to internal dynamics reached a larger percentage of the Jacobi volume.
This combined behaviour of dynamics evolution and tidal effects is also seen in the top-right panel of Fig. 9, where the ratio shows a more scattered relationship in terms log(age/) than that shown from the ratio (top-right panel of Fig. 8). Note that the relationship for clusters located inside the solar circle (dark blue symbols in top-right panel of Fig. 9) show larger dispersion compared with those of clusters placed outside the solar circle, possibly because the Milky Way gravitational field is stronger. Likewise, clusters of similar dimensions () located at smaller or larger than have occupied larger or smaller percentages of their Jacobi volumes, respectively. This trend might also be attributed to the differential tidal effects. Nonetheless, tidal radii are mainly driven by internal dynamics evolution (see bottom-right panel of Fig. 9).
4 Conclusions
We have exploited unpublished Washington photometric system images of intermediate-age open clusters with the aim of characterising their internal dynamics evolutionary stages. With that purpose, we selected a sample of 12 open clusters without available deep optical photometry, from which we derived their astrophysical properties.
The probable cluster members were firstly identified from a proven likelihood procedure that makes use of Gaia DR2 positions, parallaxes and proper motions. These bonafide samples of cluster stars were then used to find the best-solution estimates for the distance modulus, the reddening, the age and the metallicity of the open cluster sample. Because of the well-known degeneracy of these parameters in the cluster CMD, we applied a method that generated thousands of synthetic CMDs, taking into account binary effects and covering high resolution ranges in colour excess, distance, age and metal content. From all of them, we employed maximum likelihood statistics and adopted as cluster’s parameters those coming from the theoretical isochrone used to generate the best-matched synthetic CMD.
The studied open clusters are placed at heliocentric distances of 2.4 - 5 kpc and split in two groups, one between the Crux-Scutum and Carina-Sagittarius spiral arms and another between the Carina and the Perseus arms, respectively. Because of their relative large heights above the Milky Way plane (0.1 Z (kpc) 1.0, <$$|Z|$$> 0.4 kpc), they are affected by relatively moderate or low interstellar reddenings (0.1 (mag) 0.7, <$$E(B-V)$$> 0.4 mag). Their age range spans from 0.8 up to 4.0 Gyr with an average of 1.3 Gyr, and they cover the metallicity range [Fe/H] -0.5 - +0.1 dex ([Fe/H] -0.1 dex). As far as we are aware, these are the first metal abundance estimates derived for these clusters so far. The resulting astrophysical properties place the 12 studied objects within the observed trend of the Milky Way radial and perpendicular metallicity gradients.
From the constructed stellar density radial profiles, corrected from field star contamination, we derived core, half-light and tidal radii by minimisation of while fitting King (1962)’s and Plummer (1911)’s profiles. We also obtained their Jacobi radii and half-mass relaxation times using the above derived parameters and clusters’ masses calculated from mass functions built with stars with membership probabilities higher than 0.7.
As far as the innermost regions of the clusters are considered, as traced by the ratio, we found that their spread of Galactocentric distances ( 2 kpc) and hence of the different strength of the Milky Way gravitational field, would not seem to have had a direct effect in the ratios. Conversely, they would rather appear to depend on the stage of internal dynamics evolution (log(age/)), in the sense that the more advanced their internal dynamics evolution the smaller the ratios. Likewise, the less advanced their internal dynamics evolution, the larger both their observed masses and half-light radii. These findings reveal that the more the advanced the internal dynamics, the more compact and less massive the clusters, a behaviour that place this cluster sample within those clusters experiencing different levels of two-body relaxation following star evaporation.
The outermost cluster regions, monitored by the ratio with the Galactocentric distance, show a slightly different behaviour. Although the internal dynamical clocks play an important role, the outer cluster regions would seem also to have been shaped by the Milky Way tidal field. Some evidence of such an effect is shown in the subtle dependence of the ratio with the Galactocentric distance, in a more scatted correlation of the ratios with log(age/) than that observed for the ones and in a different percentage of expansion within the Jacobi volume for clusters located inside or outside the corotation radius, respectively. In general, we found that the farther a cluster from the Milky Way centre, the smaller the volume occupied within the respective Jacobi one, irrespective of their actual sizes () and internal dynamics evolutionary stages.
Acknowledgements
We thank the referee for the thorough reading of the manuscript and timely suggestions to improve it. This work presents results from the European Space Agency (ESA) space mission Gaia. Gaia data are being processed by the Gaia Data Processing and Analysis Consortium (DPAC). Funding for the DPAC is provided by national institutions, in particular the institutions participating in the Gaia MultiLateral Agreement (MLA). The Gaia mission website is https://www.cosmos.esa.int/gaia. The Gaia archive website is https://archives.esac.esa.int/gaia.
The reference list from the paper itself. Each links out to its DOI / PubMed record.
- 1Angelo et al. (2018) Angelo M. S., Piatti A. E., Dias W. S., Maia F. F. S., 2018, MNRAS , 477, 3600 · doi ↗
- 2Angelo et al. (2019 a) Angelo M. S., Piatti A. E., Dias W. S., Maia F. F. S., 2019 a, ar Xiv e-prints, p. ar Xiv:1906.07890
- 3Angelo et al. (2019 b) Angelo M. S., Santos J. F. C., Corradi W. J. B., Maia F. F. S., 2019 b, A&A , 624, A 8 · doi ↗
- 4Bonatto et al. (2004) Bonatto C., Bica E., Pavani D. B., 2004, A&A , 427, 485 · doi ↗
- 5Bonatto et al. (2005) Bonatto C., Bica E., Santos J. F. C. J., 2005, A&A , 433, 917 · doi ↗
- 6Bressan et al. (2012) Bressan A., Marigo P., Girardi L., Salasnich B., Dal Cero C., Rubele S., Nanni A., 2012, MNRAS , 427, 127 · doi ↗
- 7Cantat-Gaudin et al. (2018) Cantat-Gaudin T., et al., 2018, A&A , 618, A 93 · doi ↗
- 8Carraro & Chiosi (1994) Carraro G., Chiosi C., 1994, A&A, 287, 761