Anomaly-based Intrusion Detection in Industrial Data with SVM and Random Forests
Simon D. Duque Anton, Sapna Sinha, and Hans Dieter Schotten

TL;DR
This paper explores machine learning techniques, specifically SVM and Random Forest, for anomaly detection in industrial network data to identify cyber-attacks on critical infrastructure.
Contribution
It evaluates the effectiveness of SVM and Random Forest algorithms on industrial control system data, highlighting feature selection and data handling methods.
Findings
Random Forest slightly outperforms SVM in detection accuracy
Both algorithms effectively identify anomalies in industrial network traffic
Feature extraction and missing data handling are crucial for performance
Abstract
Attacks on industrial enterprises are increasing in number as well as in effect. Since the introduction of industrial control systems in the 1970's, industrial networks have been the target of malicious actors. More recently, the political and warfare-aspects of attacks on industrial and critical infrastructure are becoming more relevant. In contrast to classic home and office IT systems, industrial IT, so-called OT systems, have an effect on the physical world. Furthermore, industrial devices have long operation times, sometimes several decades. Updates and fixes are tedious and often not possible. The threats on industry with the legacy requirements of industrial environments creates the need for efficient intrusion detection that can be integrated into existing systems. In this work, the network data containing industrial operation is analysed with machine learning- and time series-…
Click any figure to enlarge with its caption.
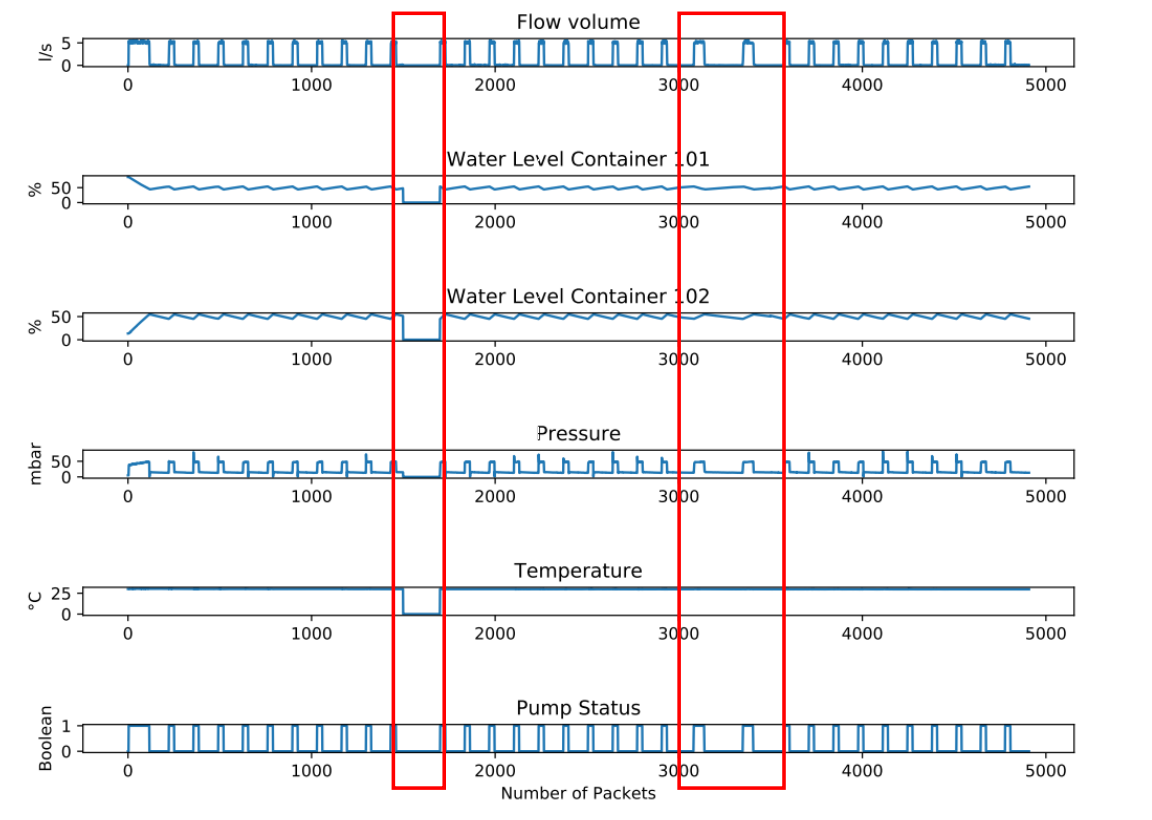 Figure 1
| ID | Protocol | No. of Packets | Duration | Attacks | No. of mal. Packets |
|---|---|---|---|---|---|
| DS1 | Modbus | 274 627 | 4 d | 60 048 | |
| DS2 | OPC UA | 4 910 | 41 m | 2 | 702 |
| Feature | Type |
| Address | Network information |
| Function Code | Command Payload |
| Length of Packet | Network Information |
| Setpoint | Command Payload |
| Gain | Command Payload |
| Reset Rate | Command Payload |
| Deadband | Command Payload |
| Cycle Time | Command Payload |
| Rate | Command Payload |
| System Mode | Command Payload |
| Control Scheme | Command Payload |
| Pump | Command Payload |
| Solenoid | Command Payload |
| Pressure Measurement | Response Payload |
| CRC Rate | Network Information |
| Command Response | Network Information |
| Time | Network Information |
| Binary Attack | Label |
| Categorised Attack | Label |
| Specific Attack | Label |
| Abbreviation | Label | Description |
|---|---|---|
| Normal | 0 | Normal Behaviour |
| NMRI | 1 | Naive Malicious Response Injection |
| CMRI | 2 | Complex Malicious Response Injection |
| MSCI | 3 | Malicious State Command Injection |
| MPCI | 4 | Malicious Parameter Command Injection |
| MFCI | 5 | Malicious Function Code Injection |
| DoS | 6 | Denial of Service |
| Recon | 7 | Reconnaissance |
| Feature | Relevance |
| Pressure | 0.177116 |
| Length | 0.134636 |
| CRC | 0.089498 |
| Cycle | 0.082905 |
| Reset | 0.082821 |
| Setpoint | 0.081545 |
| Function | 0.080561 |
| Gain | 0.068976 |
| Deadband | 0.060087 |
| Rate | 0.039752 |
| Command | 0.036751 |
| System | 0.022929 |
| Pump | 0.021371 |
| Control | 0.010001 |
| Solenoid | 0.009587 |
| Address | 0.001463 |
| Feature | Relevance |
| Water Temperature | 0.241810 |
| Water flow volume | 0.201617 |
| Water level container 1 | 0.160073 |
| Water level Container 2 | 0.156903 |
| Water pressure | 0.155168 |
| S111 | 0.034989 |
| S113 | 0.034306 |
| Pump running | 0.008172 |
| Pump status | 0.004048 |
| S112 | 0.002526 |
| B114 | 0.000387 |
| Ball valve acknowledge | 0.000000 |
| Metrics | DS1 | DS2 |
| Accuracy | 92.5% | 90.8% |
| Precision | 78.2% | 90.4% |
| Recall | 93.6% | 99.9% |
| F1 Score | 85.2% | 94.9% |
| DS1 | DS2 | ||||
|---|---|---|---|---|---|
| Method | Acc(%) | Exec. time (s) | Acc(%) | Exec. time (s) | |
| SVM | 92.53 | 11712 | 90.81 | 0.019 | |
| RF | 99.84 | 281 | 99.98 | 52.31 | |
Peer Reviews
No public reviews on file for this paper yet. If you reviewed it on a platform where reviews are public (OpenReview, ICLR, NeurIPS, ICML), you can paste yours below so the community can read it here.
Videos
No videos yet. Explain this paper in a talk, walkthrough, or lecture? Add one.
Anomaly-based Intrusion Detection in Industrial Data with SVM and Random Forests
††thanks: This work has been supported by the Federal Ministry of Education and Research of the Federal Republic of Germany (Foerderkennzeichen 16KIS0932, IUNO Insec). The authors alone are responsible for the content of the paper. This is a preprint of a work accepted but not yet published at the 27th International Conference on Software, Telecommunications and Computer Networks (SoftCOM). Please cite as: S.D. Duque Anton, S. Sinha, H.D. Schotten: “Anomaly-based Intrusion Detection in Industrial Data with SVM and Random Forests”. In: 27th International Conference on Software, Telecommunications and Computer Networks (SoftCOM), IEEE, 2019
1st Simon D. Duque Anton
Intelligent Networks Research Group
*German Research Center for AI
*Kaiserslautern, Germany
2nd Sapna Sinha
Intelligent Networks Research Group
*German Research Center for AI
*Kaiserslautern, Germany
3rd Hans Dieter Schotten
Intelligent Networks Research Group
*German Research Center for AI
*Kaiserslautern, Germany
Abstract
Attacks on industrial enterprises are increasing in number as well as in effect. Since the introduction of industrial control systems in the 1970’s, industrial networks have been the target of malicious actors. More recently, the political and warfare-aspects of attacks on industrial and critical infrastructure are becoming more relevant. In contrast to classic home and office IT systems, industrial IT, so-called OT systems, have an effect on the physical world. Furthermore, industrial devices have long operation times, sometimes several decades. Updates and fixes are tedious and often not possible. The threats on industry with the legacy requirements of industrial environments creates the need for efficient intrusion detection that can be integrated into existing systems. In this work, the network data containing industrial operation is analysed with machine learning- and time series-based anomaly detection algorithms in order to discover the attacks introduced to the data. Two different data sets are used, one Modbus-based gas pipeline control traffic and one OPC UA-based batch processing traffic. In order to detect attacks, two machine learning-based algorithms are used, namely SVM and Random Forest. Both perform well, with Random Forest slightly outperforming SVM. Furthermore, extracting and selecting features as well as handling missing data is addressed in this work.
Index Terms:
Machine Learning, Artificial Intelligence, Cyber Security, IT Security, Industrial
I Introduction
Over the last two decades, industrial systems have increasingly become the target of malicious actors [1]. In the 1970’s, electronic components were introduced to automate control systems, followed by Supervisory Control And Data Acquisition (SCADA) systems that allowed for reuse and reprogramming of components. At that time, security has not been an issue due to two reasons [2]: First, industrial networks, also known as Operation Technology (OT), are physically separated from Information Technology (IT) networks. Second, OT networks are highly application specific, an attacker supposedly has no chance of understanding and influencing the processes. However, the rise of the Industrial Internet of Things (IIoT) and Industry 4.0 rendered both assumptions obsolete. The fourth industrial revolution creates novel use cases, e.g. the digital factory [3], mostly based on the increased capabilities in communication and embedded intelligence. However, these use cases require interconnectivity and distribution of data, inherently breaking the above-mentioned assumptions. This drastically increases the attack surface, especially since most industrial communication protocols were not designed with security in mind. Many of them, such as Modbus [4, 5] Profinet [6], do not contain means for authentication or encryption. As a consequence, any attacker that has successfully broken the perimeter and moved laterally into the OT network can listen and participate in the communication. Breaking the perimeter of IT networks employed in the office area of industrial enterprises becomes the biggest hurdle for attackers and success in doing so leads to severe consequences, e.g. the blackout in the Ukrainian power grid in December of 2015, caused by a malware called Industroyer or Crashoverride [7, 8, 9]. Due to characteristics of OT networks, such as legacy devices, but also periodic and unique behaviour, Intrusion Detection Systems from the IT world cannot be transferred as they are. Adaptions have to be made, e.g. in creating industrial firewalls. In this work, methods based on machine learning as well as time series analysis are evaluated with respect to their capabilities to detect attacks in OT networks. The remainder of this work is structured as follows. An overview of related work is provided in Section II. The data sets used for the evaluation are introduced in Section III, the algorithms implemented to detect the attacks are presented in Section IV. In Section V, the results are presented and discussed. Finally, this work is concluded in Section VI.
II Related Work
Due to the relevance of industrial enterprises to the national wealth of industrial nations and the severe potential impacts of Cyber-Physical Production Systems on the physical world, industrial intrusion detection has gained relevance in the research community. Duque Anton et al. have evaluated industrial network data with classifiers [10] as well as with time series-based methods [11]. A survey regarding existing risk assessment methods is performed by Cherdantseva et al., as well as an assessment of the applicability of these methods in SCADA scenarios [12]. Zhu et al. provide an extensive overview of industrial IDSs along several dimensions and compare security in IT and OT networks [13]. Garcia-Teodoro et al. summarise challenges and solutions to anomaly detection in industrial networks [14]. Attacks on industrial networks are analysed and evaluated by Caselli et al. [15]. Khalili and Sami employ an a priori algorithm to detect attacks in industrial networks, based on their regularity and knowledge about critical states [16]. They focus on the timing behaviour of communication sequences that is expected to be regular in industrial environments. Gao and Morris address the detection of attacks in Modbus communication with the help of an attack classification and terminology [17]. Another approach for detection in the legacy Modbus communication is introduced by Morris et al. [18].
Wireless communication technologies are an enabler of novel business and application use cases for industry, although wireless systems contain inherent attack surfaces. A survey of intrusion detection in Wireless Sensor Networks is performed by Butun et al. [19]. Mobile Ad hoc NETworks are a certain kind of wireless network, addressed by Shakshuki et al. [20]. Wei et al. employ a prediction-based intrusion detection system for wireless industrial networks [21]. Shin et al. present methods of intrusion detection for such networks [22], commonly known as WSNs. Zhang et al. apply methods of intrusion detection to mobile networks [23]. A roadmap for the use of machine learning-based anomaly detection methods in industrial networks is provided by Meshram and Haas [24]. Schuster et al. propose a method for anomaly detection mechanisms based on learning a notion of normal behaviour [25]. An evaluation of several machine learning methods for detecting malicious activities in SCADA communication is provided by Beaver et al. [26]. Mukkamala et al. analyse the Defense Advanced Research Projects Agency (DARPA) Knowledge Discovery in Databases (KDD) cup ’99 with neural networks and Support Vector Machines in order to detect the attacks contained in the data set [27].
III Data Set
In this work, two distinct data sets are analysed with respect to detecting attacks. The data sets are derived from different sources as well as processes and employ different protocols, namely Modbus and Object Linking and Embedding for Process Control Unified Architecture (OPC UA). In the remainder of this work, the Modbus-based data set is referred to as DS1, the OPC UA-based one as DS2. An overview of both data sets can be found in Table I.
III-A Modbus-based Data Set DS1
The Modbus-based data set has been presented by Morris et al. [28]. A gas pipeline has been set up in a simulation environment. This data set is an extension of a previous work of Beaver et al. [26] which contained attacks that have been easily discovered by machine learning algorithms. The goal of this data set was to increase complexity and realism. Overall, the simulations consists of four parts: A Human Machine Interface (HMI), a Programmable Logic Controller (PLC), a network simulation and a virtual process. It is shown that an HMI and a Master Terminal Unit (MTU) respectively are used to control a control logic that, in turn, influences a pump and valve in a physical environment. In order to follow a real physical process as closely as possible, the Matlab Simulink package SimHydraulics (now called Simscape Fluids) [29] was used to simulate a pump, a valve, a pipeline and a fluid as well as its flow. The simulation has been run for the duration of four days, creating 274 627 packets, containing 20 features each. In Table II, the complete feature list is shown.
During this time, a total of 60048 attacks has been performed, belonging to one of 35 kinds of attack. These attacks are clustered into seven categories as listed in Table III. The complete list can be found in the work of Morris et al. [28].
III-B OPC UA-based Data Set DS2
The OPC UA-based data set analysed in this work is based on a real-world process environment introduced by Duque Anton et al. [30]. With the help of a Festo Didactic environment, the Festo Didactic MPS PA Compact Workstation, a batch processing scenario is set up. The water, originally contained in Container 1, is pumped into Container 2 by pump M102. Due to natural re-flow, Container 2 is drained over time. After the water level falls below a threshold value with a hysteresis, the pump is restarted and pumps water from Container 1 into Container 2 again. This normal behaviour is shown during the packets 0 to 1 500, from packet 1 800 to packet 3 000 and after packet 3 500 in Figure 1.
The attacks are from packet 1 500 to packet 1 800 and from packet 3 000 to packet 3 500, marked by red frames. In the first attack, all sensor and actuator values are set to 0, indicating an error in the process, causing a disruption due to necessary investigation and maintenance. For the second attack, the frequency of the process is cut in half. This causes a change in the process, still indicating activity.
IV Algorithms Used
In this work, SVMs have been used to analyse the data sets as described in Section III on packet basis.
IV-A SVMs
SVM is a large margin classifier, introduced by Boser et al. in 1992 [31]. Two classes of instances of dimensionality are divided by an dimensional hyperplane in a way that each instance has the maximal possible distance from the classifying hyperplane. The instances are noted as tuples, shown in (1) [32].
[TABLE]
is a vector describing an instance of data in an -dimensional feature space. describes the attribution of the instance as belonging to one of two classes, while is the number of instances. First, the SVM is trained with a labeled set of instances. It is a supervised classification method, meaning the training set needs to contain information about the correct classes. After training, the attribution of the test and productive data is performed with the signum-function as shown in (2). is the normal vector of the separator hyperplane, is the offset from the hyperplane.
[TABLE]
When applying SVMs, obtaining a linear hyperplane to divide the data set is desirable. However, some data sets might not allow that. In these cases, the so-called kernel trick can be applied [32]. This kernel trick can be used to map the input data space onto a higher dimensional feature space in a non linear fashion. The higher dimensional data space then can be divided by a hyperplane in a linear fashion.
IV-B Random Forests
Random Forests are collections of Decision Trees, binary classifiers consisting of one root node, several internal split nodes and leaf nodes that are used to classify events [33]. The classification of the Random Forest is done per majority vote of all Decision Trees. Random Forests are robust to over-fitting and converge quickly, making them applicable in a variety of use cases. In addition to classifying data, Random Forests provide means to determine the relevance of features on the classification result. This is done by measuring the decrease in accuracy if a feature is not considered for classification and the Gini index respectively. The Gini index is a measure for the pureness of a data set that is split according to a certain feature [34]. A high decrease in Gini index indicates a high importance of the feature for a correct classification. The decrease in accuracy is used to determine the feature relevance in Section V.
V Evaluation
In this section, the algorithms mentioned in Section IV are applied to the data sets introduced in Section III. First, the process of feature extraction is discussed and the features employed in anomaly detection are presented. Furthermore, the handling of missing data is addressed. After that, the performance of the respective algorithms is presented.
V-A Feature Selection
Feature selection is useful in cases of large datasets where some features can be omitted without compromising on the accuracy of the classification model, thereby resulting in reduced training time. This is done by finding relationships in the data and analysing various processes that help in extracting such relations. Selecting features that are capable of distinguishing between malicious and non-malicious instances is an important prerequisite to anomaly detection. There are hardly formal methods to identify insightful features. However, there are approaches to identify the impact of a feature on the outcome, e.g. with the importance score of Random Forests [35]. In this work, the features of DS1 have been analysed a priori. These features and their relevance according to the importance score of Random Forests are shown in Table IV.
Two variations of random forest classifiers were employed: An ensemble with SVM by limiting the number of features for training the selection model and a classification of the full set of features for each dataset on plain random forest classifier. On one hand, a reduction of training time in using the ensemble classifier was observed. On the other hand, the random forest-only classifier resulted in a higher accuracy rate. A perfect classification with no false positives or negatives is obtained for DS2. By using random forests before training the SVM model for DS1 a reduction of training time by 5 810 seconds is observed while still obtaining an accuracy of 92,5%. It is shown that the pressure as well as the length of a packet have a high impact on the classification, as listed in Table V.
The next five features are similarly important, followed by two slightly less important features, gain and deadband. The remaining features are less important. The data sets were split into training and testing data in a relation of 80% to 20%. This relation is consistent for normal and malicious events in order to effectively train the classifiers on both classes. Furthermore, the data was pre-processed: A Principal Component Analysis (PCA) was applied in using Random Forests and a zero mean scaling was used for SVMs.
V-B Handling Missing Data
Missing values in DS1 constitute 40% of the entire dataset. The sizeable amount makes it crucial to handle the data efficiently so as to not deteriorate the detection rate of the classifier. Missing data is randomly spread across the features and is not specific to any one feature or the category of attack a packet belongs to, thus classified as Missing Completely At Random (MCAR) [36]. The missing data comes from the characteristic of Modbus packets to not transfer all data values automatically, but only those requested. In order to obtain data at regular time points, this lack of information on several time points is impacting the feature selection. As it is safe to assume that the data does not behave erratically in between polling for the given data, interpolation with time method is used for each feature of the dataset to estimate missing values as this method is efficient and most widely used [37]. The results indicate that interpolating missing values does not downgrade the accuracies of the different training models tested. Since an attack may or may not impact all features at a single point in time, each feature is considered to be an individual event. For instance, considering an MSCI attack, an attack on the pump triggers random changes to the state of the pump, whereas a solenoid attack randomly changes the state of the solenoid [28] The impact of an attack may eventually trickle down to other features in time. However, in this work, only the point in time during which an attack occurs is discussed. In DS2, the dimensionality is lower. From manual inspection of the features, a few correlations are inferred. To get an idea of the trends in all attacked records, manual analysis is performed on the dataset. The following direct correlations between a feature and an attack are drawn:
- •
Attacks have an influence of the following attributes: Water flow, water level in both containers, water pressure and water temperature
- •
Pump status remains constant during an attack: 0 during the first attack and 1 during the second attack
- •
S111 is 0 during the first attack and 1 during the second attack and normal operation
- •
S112 0 during the first attack and during normal operation
- •
S113 is 0 during the first attack
These observations are supported by the feature importance scores derived from random forest classifier. The features as shown in Table V. Water temperature is the most relevant feature with about 25%. The following four features are important as well, while the remaining features are significantly less relevant.
V-C Performance of the Algorithms
Since both the datasets are highly imbalanced with only 21.9% of events being attacks in DS1 and 14.3% in DS2, modifications in support vector machine are employed to appropriately tackle the class imbalance problem. An 80/20 split for training and testing data was chosen for the data sets. For Random Forests, PCA was applied as a pre-processing means while a zero mean scaling was performed for SVMs. For DS1, cost sensitive learning for SVM modeling using SVM-weight is implemented [38]. When the classification model is assigned SVM-weight, it assigns a larger penalty value to False Negatives than to False Positives. The training time for SVM-weight is the same as the training time required for SVM and is of order , where are positive samples and are negative samples. However overweighting the classifier increases the training time. There are other data processing techniques such as under-sampling where only a subset of majority class is used for training along with minority class [39], and oversampling where samples of minority class are replicated. Since oversampling increase the dataset size and under-sampling could result in decrease of meaningful time dependent trends, the cost metric of the classifier using recursive validation with Gridsearch [40], a Python library, was performed in the course of this work. An overview of the performance of SVMs on the data sets is provided in Table VI.
With highly skewed distribution of the data, evaluation of the classifier based only on accuracy is not sufficient. Additional metrics, such as precision, recall and F1-score, are employed to evaluate the classification ability. The confusion matrix of each trained classifier is generated to compare predicted output labels to the existing ground truth. The confusion matrix consists of the following metrics: True Positive (TP), i.e. the number of correct classification of attacks, True Negative (TN) i.e. the number of correct classification of normal instances, FP, i.e. the number of incorrect classification of normal instances as attacks, and FN, i.e. the number of incorrect classifications of attacks as normal instances. In addition to SVMs, Random Forests were employed in order to classify the relevance of features and to detect attacks in the data set. A summary of the evaluation is shown in Table VII.
The columns on the left describe DS1 while the columns on the right describe DS2. For both the datasets, full feature models of Random Forest classifiers worked well with accuracies of 99.7% and 99.9% for DS1 and DS2 respectively. On setting a threshold to filter out least relevant features, the accuracy of both the datasets reduced: To 91% when model was trained with 9 most important features for DS1 and 92% when model was trained with ten most important features from the derived rankings. The first data set, DS1 consists of Modbus-based traffic of a simulated process of a gas pump. Random Forests reach a significantly higher accuracy than SVMs while exhibiting a more linear time behaviour. As they converge quickly, the take less time for the larger data set DS1.
VI Conclusion
In this work, two data sets captured in industrial environments are analysed for attack-based anomalies. SVMs are used to detect attacks of seven different categories and 35 different subtypes. With accuracies and F1-scores of up to 92.5% and 85.2% respectively, this approach is promising. Lots of missing data in this data set do not impact the performance of the algorithms. The second data set, DS2 consists of OPC UA-based traffic derived from a real-world hardware, a Festo Didactic MPS PA Compact Workstation. In this case, one class SVMs are used, as only two instances of attacks are present. This leads to slightly worse accuracy of 90.8%. However, due to an almost perfect recall, the f1-score is performing pretty well with 94.9%. In this work, handling of missing data as well as feature selection are addressed, as real-world data often lacks features for some instances and contains noise and irrelevant information. Random Forests provide means to calculate the significance of individual features. They can also be employed to detect anomalies in the data set, with satisfactory results. Additionally, approaches such as PCA decrease the feature space and provide the most relevant features. As attacks on industrial environments are occurring more frequent and becoming more critical in their effects, effective detection is crucial. Methods of machine learning, such as SVM and Random Forests, are capable of enhancing the detection capabilities of common industrial IDSs. Machine learning-based approaches profit from a limited state set in industry as well as a large amount of training data in a given environment, as industrial environments produce loads of data. The algorithms presented in this work do detect between 90% and 95% of the attacks in the data. This will, in practical application, leave undetected attacks in industrial networks and thus pose security threats. Additional means are required to enhance the level of security [41, 42, 43].
The reference list from the paper itself. Each links out to its DOI / PubMed record.
- 1[1] S. Duque Anton, D. Fraunholz, C. Lipps, F. Pohl, M. Zimmermann, and H. D. Schotten, “Two decades of SCADA exploitation: A brief history,” in 2017 IEEE Conference on Application, Information and Network Security (AINS) , November 2017, pp. 98–104.
- 2[2] V. M. Igure, S. A. Laughter, and R. D. Williams, “Security issues in SCADA networks,” Computers & Security , no. 25, pp. 498–506, 2006.
- 3[3] I. D. Stef, G. Draghici, and A. Draghici, “Product design process model in the digital factory context,” Procedia Technology , vol. 9, pp. 451 – 462, 2013.
- 4[4] Modbus, “Modbus application protocol specification v 1.1b 3,” 2012. [Online]. Available: http://www.modbus.org/docs/Modbus_Application_Protocol_V 1_1b 3.pdf
- 5[5] Modbus-IDA, “Modbus messaging on tcp/ip implementation guide v 1.0b,” 2006. [Online]. Available: http://www.modbus.org/docs/Modbus_Messaging_Implementation_Guide_V 1_0b.pdf
- 6[6] PROFIBUS, “Profinet specification,” 2017. [Online]. Available: http://www.profibus.com/nc/download/specifications-standards/downloads/profinet-io-specification/display/
- 7[7] A. Cherepanov, “Win 32/Industroyer - a new threat for industrial control systems,” ESET, Tech. Rep., June 2017.
- 8[8] Dragos, “Chrashoverride - analysis of the threat to electric grid operations,” Dragos Inc., Tech. Rep. 2.20170613, 2016.