Hypothesis Testing in Nonlinear Function on Scalar Regression with Application to Child Growth Study
Mityl Biswas, Arnab Maity

TL;DR
This paper introduces a kernel machine-based hypothesis testing method for nonlinear function-on-scalar regression, applied to child growth data to assess the impact of toxic metals and methylation regions.
Contribution
It develops a novel variance component test within a kernel machine framework for nonlinear function-on-scalar regression models.
Findings
Method effectively detects associations in simulation studies.
Application to NEST data reveals significant links between exposures and child growth.
Provides a flexible approach for nonlinear functional data analysis.
Abstract
We propose a kernel machine based hypothesis testing procedure in nonlinear function-on-scalar regression model. Our research is motivated by the Newborn Epigenetic Study (NEST) where the question of interest is whether a pre-specified group of toxic metals or methylation at any of 9 differentially methylated regions (DMRs) is associated with child growth. We take the child growth trajectory as the functional response, and model the toxic metal measurements jointly using a nonlinear function. We use a kernel machine approach to model the unknown function and transform the hypothesis of no effect to an appropriate variance component test. We demonstrate our proposed methodology using a simulation study and by applying it to analyze the NEST data.
Click any figure to enlarge with its caption.
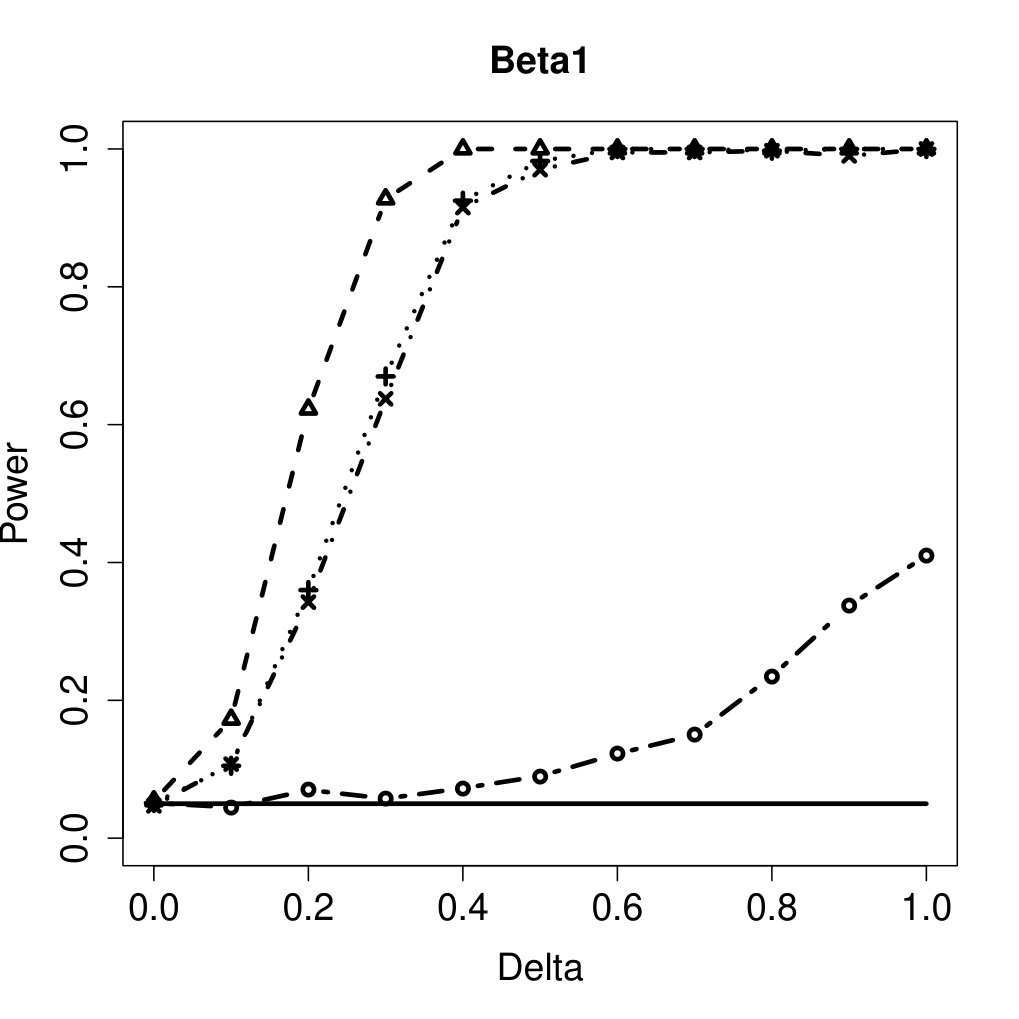 Figure 1
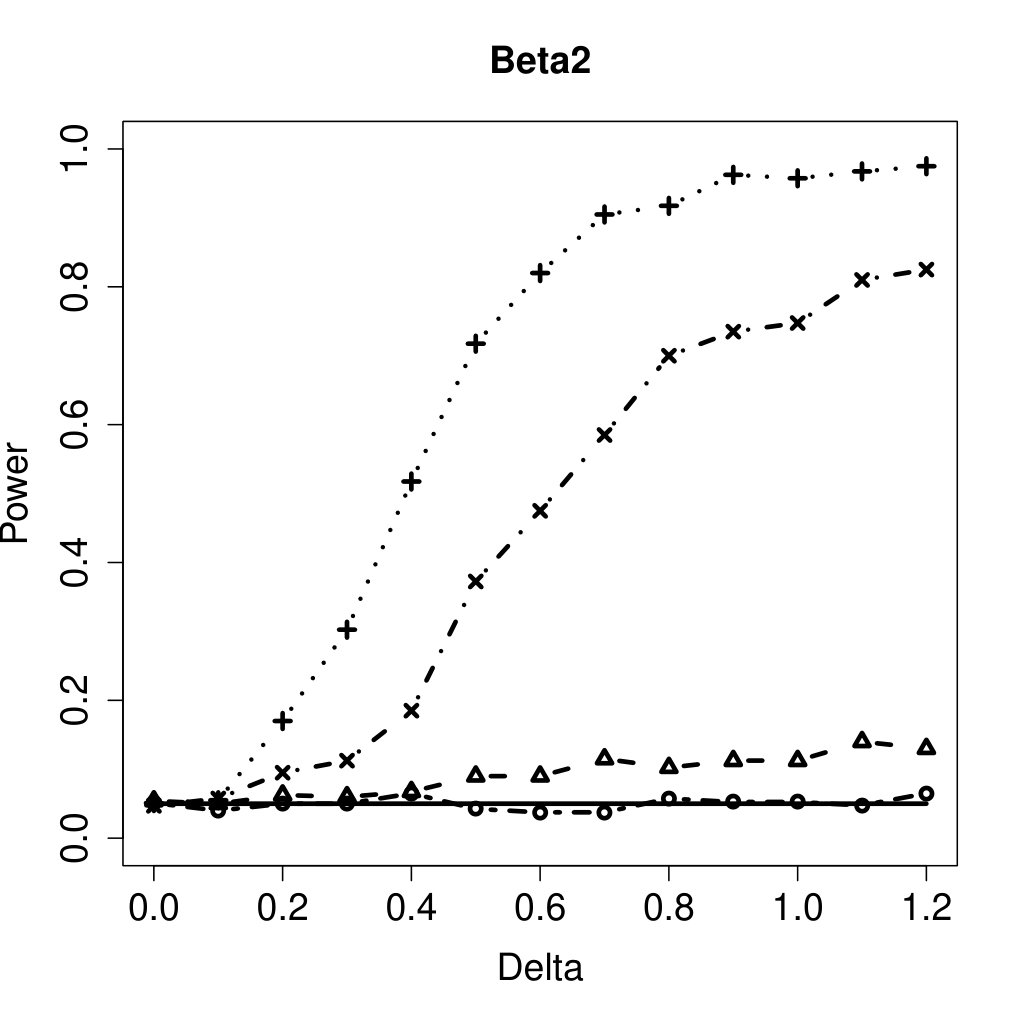 Figure 2
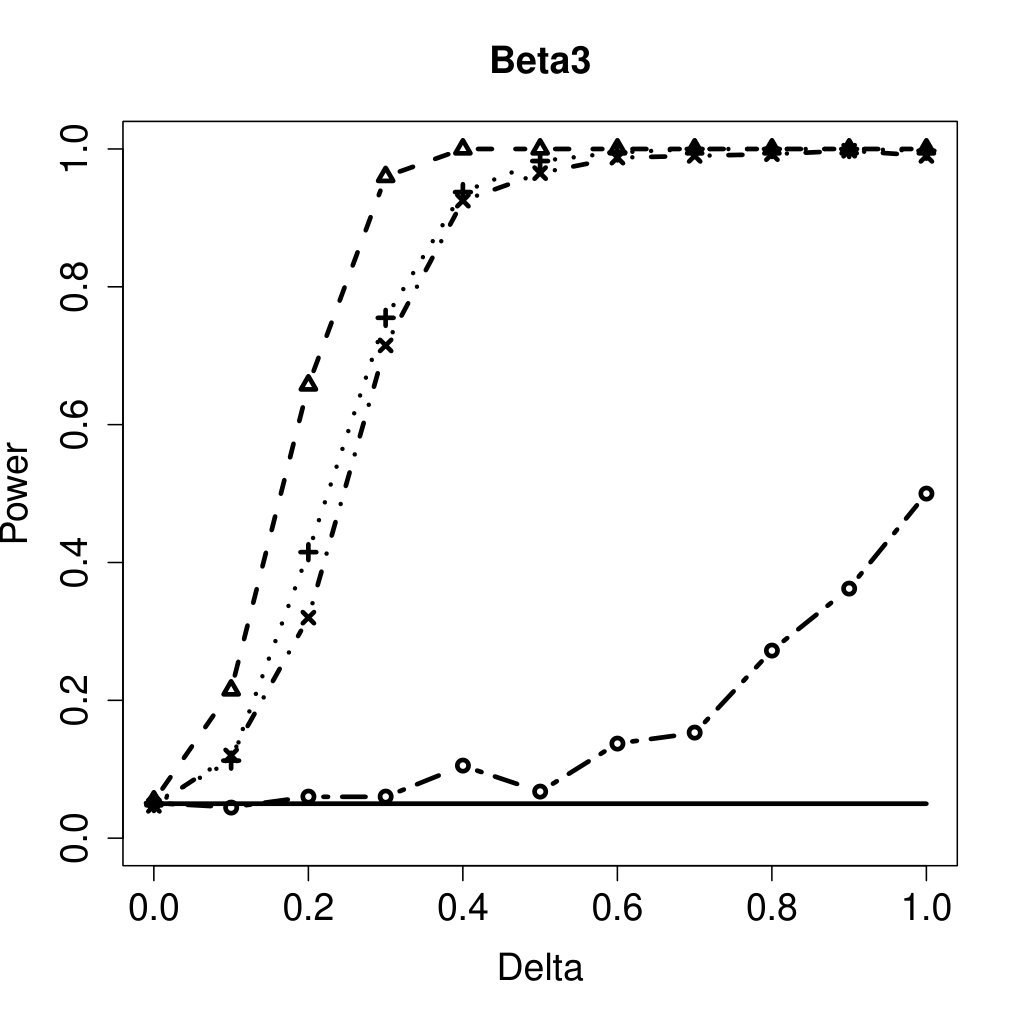 Figure 3
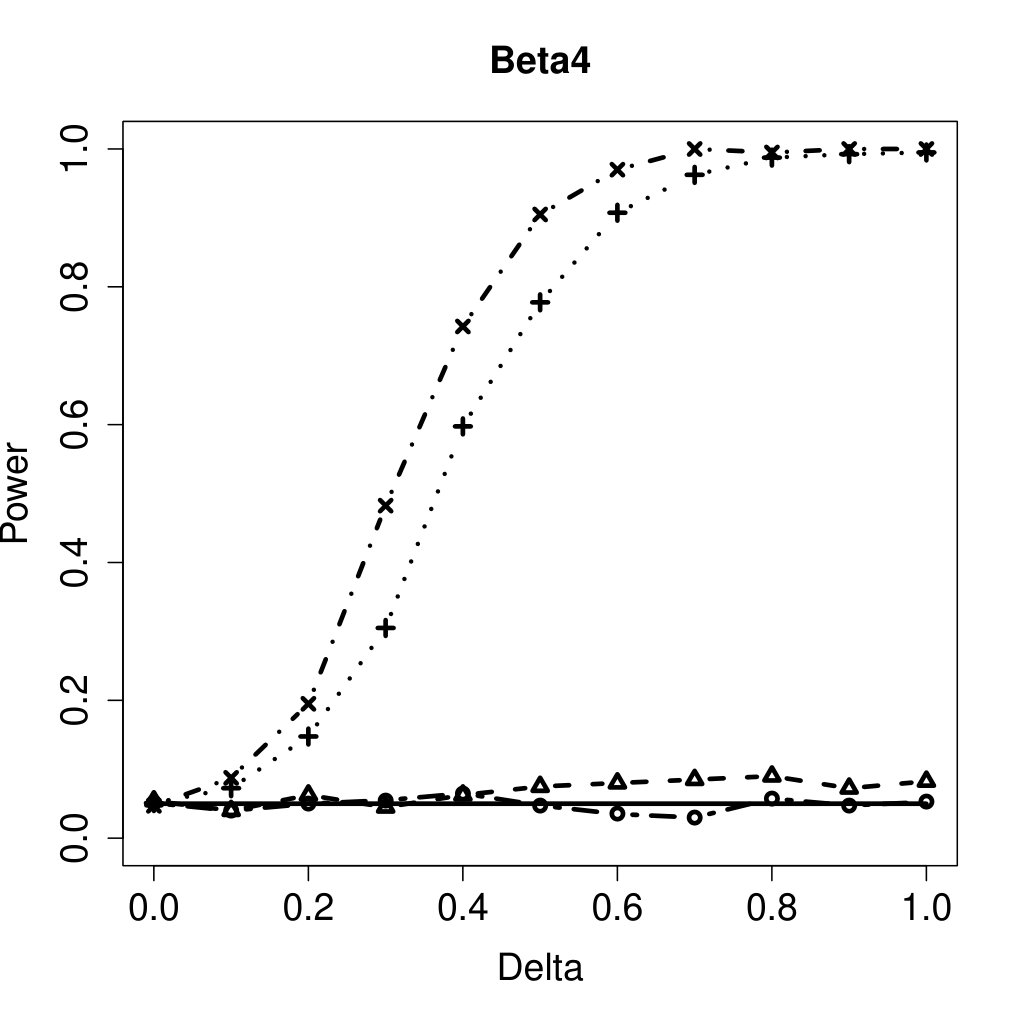 Figure 4
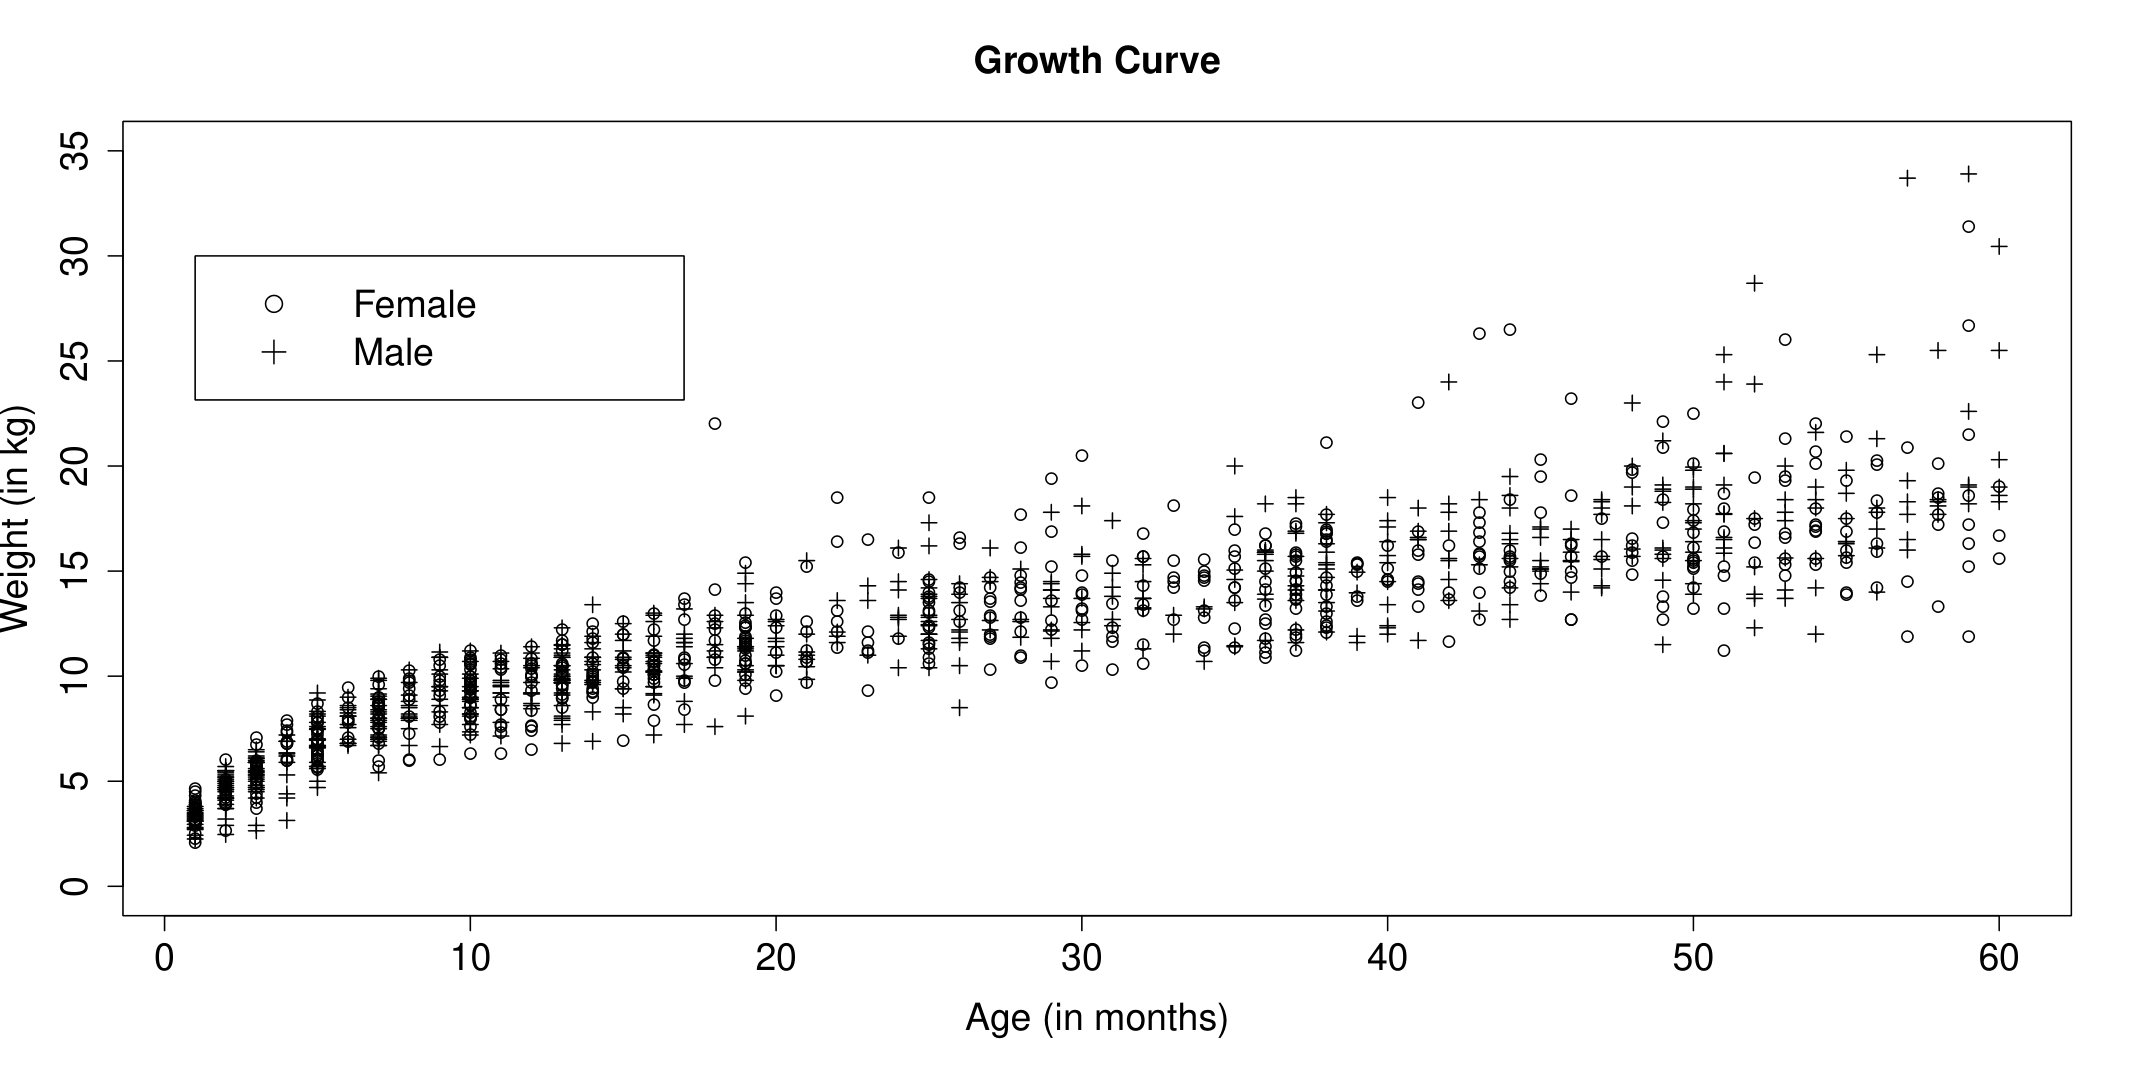 Figure 5
 Figure 6
 Figure 7
 Figure 8
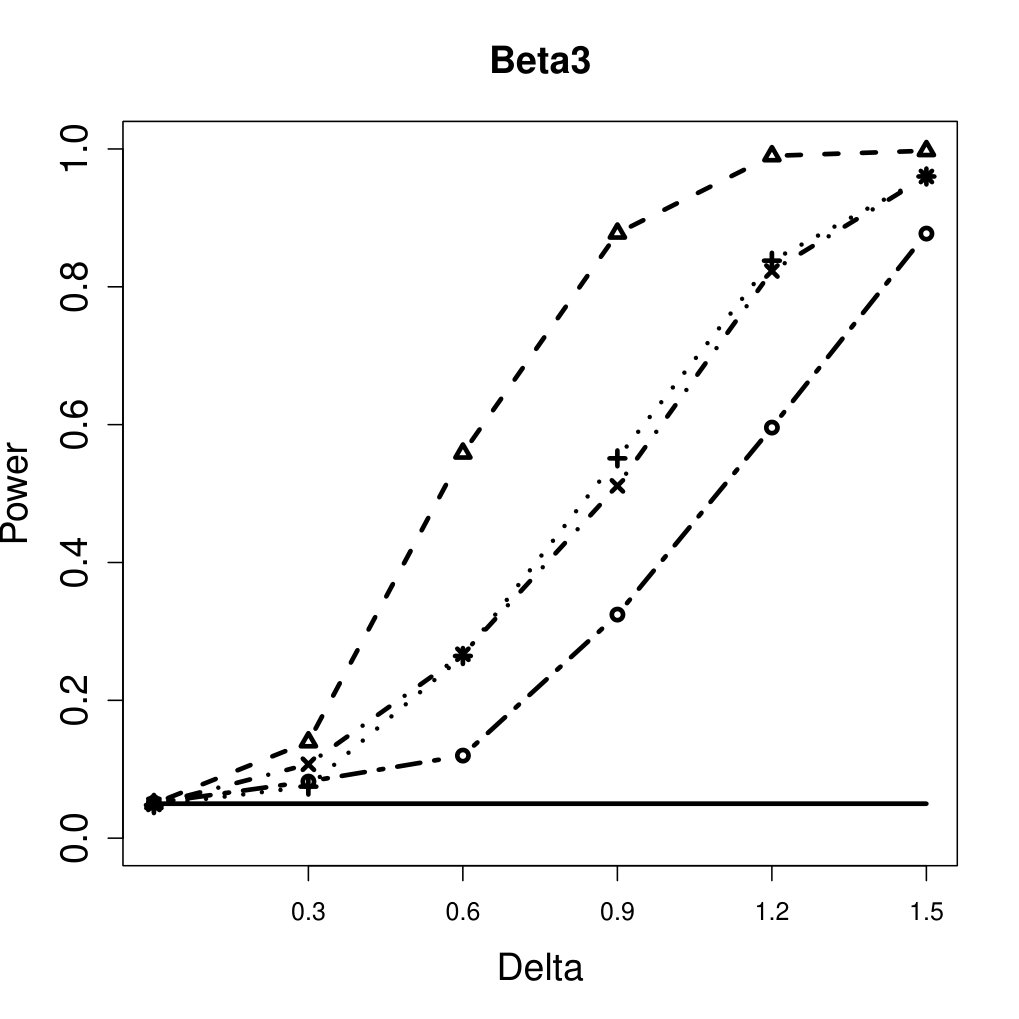 Figure 9
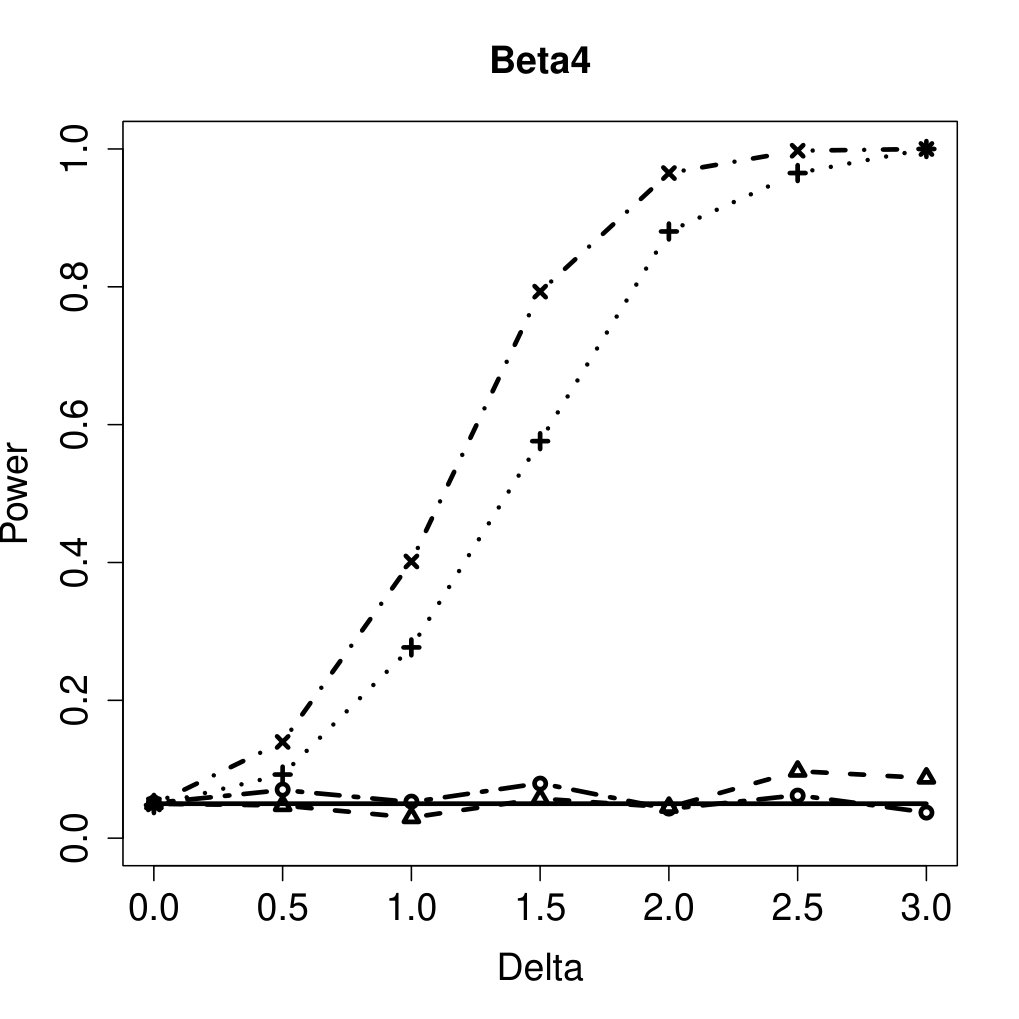 Figure 10
| All | Female | Male | |
|---|---|---|---|
| Number of children | 75 | 38 | 37 |
| Explained by first principal component function | 95.4 % | 98.1 % | 99.9 % |
| Explained by second principal component function | 3.2 % | 1.9 % | 0.1 % |
| All Metals | Toxic Metals | Other Metals | |
|---|---|---|---|
| Females | 0.0163 | 0.2019 | 0.0174 |
| Males | 0.0282 | 0.2882 | 0.0303 |
| All | Female | Male | |
|---|---|---|---|
| Number of children | 75 | 38 | 37 |
| Cadmium | 0.4472 | 0.3489 | 0.4136 |
| Lead | 0.7191 | 0.4567 | 0.1715 |
| Arsenic | 0.7102 | 0.6798 | 0.3210 |
| Iron | 0.4734 | 0.0998 | 0.8637 |
| Zinc | 0.2612 | 0.6560 | 0.7337 |
| Selenium | 0.8298 | 0.0694 | 0.7281 |
| Copper | 0.9028 | 0.7353 | 0.0164 |
| Calcium | 0.2104 | 0.1559 | 0.3459 |
| Strontium | 0.6351 | 0.0676 | 0.7209 |
| Barium | 0.6884 | 0.9244 | 0.9779 |
| Manganese | 0.4178 | 0.8938 | 0.1069 |
| Cobalt | 0.5255 | 0.0657 | 0.9518 |
| Molybdenum | 0.9491 | 0.3438 | 0.9059 |
| Scandium | 0.6514 | 0.3574 | 0.6255 |
| Titanium | 0.4075 | 0.2335 | 0.5048 |
| Chromium | 0.2799 | 0.5231 | 0.5076 |
| Aluminium | 0.9435 | 0.8885 | 0.3141 |
| Silicon | 0.3530 | 0.0963 | 0.6416 |
| Vanadium | 0.4860 | 0.1063 | 0.1957 |
| Rubidium | 0.4089 | 0.8445 | 0.2812 |
| Tin | 0.4601 | 0.0135 | 0.2599 |
| Mercury | 0.4742 | 0.4186 | 0.4358 |
| Nickel | 0.5029 | 0.1059 | 0.3895 |
| Magnesium | 0.7958 | 0.2419 | 0.3440 |
Peer Reviews
No public reviews on file for this paper yet. If you reviewed it on a platform where reviews are public (OpenReview, ICLR, NeurIPS, ICML), you can paste yours below so the community can read it here.
Videos
No videos yet. Explain this paper in a talk, walkthrough, or lecture? Add one.
Taxonomy
TopicsBirth, Development, and Health · Health, Environment, Cognitive Aging · Statistical Methods and Inference
**Supplementary Materials for
Hypothesis Testing in
Nonlinear Function on Scalar Regression with Application to Child Growth Study**
Mityl Biswas, Arnab Maity
Department of Statistics, North Carolina State University
1 as a Kronecker product.
We have utilized the following property in order to make our code more computationally efficient while performing the simulation study.
Let’s consider the element of the block for some , ,
, , . This is clearly a separable function in , and . Then, we can see that the block is , where is the matrix with the element as for . Now, if we had , with for , then, the block would have been , where is the matrix with the element as for . This results in the following corresponding kernel matrix: , where is the matrix with the element as . Now, if we only consider those rows and columns of that correspond to the observed data, we would have the required kernel matrix .
2 Additional Tables and Figures
The first principal component function explained a large percentage of the underlying variance-covariance structure for either gender considered in testing the association of growth curve with metal content. This is evident in table 1. The first eigen vector for male children, and for female children was similar to that when all the children were considered together. This is illustrated in figure 1.
Table 1 here.
Figure 1 here.
The p-values obtained by performing the tests separately for the male and the female children show that they are similar for the two genders, although the values are slightly lower for the females. The statistics are listed in table 2.
Table 2 here.
The p-values obtained by performing the tests separately for each of the metals have been recorded in table 3. We obtained these numbers solely for the purpose of getting a vague idea of what the p-values would look like, and shall not be using them to draw conclusions as we have reused the dataset that we had used for our initial analyses.
Table 3 here.