The Cosmic Expansion History from Line-Intensity Mapping
Jos\'e Luis Bernal, Patrick C. Breysse, Ely D. Kovetz

TL;DR
Line-intensity mapping offers a promising method to measure the Universe's expansion history across different epochs, potentially resolving current tensions in cosmological measurements and testing fundamental physics.
Contribution
The paper introduces a new methodology for extracting cosmological information from LIM that reduces degeneracy with astrophysics, enabling precise measurements of the BAO scale at high redshifts.
Findings
Forecasts show percent-level constraints on the expansion rate history.
LIM can serve as a cosmic ruler extending to the epoch of reionization.
Potential to address the Hubble tension and test dark energy models.
Abstract
Line-intensity mapping (LIM) of emission from star-forming galaxies can be used to measure the baryon acoustic oscillation (BAO) scale as far back as the epoch of reionization. This provides a standard cosmic ruler to constrain the expansion rate of the Universe at redshifts which cannot be directly probed otherwise. In light of growing tension between measurements of the current expansion rate using the local distance ladder and those inferred from the cosmic microwave background, extending the constraints on the expansion history to bridge between the late and early Universe is of paramount importance. Using a newly derived methodology to robustly extract cosmological information from LIM, which minimizes the inherent degeneracy with unknown astrophysics, we show that present and future experiments can gradually improve the measurement precision of the expansion rate history,…
Click any figure to enlarge with its caption.
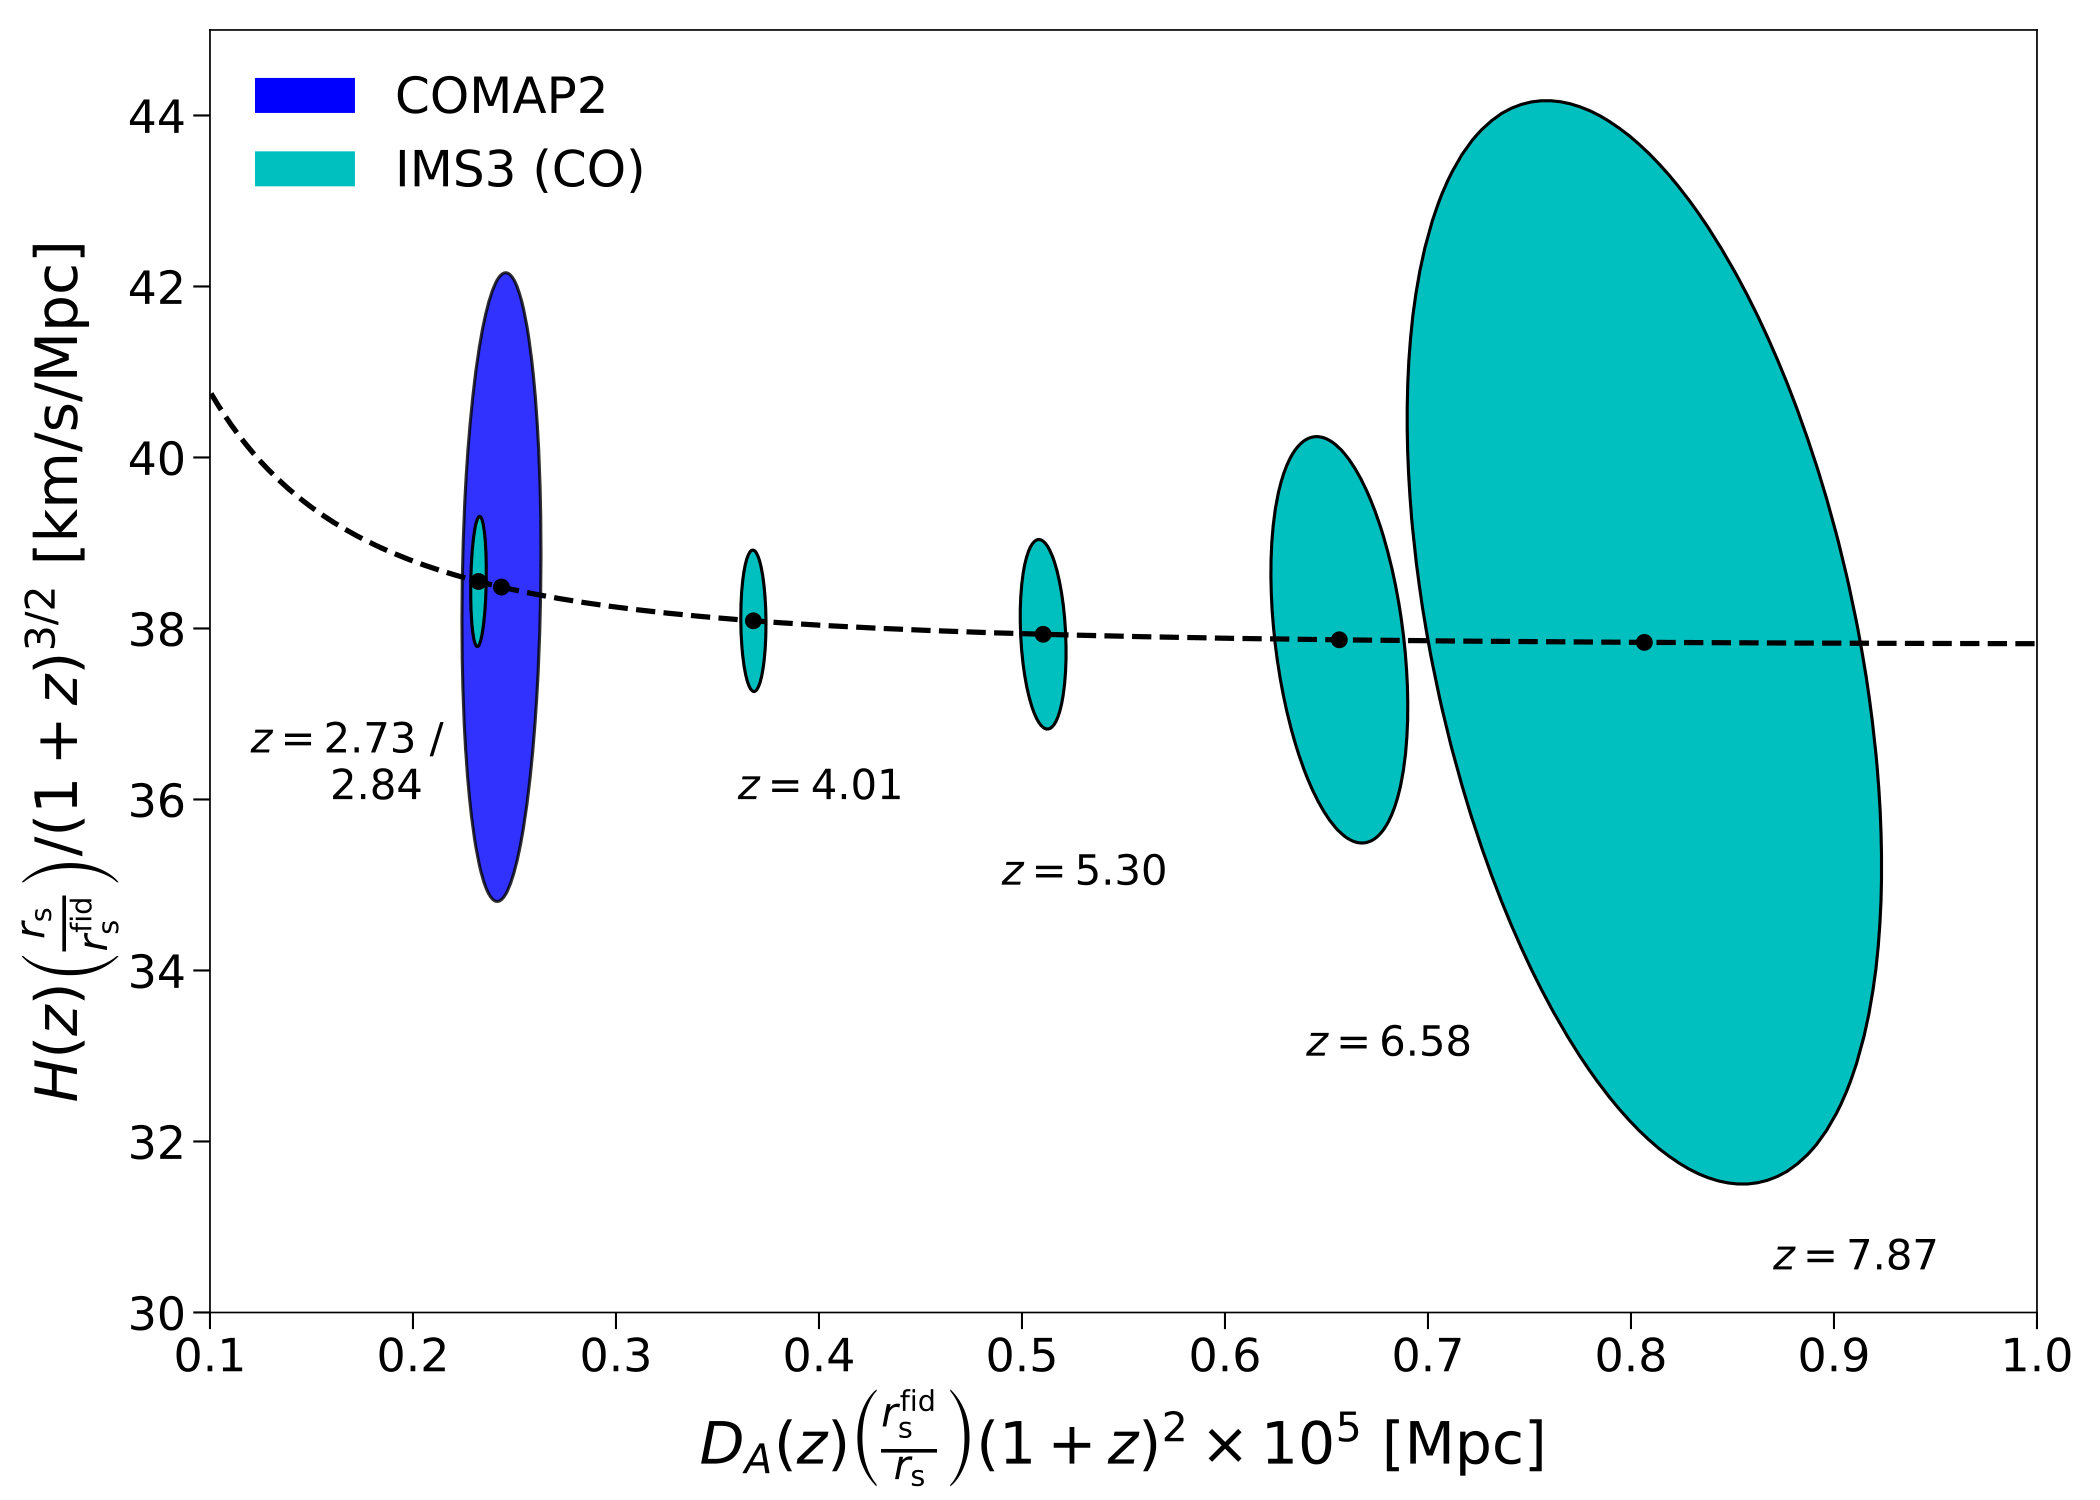 Figure 1
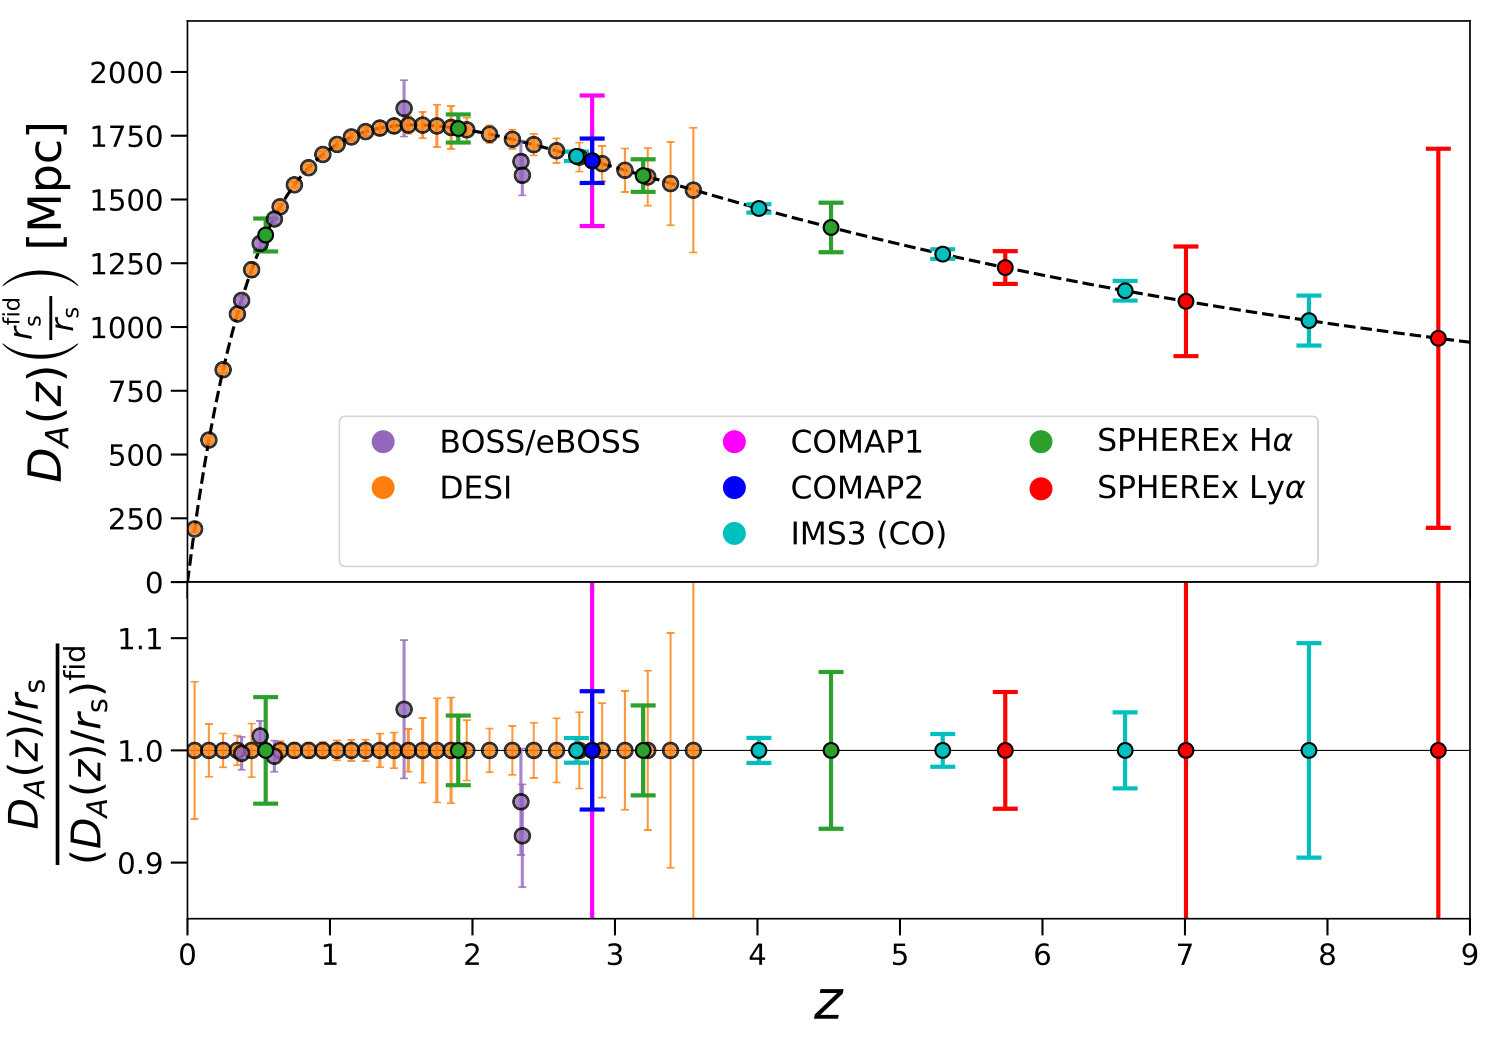 Figure 2
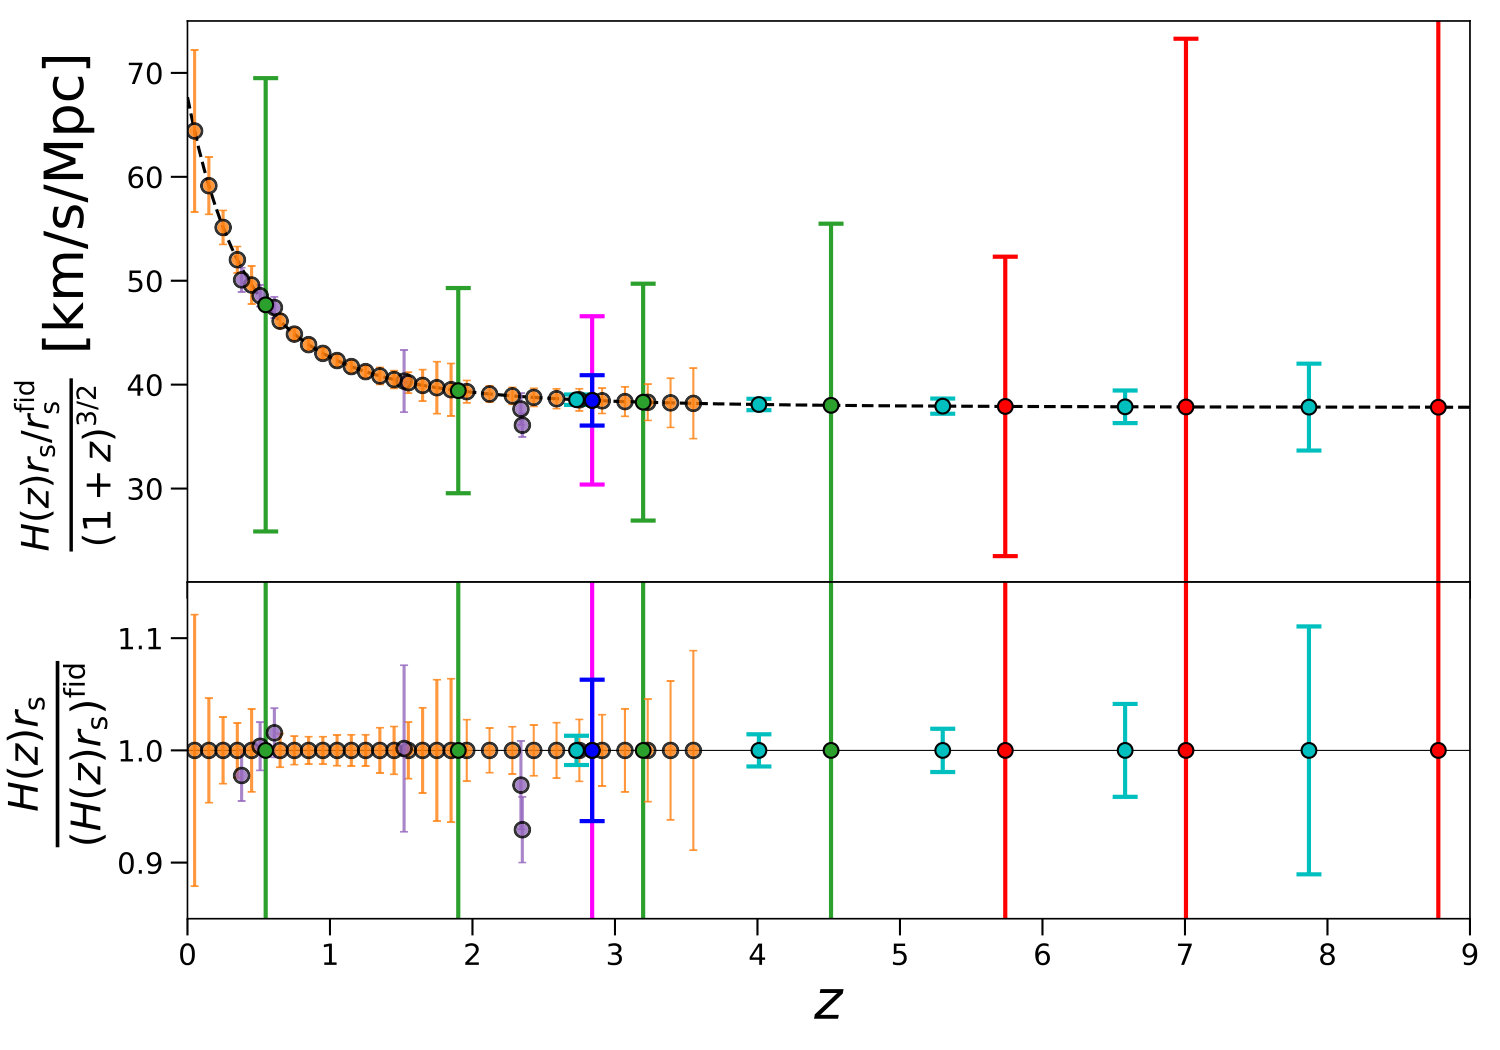 Figure 3
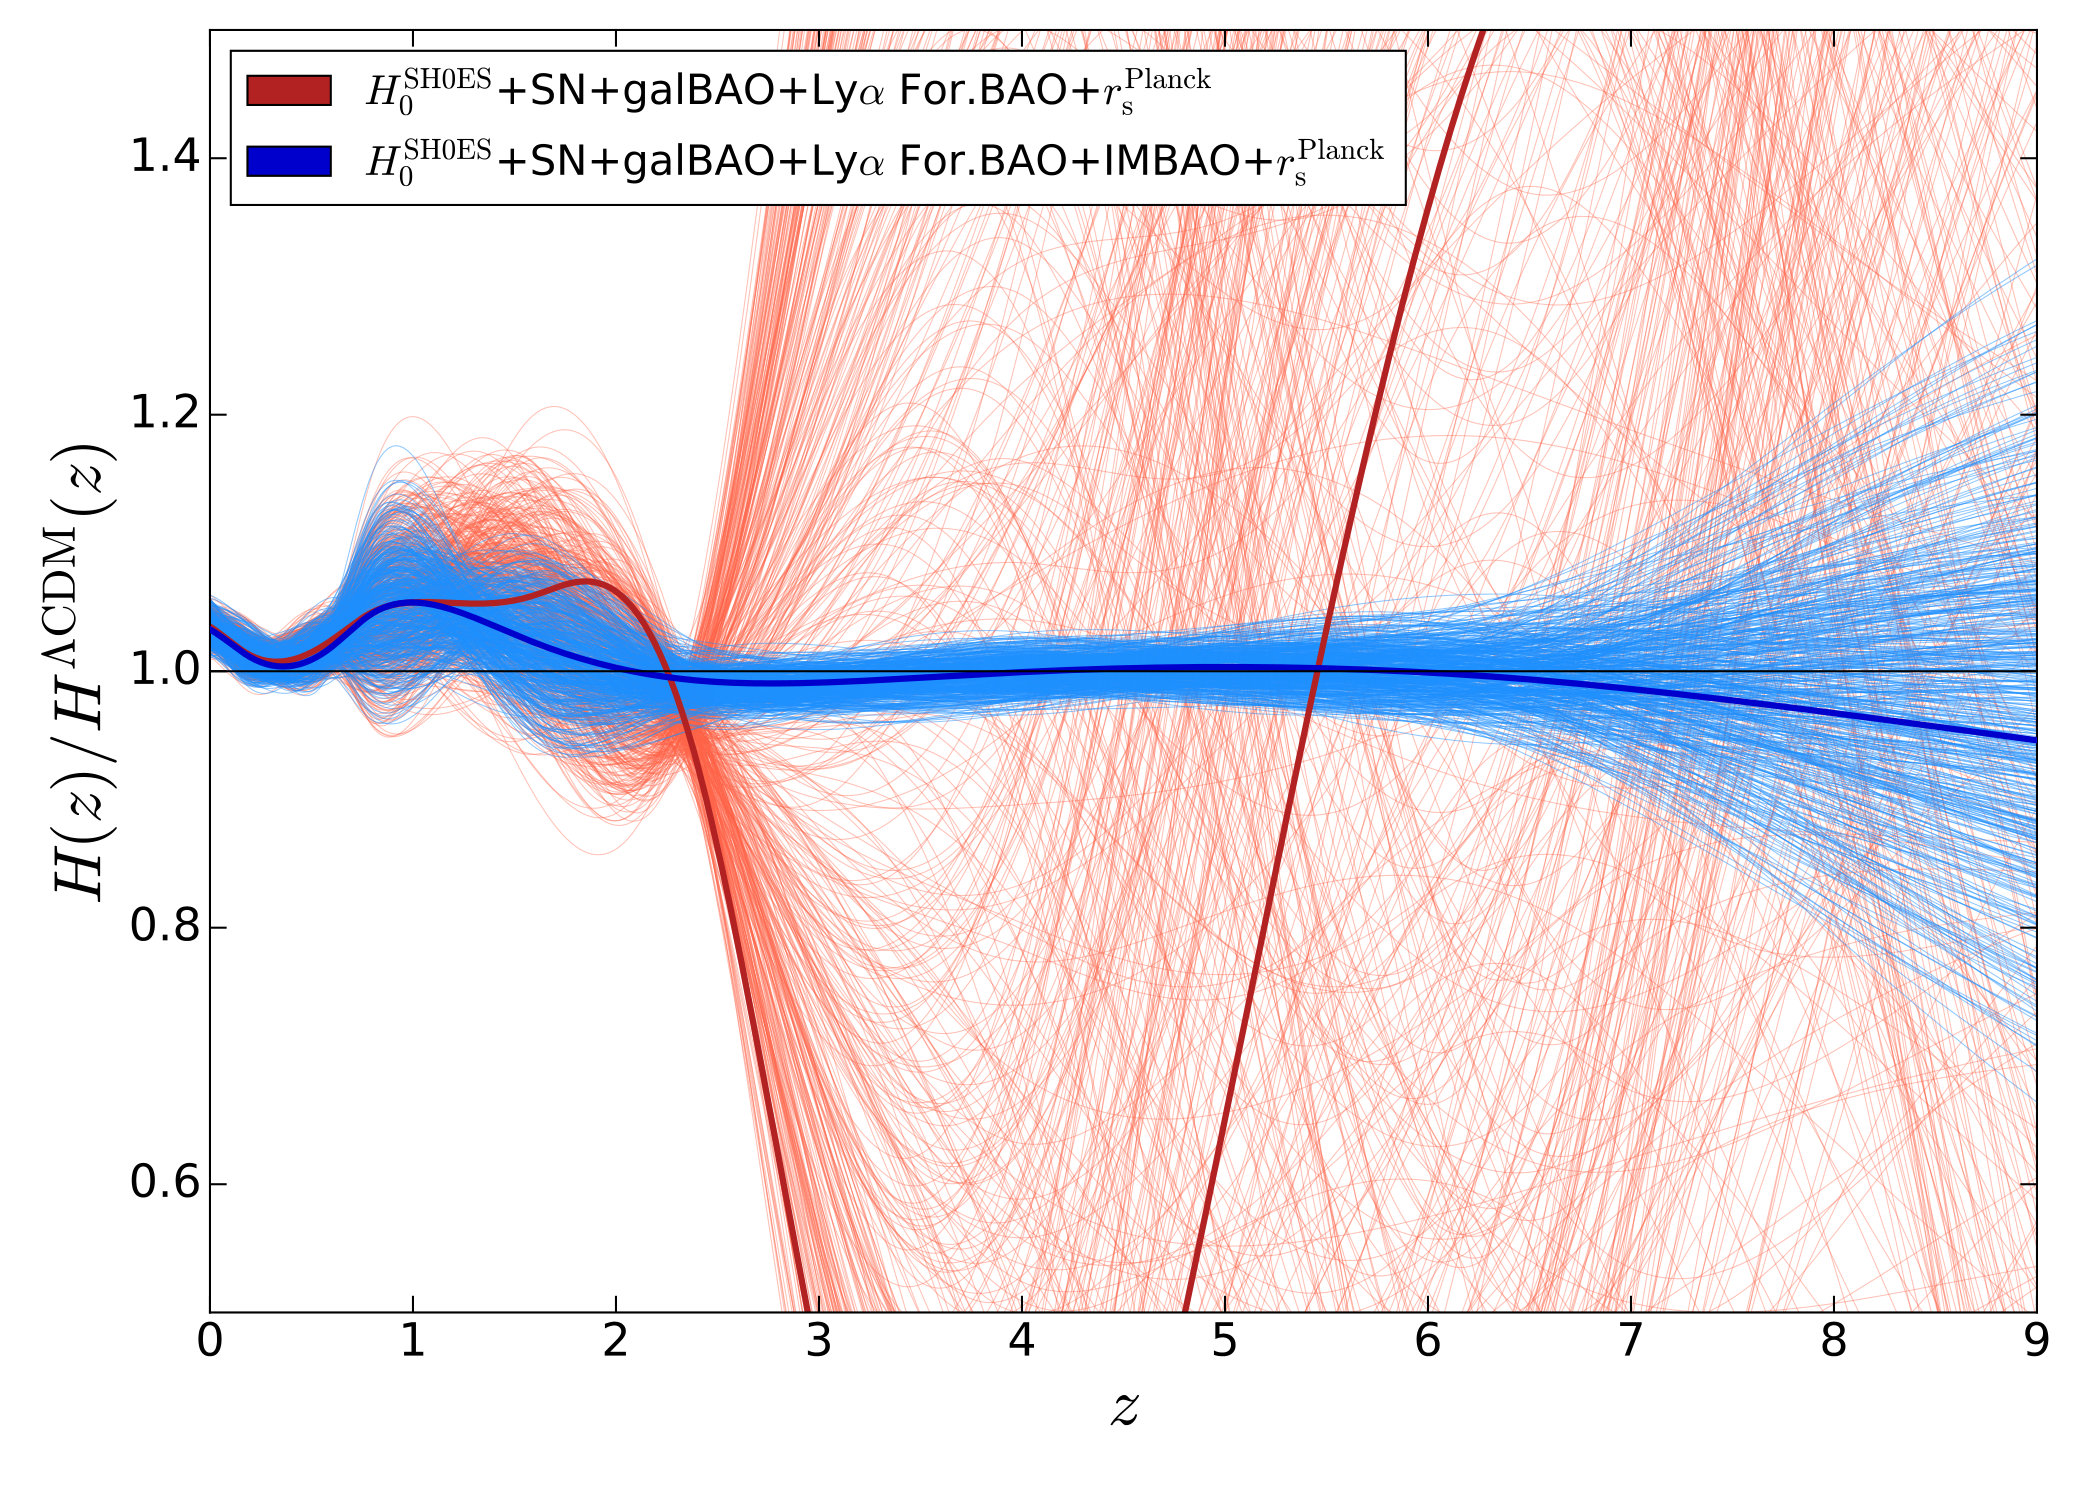 Figure 4
| Instrumental Paramater | COMAP 1 | COMAP 2 | IMS3 (CO) |
|---|---|---|---|
| [K] | 40 | 40 | max(20,) |
| Total # of independent detectors | 19 | 95 | 1000 |
| Ang. resolution (FWHM) [arcmin] | 4 | 4 | 4 |
| Frequency band [GHz] | 26-34 | 26-34 | 12-36 |
| [MHz] | 15.6 | 8.0 | 2.0 |
| [h] | 6000 | 10000 | 10000 |
| [deg2] | 2.25 | 60 | 1000 |
| SPHx (H) | SPHx (Ly) | COMAP1 | COMAP2 | IMS3 (CO) | ||||||||||
|---|---|---|---|---|---|---|---|---|---|---|---|---|---|---|
| 0.55 | 1.90 | 3.20 | 4.52 | 5.74 | 7.01 | 8.78 | 2.84 | 2.84 | 2.73 | 4.01 | 5.30 | 6.58 | 7.87 | |
| 4.7 | 3.1 | 4.0 | 7.0 | 5.2 | 19.5 | 77.7 | 15.4 | 5.2 | 1.1 | 1.1 | 1.5 | 3.4 | 9.5 | |
| 45.7 | 25.0 | 29.7 | 46.0 | 38.0 | 93.6 | - | 21.0 | 6.3 | 1.3 | 1.4 | 1.9 | 4.1 | 11.0 | |
Peer Reviews
No public reviews on file for this paper yet. If you reviewed it on a platform where reviews are public (OpenReview, ICLR, NeurIPS, ICML), you can paste yours below so the community can read it here.
Videos
No videos yet. Explain this paper in a talk, walkthrough, or lecture? Add one.
The Cosmic Expansion History from Line-Intensity Mapping
José Luis Bernal
ICC, University of Barcelona, IEEC-UB, Martí i Franquès 1, E08028 Barcelona, Spain
Dept. de Física Quàntica i Astrofísica, Universitat de Barcelona, Martí i Franquès 1, E08028 Barcelona, Spain
Institut d’Estudis Espacials de Catalunya (IEEC), E08034 Barcelona, Spain
Patrick C. Breysse
Canadian Institute for Theoretical Astrophysics, University of Toronto, 60 St. George Street, Toronto, ON, M5S 3H8, Canada
Ely D. Kovetz
Department of Physics, Ben-Gurion University, Be’er Sheva 84105, Israel
Abstract
Line-intensity mapping (LIM) of emission form star-forming galaxies can be used to measure the baryon acoustic oscillation (BAO) scale as far back as the epoch of reionization. This provides a standard cosmic ruler to constrain the expansion rate of the Universe at redshifts which cannot be directly probed otherwise. In light of growing tension between measurements of the current expansion rate using the local distance ladder and those inferred from the cosmic microwave background, extending the constraints on the expansion history to bridge between the late and early Universe is of paramount importance. Using a newly derived methodology to robustly extract cosmological information from LIM, which minimizes the inherent degeneracy with unknown astrophysics, we show that present and future experiments can gradually improve the measurement precision of the expansion rate history, ultimately reaching percent-level constraints on the BAO scale. Specifically, we provide detailed forecasts for the SPHEREx satellite, which will target the H and Lyman- lines, and for the ground-based COMAP instrument—as well as a future stage-3 experiment—that will target the CO rotational lines. Besides weighing in on the so-called Hubble tension, reliable LIM cosmic rulers can enable wide-ranging tests of dark matter, dark energy and modified gravity.
Measurements of its expansion history have always been at the heart of our understanding of the Universe. This dates back to Hubble’s ninety-year-old discovery of the expansion 1929PNAS…15..168H , which marked the dawn of scientific cosmology, to the discovery just twenty years ago that the expansion is currently accelerating Riess_DE98 ; Perlmutter_DE99 , which provided the last piece in what is now widely considered to be the standard model of cosmology, known as CDM.
To this date, there are two main observational handles on the expansion rate of the Univers. One relies on calibrating a distance ladder towards standard-candle type-Ia supernovae in our local cosmic neighborhood. The other comes from the distant early Universe, via the extraction of the baryon acoustic oscillation (BAO) scale, which is robustly determined by the sound horizon at recombination, from cosmic microwave background (CMB) measurements. These opposite handles anchor the so-called direct and inverse distance ladder, respectively Cuesta:2014asa .
One of the most pressing mysteries in cosmology today is why these measurements have been growing in tension Freedman:2017yms . The tension between the value of as directly measured in the local Universe (RiessH0_19, ) and the value inferred from Planck CMB measurements (Planck18_pars, ) (when CDM is assumed), has surpassed in statistical significance RiessH0_19 ; Wong:2019kwg . If real, the discrepancy can be re-framed as a mismatch between the two anchors of the cosmic distance ladder BernalH0 . Low redshift observations Alam_bossdr12 ; Scolnic_pantheon strongly constrain the expansion rate of the Universe under the CDM prediction. The difference could be due to modifications in the very early Universe or in the epoch , which is too faint to probe with discrete galaxy surveys.
In this Letter, we explore how upcoming and future line-intensity mapping (LIM) Kovetz_IMstatus experiments can bridge the gap between the local and distant observations to enable the measurement of the full expansion history of the Universe Karkare:2018sar . LIM experiments can achieve this feat as they integrate light from all emitting sources, including the numerous galaxies at high redshift which are too faint to be detected individually. Thus, by targeting bright, easily-identifiable spectral lines and covering a wide range of frequencies with high spectral resolution, LIM can provide tomographic maps of specific line emission across extended epochs in the history of the Universe.
However, a key challenge to the extraction of precise cosmological information from line-intensity maps is the degeneracy with astrophysics, as this line emission is determined by star-formation processes and by both intra and intergalactic gas physics. Unfortunately, these processes are likely never to be understood with the required precision for cosmological analyses. To circumvent this predicament, we will follow a novel methodology—presented in detail in a companion paper Bernal_IM — to isolate the cosmological information and optimize its extraction. Encouragingly, we find that next-decade experiments can reach constraints on the expansion history over redshifts , and within - error at , providing (robust) invaluable insight on the Hubble tension.
We start by reviewing how the BAO scale can be constrained via measurements of the LIM power spectrum. When transforming redshifts and sky positions into distances to compute a power spectrum, a fiducial cosmology must be assumed. However, the inferred distances will be distorted if the adopted cosmology does not match the correct one Alcock_Paczynski . This effect—named after Alcock and Paczynski—is the key to interpreting the measured BAO scale in a cosmological framework as a standard ruler.
In Fourier space, the relation between the true and measured wavenumbers along the line of sight and in the transverse directions is given by and , where the rescaling parameters are defined as:
[TABLE]
where and are the angular diameter distance and the Hubble expansion rate at redshift , respectively, is the sound horizon at radiation drag, and fiducial quantities are denoted by ‘fid’. Measurements of the BAO feature can be compared against the fiducial expectation, providing a direct constraint on and . An external prior on can then be applied to infer absolute measurements of the expansion history.
Line-intensity fluctuations provide a biased tracer of the underlying density field (which contains the cosmological information), but are also strongly linked to astrophysical processes. To efficiently separate between the astrophysical and cosmological dependences in the LIM power spectrum, it is useful to group all the degenerate parameters (see Ref. Bernal_IM for details) and express it as:
[TABLE]
where is the cosine of the angle between the mode vector and . The power spectrum depends on , the expected value of the brightness temperature, the luminosity bias , the growth factor , and the amplitude and shape of the matter power spectrum. is the shot-noise power spectrum, and accounts for redshift-space distortions on small scales. Note that we drop the -dependence from all quantities to simplify notation. From Eq. (2), the set of parameter combinations that can be directly measured from the LIM power spectrum at each independent redshift bin and observed patch of sky is .
The multipoles of the observed power spectrum are Bernal_IM
[TABLE]
where is the Legendre polynomial of degree and the observed power spectrum is determined by the observational window function, using .
In this work we focus on spectral lines related to star formation, which are brighter than HI with respect to the corresponding foregrounds, and hence may be more promising to provide higher signal-to-noise measurements of the large-scale structure as far back as the epoch of reionization. In order to model the line intensities, we associate a star-formation rate to a halo of a given mass, and compute the expected luminosity density and other astrophysical quantities using the halo mass function. We consider Lyman-, H and CO(1-0), and follow the models and prescriptions of Refs. Silva_Lyalpha , Gong_lines and Li_CO_16 , respectively. The standard approach in these models is to use a set of scaling relations (calibrated from simulations and/or dedicated observations) to associate a star-formation rate to a halo of a given mass, and then relate it to the line luminosity. This can then be integrated over the halo mass function to get an expected signal Lidz:2011dx ; Breysse:2014uia ; Breysse2019 . In our analysis below we adopt the fiducial parameter values presented in these works, naively interpolating (or extrapolating) them to other redshifts, as needed. Naturally, herein lies the largest uncertainty in our forecasts. However, we emphasize that our use of Eqs. (2),(3) ensures that the influence of the astrophysical uncertainties is minimal. While in a pessimistic scenario the amplitude of the signal may be lower than we forecast, the marginalization over the astrophysical parameters renders the analysis less susceptible to differences in the shape of the biases or luminosity functions.
To estimate the potential of LIM BAO measurements, we forecast measurements of the following planned and future experiments targeting the spectral lines above:
1. SPHEREx (spherex, ): In addition to performing a wide galaxy survey, SPHEREx will carry out LIM surveys. Launching in 2023, this satellite’s IM missions will target Lyman- and H emission, as well as H and the oxygen lines OII and OIII (albeit with lower significance, making them less suitable for cosmological analyses). Specifically, we consider the SPHEREx deep survey, which will cover of the sky with higher sensitivity than the all-sky survey. SPHEREx will have angular resolution at full-width half maximum, and spectral resolution at m and at m (where is the width of the frequency channel, and and are the observed frequency and wavelength, respectively) spherex . We restrict ourselves to m, as that is the H wavelength range modelled in Ref. Gong_lines . We assume a sensitivity111Olivier Doré, private communication. such that the product nW/m2/sr/pixel for H at GHz; and nW/m2/sr/pixel for Lyman- at GHz.
2. COMAP (Cleary_COMAP, ): Already observing, COMAP is a single-dish, ground-based telescope targeting the CO lines in the frequency band - GHz. The instrument houses 19 single-polarization detectors with an angular resolution of and channel width of . The expected system temperature is . The first phase, COMAP1, will observe for hours with one telescope, while the second phase, COMAP2 will observe for using four additional telescopes, all with an improved spectral resolution of . We assume a sky coverage of deg2 for COMAP2, which optimizes the significance of the power spectrum measurement.
3. IMS3 (CO): Finally, we envision a next generation (or stage 3) of LIM experiments—IMS3, in short. We conceive of a ground-based CO experiment as an upgrade of COMAP, and assume it will integrate over the frequency range - for 10000 hours. Based on Refs. Prestage_GBT ; Murphy_nextVLA , we assume . We compare the experimental specifications of both COMAP phases and the IMS3 CO experiment in Table 1.
To track the evolution of the signal, we divide the observed volumes into redshift bins (except for the case of COMAP). We consider in each case non-overlapping, independent redshift bins such as (where is the rest frame frequency), with the corresponding effective redshift located in the center of the frequency bin. This results in four bins for the SPHEREx H observations (with effective redshifts ) and three bins for the Lyman- line (); a single redshift bin for COMAP at , and five redshift bins for the IMS3 CO experiment ().
Following Ref. Bernal_IM , we apply the Fisher matrix formalism (Fisher:1935, ; Tegmark_fisher97, ) to forecast constraints on the BAO measurements using the LIM power spectrum multipoles up to the hexadecapole. We take the fiducial values for the CDM model parameters from the best fit to the combination of the full CMB Planck dataset and BAO from SDSS galaxies Planck18_pars ; Alam_bossdr12 . Finally, we use the halo mass function and halo bias fitting function introduced in Ref. Tinker_hmf2010 .
In table 2, we report forecasted marginalized 68% confidence-level relative constraints on and from the surveys considered. In Fig. 1, we compare them with existing Alam_bossdr12 ; GilMarin_qsoeBOSS ; eBOSS_Lyalpha_auto ; eBOSS_Lyalpha_cross and prospective desi measurements from galaxy surveys. Due to its poor spectral resolution, SPHEREx constraints on are expected to be very weak. However, SPHEREx will provide constraints on of precision almost up to . This is not the case for COMAP, whose power to constrain and is more balanced. While COMAP1 will be less precise, both COMAP2, with a precision of , and SPHEREx (only in the transverse direction) will be competitive with existing measurements, and not fall much behind of DESI desi .
Meanwhile, a future IMS3 (CO) experiment would yield percent-level precision at , degrading to at , and at . The next generation of LIM experiments will thus allow a precise determination of the expansion rate of the Universe up to the epoch of reionization. The first redshift bin would overlap with BAO measurements from the Lyman- forest observed with galaxy surveys, allowing a calibration of the LIM BAO. Note that the Lyman- Forest is inherently more sensitive to the radial direction, while the opposite is often true for LIM experiments.
In Figure 2, we show the forecasted marginalized constraints on the plane - , for the case of CO. The correlation between radial and transverse BAO measurements changes with redshift, although this is mainly driven by the transformation of angular and radial resolutions into physical distances. The correlations between cosmological parameters contrained using BAO measurements, such as the Hubble constant and the matter density parameter today also change with redshift (see e.g. Ref. Cuceu_BAOH0 for results from galaxy surveys).
It should be emphasized that although the evolution of at is completely determined by under CDM, we still lack direct empirical evidence of the expansion history in these epochs (CMB lensing provides an integrated constrained, roughly peaked at Aghanim:2018oex ). There are models that predict other behaviors, including modified gravity theories or dark matter decaying into lighter dark particles (see e.g. Refs. Raveri_DEMG ; Kyriakos_dcdm ). These models, as well as alternative modifications of the cosmic expansion in the matter dominated era, could potentially reduce the Hubble tension. Still, model-independent reconstructions of the Hubble parameter currently remain unconstrained beyond (BernalH0, ; StandardQuantities, ; Joudaki:2017zhq, ).
Therefore, perhaps the most convincing way to demonstrate the potential of LIM BAO measurements is to consider a model-independent expansion history. Following Ref. BernalH0 , we parametrize with natural cubic splines. We locate the nodes of the splines at and fit the values of at these nodes using uniform priors and the following data222We run MonteCarlo Markov Chains using the python package emcee emcee , publicly available at dfm.io/emcee/.: the local measurement of RiessH0_19 ; Type-Ia supernovae (SNeIa) Scolnic_pantheon ; BAO from galaxies Beutler11 ; Ross15 ; Alam_bossdr12 ; Kazin14_wz ; eBOSS_baoz72 , quasars GilMarin_qsoeBOSS and the Lyman- forest eBOSS_Lyalpha_auto ; eBOSS_Lyalpha_cross ; and measured from 2018 Planck data Planck18_pars . In addition, we draw samples from the 2D-Gaussian forecasted uncertainties for LIM BAO from SPHEREx and IMS3 (CO), centered at the fiducial values. The node locations are chosen to optimize the constraining power of the different datasets.
In Fig. 3, we show the constraints on the model-independent reconstruction of , with and without the estimated LIM BAO measurements. While the and measurements constrain the amplitude of , the shape is constrained by the SNeIa and BAO data. We can see how, without the LIM BAO measurements, the expansion history is completely unconstrained beyond , given the lack of observations. Fortunately, LIM BAO measurements will enable us to fill this gap and extend the constraints on the expansion history of the Universe up to . Moreover, in the redshift range , these constraints will be below the level, even for model-independent parametrizations.
Results using our methodology as forecasted in this Letter would represent an incredible achievement for cosmology and provide a unique means to directly measure how the Universe expands at and up to . In the future, standard sirens (standard_siren, ; Feeney:2018mkj, ; Chen:2017rfc, ) might also achieve this goal, although the sensitivity needed to obtain precise measurements of neutron star mergers and their electromagnetic counterparts at these redshifts is considerably more exigent than what is expected from upcoming and future experiments. Moreover, also using LIM observations, measurements of the velocity-induced acoustic oscillations Munoz_vao_meth at cosmic dawn, as proposed in Ref. Munoz_vao , can potentially constrain the expansion rate at . Thus, thanks to LIM experiments, our ignorance about the expansion of the Universe may be limited to , where there is little room to accommodate a solution to the tension. LIM can thus shed light on various potential scenarios suggested to solve the tension Karwal:2016vyq ; Poulin_EDE ; Lin:2019qug ; Kreisch_selfnu ; Yang:2019nhz ; Archidiacono:2019wdp ; Hooper:2019gtx ; Vattis:2019efj ; Pandey:2019plg ; Pan:2019gop ; Desmond:2019ygn ; Agrawal:2019lmo ; Vagnozzi:2019ezj .
Foregrounds and line-interlopers might degrade the results reported here, but we emphasize that spectral lines related to star formation are significantly brighter than the 21cm line in comparison to their sources of contamination. Moreover, in the coming years there will be several LIM observations which will overlap with galaxy surveys. Cross-correlations between different tracers will make it possible to subtract this contamination from the LIM signals (see e.g., Refs. Silva_Lyalpha ; Sun_foregrounds ). Finally, we must emphasize that the luminosity functions of spectral lines at high redshift are still highly uncertain. Although using our methodology to disentangle between astrophysical and cosmological dependences, this should not bias the measurements Bernal_IM , it may certainly affect the precision of the measurement by modifying the signal-to-noise ratio if the amplitude of the LIM power spectrum turns out to be lower than assumed here. We have accounted for this by choosing line emission models whose predictions are neither too optimistic nor too conservative.
To conclude, LIM experiments can provide precise and robust measurements of the BAO scale up to the epoch of reionization at . These observations will provide superb constraints on the expansion history of the Universe, probe models of exotic dark matter, dynamical dark energy, modified gravity, etc., and in general open a new discovery space in the high-redshift universe.
We acknowledge useful conversations with Tzu-Ching Chang, Olivier Doré, Héctor Gil-Marín and Licia Verde. JLB is supported by the Spanish MINECO under grant BES-2015-071307, co-funded by the ESF.
The reference list from the paper itself. Each links out to its DOI / PubMed record.
- 1(1) E. Hubble, “A Relation between Distance and Radial Velocity among Extra-Galactic Nebulae,” Proceedings of the National Academy of Science 15 (Mar., 1929) 168–173 . · doi ↗
- 2(2) A. G. Riess, A. V. Filippenko, P. Challis, A. Clocchiatti, A. Diercks, et al. , “Observational Evidence from Supernovae for an Accelerating Universe and a Cosmological Constant,” Astronom. J. 116 no. 3, (Sep, 1998) 1009–1038 , ar Xiv:astro-ph/9805201 [astro-ph] . · doi ↗
- 3(3) S. Perlmutter, , and T. S. C. Project, “Measurements of Ω Ω \Omega and Λ Λ \Lambda from 42 High-Redshift Supernovae,” Astrophys. J. 517 no. 2, (Jun, 1999) 565–586 , ar Xiv:astro-ph/9812133 [astro-ph] . · doi ↗
- 4(4) A. J. Cuesta, L. Verde, A. Riess, and R. Jimenez, “Calibrating the cosmic distance scale ladder: the role of the sound horizon scale and the local expansion rate as distance anchors,” Mon. Not. Roy. Astron. Soc. 448 no. 4, (2015) 3463–3471 , ar Xiv:1411.1094 [astro-ph.CO] . · doi ↗
- 5(5) W. L. Freedman, “Cosmology at a Crossroads,” Nat. Astron. 1 (2017) 0121 , ar Xiv:1706.02739 [astro-ph.CO] . · doi ↗
- 6(6) A. G. Riess, S. Casertano, W. Yuan, L. M. Macri, and D. Scolnic, “Large Magellanic Cloud Cepheid Standards Provide a 1% Foundation for the Determination of the Hubble Constant and Stronger Evidence for Physics Beyond Lambda CDM,” ar Xiv e-prints (Mar., 2019) , ar Xiv:1903.07603 .
- 7(7) Planck Collaboration, N. Aghanim, et al. , “Planck 2018 results. VI. Cosmological parameters,” Ar Xiv e-prints (July, 2018) , ar Xiv:1807.06209 .
- 8(8) K. C. Wong et al. , “H 0Li COW XIII. A 2.4% measurement of H 0 subscript 𝐻 0 H_{0} from lensed quasars: 5.3 σ 5.3 𝜎 5.3\sigma tension between early and late-Universe probes,” ar Xiv:1907.04869 [astro-ph.CO] .