Physical properties of $R$Bi$_2$ ($R=$La, Ce) under pressure
Li Xiang, Elena Gati, Kathryn Neilson, Sergey L. Bud'ko, Paul C., Canfield

TL;DR
This study investigates the electrical and thermodynamic properties of $R$Bi$_2$ ($R$=La, Ce) under pressure, revealing signatures of non-bulk superconductivity likely due to Bi flux traces, and a pressure-induced increase in antiferromagnetic transition temperature for CeBi$_2$.
Contribution
First detailed pressure-dependent transport and thermodynamic measurements on $R$Bi$_2$ compounds, clarifying the nature of observed superconductivity and magnetic transitions.
Findings
Superconductivity signatures appear above 1.7 GPa in resistance measurements.
No bulk superconductivity detected in specific heat measurements.
Antiferromagnetic transition temperature of CeBi$_2$ increases with pressure.
Abstract
We present a study of electrical transport properties of Bi ( = La, Ce) under hydrostatic pressure up to 2.5 GPa. These measurements are complemented by thermodynamic measurements of the specific heat on CeBi at different pressures up to 2.55 GPa. For CeBi, we find a moderate increase of the antiferromagnetic transition, , from 3.3 K to 4.4 K by pressures up to 2.55 GPa. Notably, resistance measurements for both CeBi and LaBi show signatures of superconductivity for pressures above 1.7 GPa. However, the absence of superconducting feature in specific heat measurements for CeBi indicates that superconductivity in CeBi (and most likely LaBi as well) is not bulk and likely originates from traces of Bi flux, either on the surface of the plate-like samples, or trapped inside the sample as laminar inclusions.
Click any figure to enlarge with its caption.
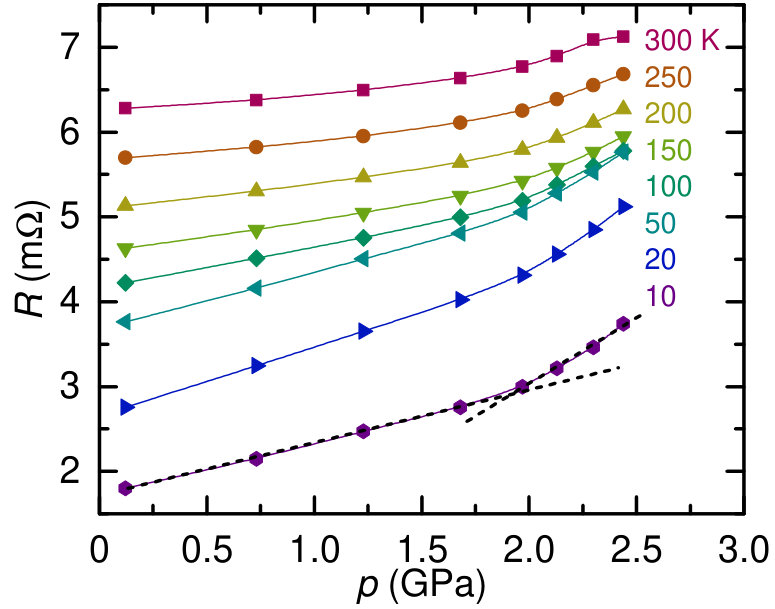 Figure 1
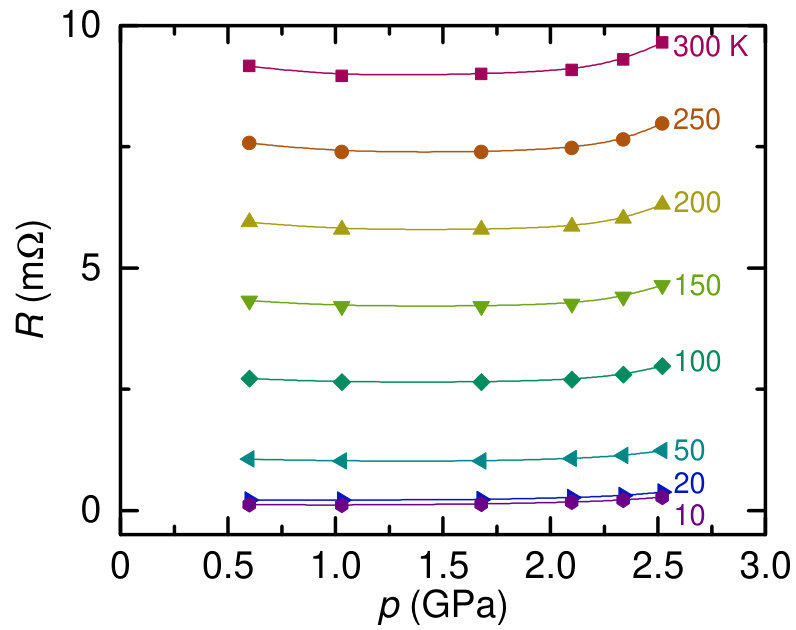 Figure 2
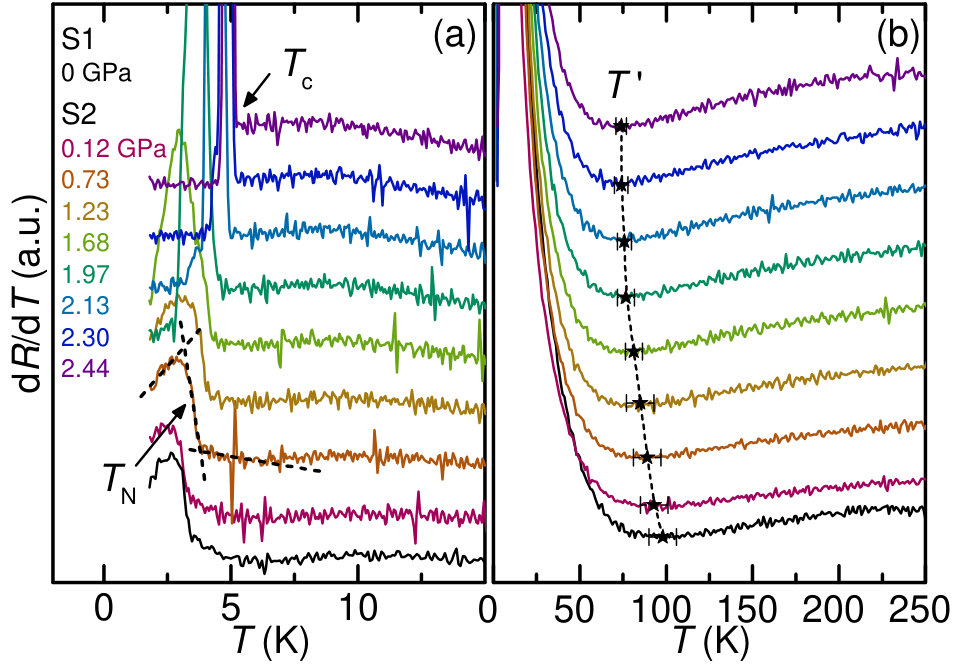 Figure 3
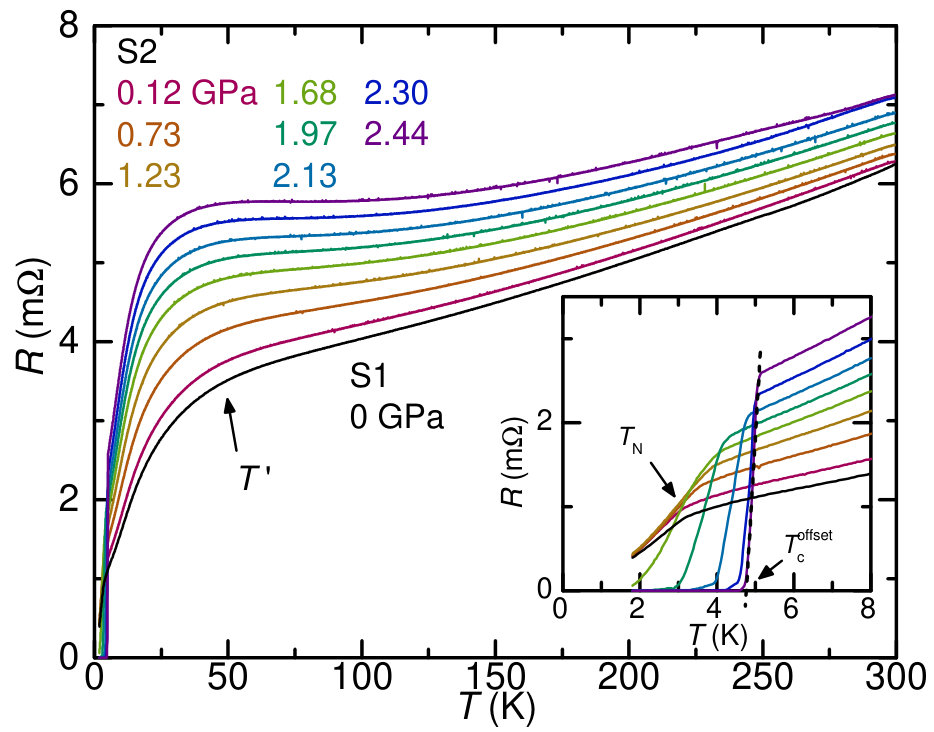 Figure 1
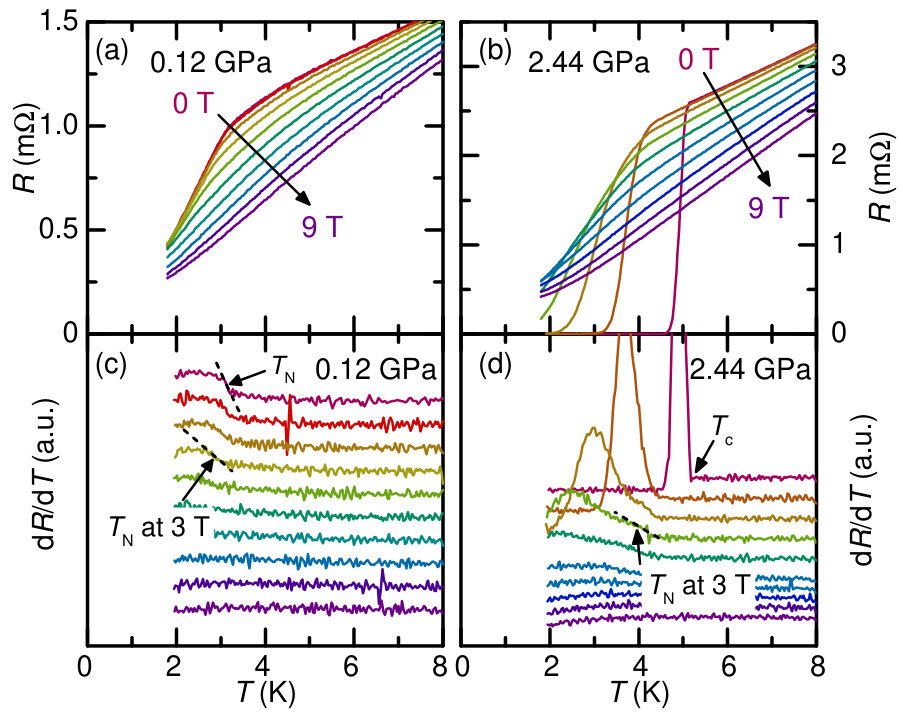 Figure 2
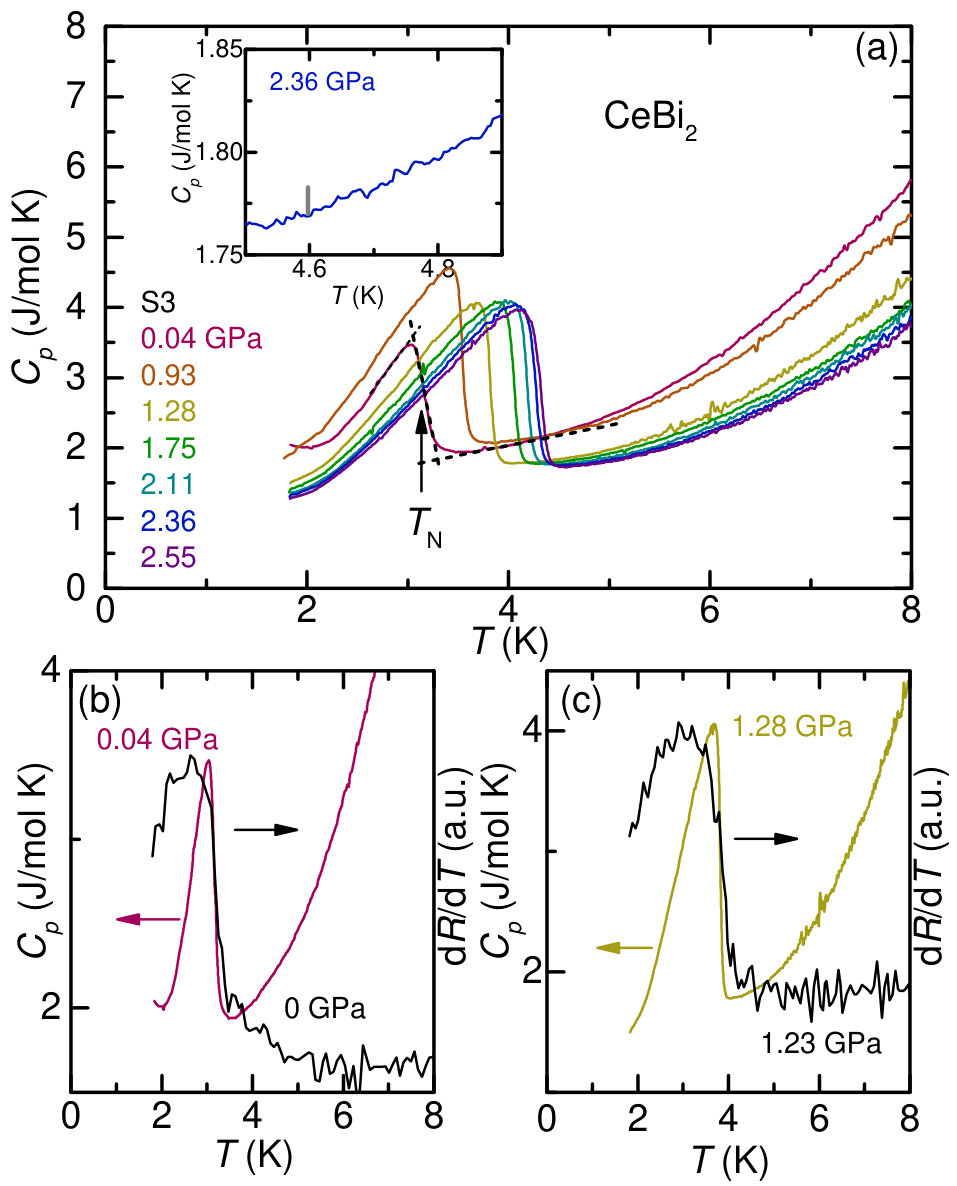 Figure 3
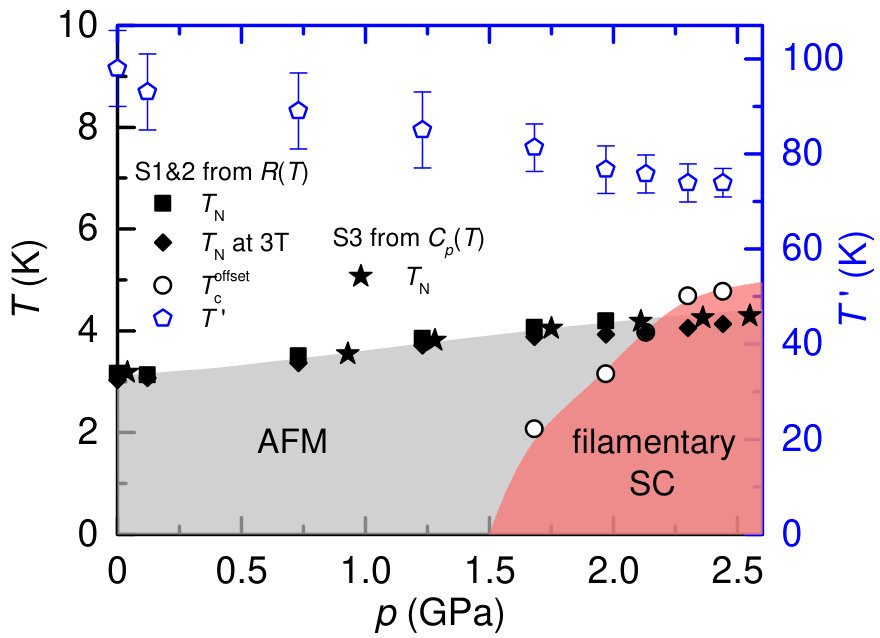 Figure 4
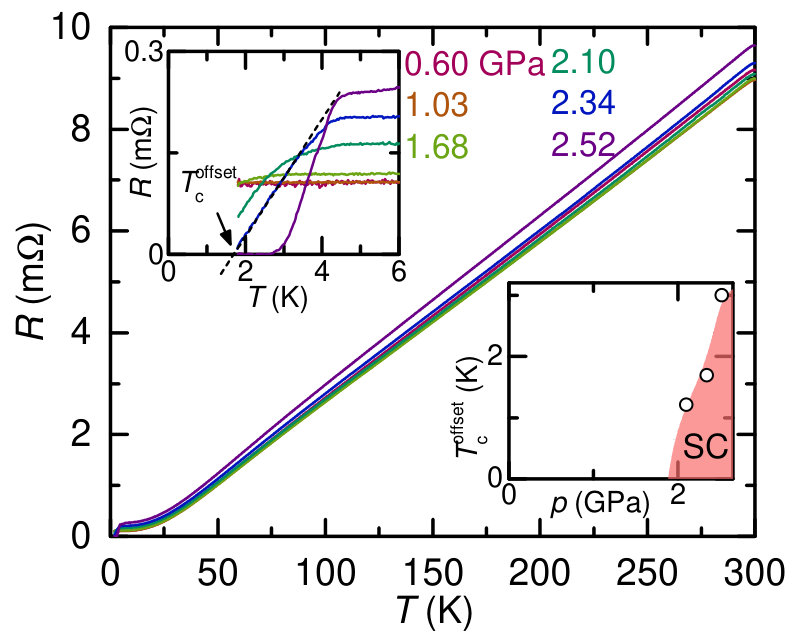 Figure 5
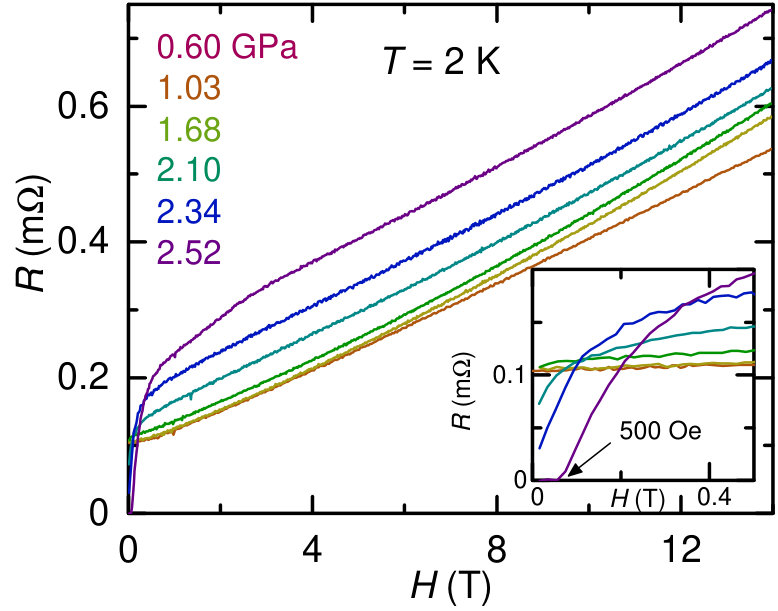 Figure 6
Peer Reviews
No public reviews on file for this paper yet. If you reviewed it on a platform where reviews are public (OpenReview, ICLR, NeurIPS, ICML), you can paste yours below so the community can read it here.
Videos
No videos yet. Explain this paper in a talk, walkthrough, or lecture? Add one.
Physical properties of Bi2 (La, Ce) under pressure
Li Xiang
Ames Laboratory, Iowa State University, Ames, Iowa 50011, USA
Department of Physics and Astronomy, Iowa State University, Ames, Iowa 50011, USA
Elena Gati
Ames Laboratory, Iowa State University, Ames, Iowa 50011, USA
Department of Physics and Astronomy, Iowa State University, Ames, Iowa 50011, USA
Kathryn Neilson
Department of Physics and Astronomy, Iowa State University, Ames, Iowa 50011, USA
Sergey L. Bud’ko
Ames Laboratory, Iowa State University, Ames, Iowa 50011, USA
Department of Physics and Astronomy, Iowa State University, Ames, Iowa 50011, USA
Paul C. Canfield
Ames Laboratory, Iowa State University, Ames, Iowa 50011, USA
Department of Physics and Astronomy, Iowa State University, Ames, Iowa 50011, USA
Abstract
We present a study of electrical transport properties of Bi2 ( = La, Ce) under hydrostatic pressure up to 2.5 GPa. These measurements are complemented by thermodynamic measurements of the specific heat on CeBi2 at different pressures up to 2.55 GPa. For CeBi2, we find a moderate increase of the antiferromagnetic transition, , from 3.3 K to 4.4 K by pressures up to 2.55 GPa. Notably, resistance measurements for both CeBi2 and LaBi2 show signatures of superconductivity for pressures above 1.7 GPa. However, the absence of superconducting feature in specific heat measurements for CeBi2 indicates that superconductivity in CeBi2 (and most likely LaBi2 as well) is not bulk and likely originates from traces of Bi flux, either on the surface of the plate-like samples, or trapped inside the sample as laminar inclusions.
I Introduction
Bi-rich compounds manifest a rich variety of ground states. For example, Bi-based families such as Bi ( = Li and Na)Sambongi (1971); Kushwaha et al. (2014), Bi2 ( = K, Rb, Cs and Ca)Roberts (1976); Winiarski et al. (2016) and Bi3 ( = Sr, Ba, Ca, Ni, Co, and La) are superconducting (SC) at low temperature Matthias and Hulm (1952); Shao et al. (2016); Kinjo et al. (2016); Xiang et al. (2018); Gati et al. (2018); Tencé et al. (2014). Bi ( = Ce, Nd, Tb and Dy) and Bi2 ( = La-Nd, Sm) families have low-temperature magnetic ground states with complex phase diagramsNereson and Arnold (1971); Petrovic et al. (2002). Moreover, due to the strong spin-orbit coupling of Bi-6 electrons they can have substantial ferromagnetic anisotropy, like MnBiIsaeva et al. (2013); Taufour et al. (2015), or, more recently, they have became candidates for realizing novel topological phases, such as topological insulators or topological superconductorsHasan and Kane (2010); Qi and Zhang (2011); Hor et al. (2010); Xia et al. (2009); Chen et al. (2009).
Among these, the Bi2 family displays different magnetic ground states depending on the choice of Petrovic et al. (2002). Structurally, Bi2 forms in an orthorhombic structure with single layers of Bi separated from each other by Bi bilayers that are stacked along the crystallographic axisPetrovic et al. (2002); Zhou et al. (2018). When is chosen to be the moment-bearing Ce ion, an antiferromagnetic (AFM) ground state below 3.3 K can be stabilizedPetrovic et al. (2002). A recent study shows that CeBi2 is a Kondo system with a Sommerfeld coefficient over 200 mJ/mol K2 and Kondo temperature of an order of 2 KZhou et al. (2018). On the other hand, for La (non-moment bearing), LaBi2 reveals metallic behavior without indications of magnetic ordering or superconductivity down to 1.8 KPetrovic et al. (2002).
In this study, we perform a comparative study of the ground-state tunability of these two members by external pressure. We explore the temperature-pressure phase diagram of CeBi2 and LaBi2 by resistance measurements and complement these, in case of CeBi2, with specific heat measurements. Our results show that of CeBi2 is moderately increased upon increasing pressure. Surprisingly, resistance measurements of both CeBi2 and LaBi2 show signatures pressure-induced superconductivity at low temperature ( 4 K) above very similar threshold pressures ( 1.68 GPa). However, specific heat measurement of CeBi2 does not reveal any anomaly that could be associated with a transition into the superconducting state. We assign these effects to filamentary SC that likely originates from traces of Bi flux, either on the surface of the plate-like samples, or trapped inside the sample as laminar inclusions. Finally, the analysis of pressure-dependent resistance data at fixed temperatures for CeBi2 suggests that there might be a pressure-induced crossover most likely associated with pressure-induced changes in the Kondo temperature and crystal electric field splitting.
II Experimental details
Single crystals of CeBi2 and LaBi2 were grown by a Bi self-flux technique with the help of a frit-disk alumina Canfield Crucible SetCanfield and Fisk (1992); Canfield et al. (2016). For CeBi2, Ce and Bi in the molar ratio 9:91 were loaded into a crucible set and sealed into a fused silica ampoule under partial argon atmosphere. The ampoule was heated to 1000 ∘C in 5 h and dwelled at this temperature for another 4 h. It was then slowly cooled to 600 ∘C over 45 h. At this temperature, the ampoule was removed from the furnace and excess liquid was decanted by the help of a centrifuge. For LaBi2, La and Bi in the molar ratio 8:92 were loaded into the crucible set, heated to 1000 ∘C in 5h, dwelled at 1000 ∘C for 2 h, and slowly cooled to 350 ∘C over 80 h. The resulting crystals of CeBi2 and LaBi2 are millimeter-size and plate-shaped. Both CeBi2 and LaBi2 crystals are air-sensitive, the preparation of experiments was therefore performed in a N2 glovebox.
The , in-plane resistance measurements were performed in a Quantum Design Physical Property Measurement System (PPMS) using a 1 mA excitation with frequency of 17 Hz, on cooling using a rate of - 0.25 K/min. The magnetic field was applied perpendicular to the current direction. For CeBi2, two different samples (labeled as S1 and S2) were used in resistance measurements. S1 was measured at ambient condition outside pressure cell and S2 was measured under pressure. The temperature-dependent resistance data for S1 is normalized by extrapolating pressure-dependent resistance data, , at 300 K from S2 back to 0 GPa (see Fig. 1). For LaBi2, only one sample was measured under pressure with the pressures 0.60 GPa 2.52 GPa. For both compounds, a standard four-contact configuration was used with contacts made by Dupont 4929N silver paint. Specific heat measurements under pressure were performed using an ac calorimetry technique on a third sample (sample S3) in a cryogen-free cryostat from ICEOxford (Lemon-Dry) with base temperature of 1.4 K. Details of the setup used and the measurement protocol are described in Ref. Gati et al., 2019.
In this study, a Be-Cu/Ni-Cr-Al hybrid piston-cylinder cell, similar to the one described in Ref. Bud’ko et al., 1984, was used to apply pressure. Good hydrostatic conditions were achieved by using a 4:6 mixture of light mineral oil:n-pentane as pressure medium, which solidifies, at room temperature, in the range GPa, i.e., well above our maximum pressureBud’ko et al. (1984); Kim et al. (2011); Torikachvili et al. (2015). Pressure values were inferred from the of leadBireckoven and Wittig (1988), determined via resistance measurements.
III Results
III.1 CeBi2
Figure 1 shows the temperature-dependent resistance of CeBi2 at ambient pressure (sample S1) and pressure up to 2.44 GPa (sample S2). The temperature-dependent resistance data for S1 is normalized by extrapolating the 300 K pressure-dependent resistance data ( for 1.23 GPa) measured from S2 back to 0 GPa. As shown in the figure, the resistance decreases upon cooling, showing a metallic behavior. At 50 K, a broad drop of resistance is observed. In an earlier work, it was suggested that this drop in is associated with either the coherence in Kondo scattering or crystal electric-field (CEF) splitting of Ce atomsZhou et al. (2018). At 3.3 K, the resistance shows a kink-like anomaly due to loss of spin-disorder scattering as CeBi2 undergoes an AFM transition at Petrovic et al. (2002); Zhou et al. (2018). Sample S2 was measured under pressure and at lowest pressure (0.12 GPa), resistance of S2 shows very similar feature as S1. Upon increasing pressure, the resistance gradually increases over a large temperature range (essentially everywhere in the paramagnetic state). This is a typical behavior for a Ce-based Kondo lattice under pressureThompson and Lawrence (1994); Hegger et al. (2000); Nicklas et al. (2001, 2003). The broad drop of resistance at ambient pressure becomes progressively more pronounced, as pressure is increased, and evolves into a local maximum at highest pressures. The temperature of this broad drop/hump feature is labeled as and indicated by arrow in the figure (see below for the description of the criterion used). The evolution of this feature will be analyzed and discussed in more details below. As we move to the low-temperature region (inset to Fig. 1), for 1.23 GPa, the kink-like anomaly, which is associated with the magnetic transitionPetrovic et al. (2002); Zhou et al. (2018), is shifted to higher temperatures upon increasing pressure. Even with this slight increase in , the loss of spin disorder scattering below remains fundamentally the same. As a result, the resistance at 1.8 K, (1.8 K), does not show a significant change. Upon increasing from 1.23 GPa to 1.68 GPa, (1.8 K) shows a sudden decrease. For 1.68 GPa, the resistance as a function of temperature, , undergoes a much sharper drop and reaches a zero value, suggesting a pressure-induced superconducting phase at low temperature. The critical temperature of this phase is increased upon increasing pressure.
The temperature-derivative of the resistance data is shown in Fig, 2 to better differentiate between the low and high feature at low temperature as well as to trace the broad feature at 50 K. As shown in Fig.2 (a), at low pressures ( 1.23 GPa), the magnetic transition shows up as a jump-like feature in the d/d. We therefore define as the midpoint of the jump-like feature in d/d (see dotted lines and arrow in Fig. 2 (a) as well as Figs. 5 (b) and (c) below). As a result, increases with increasing with a slope of 0.48 K/GPa. At higher pressures ( 1.68 GPa), the superconducting transition can be seen as a sharp peak in d/d. Figure 2 (b) shows d/d curves over a larger temperature range. As shown in the figure, the broad drop/hump features in are reflected in minima d/d. We therefore define the crossover temperature , which marks the change between two different resistance regimes, by the minima in the the d/d as indicated by the dashed lines in the figure. It is clearly seen that increases upon increasing pressure.
To trace the magnetic transition to higher pressures, the temperature-dependent resistance under magnetic fields up to 9 T applied along the -axis was studied. The applied field can suppress the superconducting transition which masks the signature of the magnetic transition for 1.68 GPa. The results for selected pressures are presented in Fig. 3. As shown in Figs. 3 (a) and (c), at 0.12 GPa the kink-like anomaly in associated with magnetic transition is broadened in higher fields, yet not much shifted with an applied field of 3 T. In the temperature derivative of the resistance data, the corresponding jump-like feature is suppressed with increasing magnetic fields until it disappears at higher fields. At 2.44 GPa, the sharp drop of the resistance in associated with superconducting transition at 5 K is suppressed to lower temperatures with magnetic fields and the kink-like anomaly re-emerges at 4 K. Further increasing magnetic fields broadens the kink-like anomaly until it disappears. Similarly, in the temperature derivative d/d, we first observed a sharp peak associated with the superconducting transition at low magnetic fields. Upon increasing the field, the sharp peak is suppressed and shifted to lower temperatures, at the same time, a second jump-like feature emerges. At even higher fields, both features disappear. By analogy we associate this re-emerged kink-like anomaly in (jump-like feature in d/d) with the same magnetic transition that is observed at low pressures. The resistance does not become zero at 1.8 K for magnetic field 2 T indicating a critical field of 2 T at 1.8 K.
To further investigate the overall increase of resistance with pressure, we present in Fig. 4 the pressure dependent resistance at fixed temperatures. As shown in the figure, a change of slope is observed when pressure is increased from 1.68 GPa to 1.97 GPa at 10 K, this feature persists up to 300 K, the highest temperature investigated in this study. The strongest pressure responses are for , suggesting shifts in the Kondo feature around . Whereas the data for 300 K are quite similar to what is found for LaBi2 in Fig. 9 (see below).
The observation of a state with zero resistance in CeBi2 calls for a thermodynamic investigation of the temperature-pressure phase diagram. Thus, we studied the specific heat of CeBi2 (sample S3) under pressure and the results are presented in Fig. 5 (a). At lowest pressure (0.04 GPa), very close to ambient pressure, the specific heat, , nicely reveals a nearly mean-field-like anomaly at 3.2 K, which speaks in favor of a second-order phase transition. The shape, position, and size of the feature is consistent with the specific results of a previous study and therefore allows us to assign this feature to the magnetic transition at . Figures. 5 (b) and (c) show the comparison between temperature dependent and d/d at two sets of nearly identical pressures (0.04 GPa and 0 GPa, 1.28 GPa and 1.23 GPa). As shown in the figure, temperature-dependent and d/d exhibit similar jump-like feature at the transition temperature which is consistent with the Fisher-Langer relationFisher and Langer (1968); Alexander et al. (1976). Thus, to determine the transition temperature, , from specific heat measurement, same criterion as in the resistance measurement is used (midpoint of jump-like anomaly as indicated by dashed lines and arrow in Fig. 5 (a)). As pressure is increased up to 2.55 GPa, is monotonically increased. At the same time, the jump size of the anomaly does not significantly change indicating that the amount of entropy released at is unchanged. However, we did not observe a second feature at any pressure, thus suggesting that CeBi2 does not undergo any other phase transition than the magnetic one. This includes in particular also a possible superconducting transition for 1.68 GPa inferred from our resistance data. One might argue that a possible superconducting feature in specific heat is masked by the huge entropy release at the magnetic transition, as and the resistive are very close. However, even at high pressure, at which we expect that and are well separated, no feature in specific heat occurs (see inset of Fig. 5 (a)). Another possibility for the apparent absence of a specific heat feature might be that the superconducting jump size is very small and therefore falls below the resolution limit. In the following, we provide estimates for the lower and upper bound of superconducting jump size in CeBi2.
For a phonon-mediated BSC superconductor, the specific heat jump at the superconducting transition can be written as,
[TABLE]
where is the electronic Sommerfeld coefficient and is the superconducting transition temperature. To estimate a possible lower limit of , we first assume that superconductivity is unrelated to the Kondo-lattice-nature of CeBi2. Thus, for the choice of , we refer to the nonmagnetic reference LaBi2 which is isostructural to CeBi2. Since LaBi2 has a value of 2 mJ/mol K2Petrovic et al. (2002), with 4.6 K from Fig. 1, we get 13.2 mJ/mol K. Compared to the noise level, such value of specific jump (gray vertical line in the inset of Fig. 5 (a)) should be resolvable. For an upper limit, we take the value of the Kondo-lattice CeBi2, 200 mJ/mol K2Zhou et al. (2018), we get 1.32 J/mol K, which would be one hundred times larger than the gray vertical line in the inset of Fig. 5 (a). The absence of any resolvable specific heat jump feature, which can be associated with superconductivity, suggests that the pressure-induced superconductivity is likely filamentary rather than bulk. This conclusion will be related to again below after presentation of data on LaBi2.
We summarize our and data for CeBi2 as well as our (filamentary) data in the temperature-pressure () phase diagram shown in Fig. 6. For the magnetic transition, both at zero field and 3 T from resistance measurement (Fig. 3) and from zero field specific heat data are included. For superconducting transition, is determined from resistance measurement (Fig. 1 (b)). The values, inferred from and agree reasonably well within their experimental resolution. As shown in Fig. 6, magnetic field suppresses magnetic transition slightly ( 0.2 K by 3 T), as is often the case for antiferromagnets. increases monotonically with pressure with a rate of 0.48 K/GPa up to 2.55 GPa. For superconductivity, it first sets in at 1.68 GPa with a sharp drop in , yet not give rise to zero resistance down to 1.8 K. Upon increasing pressure, the drop in becomes progressively sharper and zero resistance at low temperature is reached as well. Furthermore, from 1.68 GPa to 2.44 GPa, monotonically increases from 2.1 K to 4.8 K, appearing to saturate at our highest pressure. Finally, the temperature associated with Kondo coherence scattering or CEF splitting is suppressed upon increasing pressure, with 98 K at 0 GPa and 74 K at 2.44 GPa.
III.2 LaBi2
Next, we discuss our resistance data for the non-magnetic, LaBi2, member of the Bi2 family. Figure 7 presents the pressure evolution of the temperature-dependent resistance for LaBi2 with pressures 0.60 GPa 2.52 GPa. For all pressures, resistance decreases upon cooling, showing metallic behavior. For a large temperature range ( 50 K), the resistance shows linear dependence on temperature. In the low-temperature region (upper inset of Fig. 7), for 1.03 GPa, resistance as a function of temperature is relatively flat suggesting that the low-temperature resistance is dominated by impurity scattering. At 1.68 GPa, shows a faster drop of resistance below 2.5 K. When pressure is further increased, this drop of resistance becomes more pronounced. At 2.52 GPa, resistance actually drops to zero below 2.7 K, suggesting pressure-induced superconductivity. The drop of resistance, visible for 1.68 GPa 2.34 GPa, is likely to be associated with traces of superconducting phase. Using the criterion defined in the upper inset of Fig. 7, the superconducting transition temperature, , can be traced and the results are shown in the bottom inset of Fig. 7. As shown in the figure, increases from 1.2 K to 3 K when pressure is increased from 2.10 GPa to 2.52 GPa.
The field dependence of the resistance at 2 K was studied and is presented in Fig. 8. For 1.03 GPa, resistance gradually increases with magnetic field with a slightly up-bending curvature. For 1.68 GPa, at low fields, the resistance first undergoes a fast increase upon increasing fields, which is likely due to the suppression of superconductivity. At higher fields, curves behave similarly with the ones at lower pressures. Moreover, at 2.52 GPa the zero resistance at 2 K is lifted for 500 Oe, indicating a critical field of 500 Oe. Bearing in mind that close to ambient pressure the magnetoresistance clearly deviates from the conventional behavior, we observe that pressures up to 2.5 GPa do not modify this behavior (besides the lower field effects of superconductivity) in any conspicuous way. The data in Figs. 7 and 8 are consistent with traces of SC phase, with distributions of values existing in the LaBi2 sample. The mean of these filamentary traces increases with pressure for 1.68 GPa.
To better visualize the pressure evolution of the higher temperature resistance for LaBi2, Fig. 9 presents the pressure-dependent resistance at fixed temperatures. The resistance of LaBi2 first decreases and then increases with pressure, giving rise to a broad minimum between 1.03 GPa and 1.68 GPa. Compared with the of CeBi2, of LaBi2 has a similar higher-pressure, higher-temperature up-turn, but lacks the larger pressure dependence seen in CeBi2.
IV Discussion
Before discussing the implications of the zero-resistive state, which we observed in CeBi2 and LaBi2 at higher pressures, we first focus on the increase of and decrease of under pressure in CeBi2, as this is robustly established by our resistance and specific heat study. The properties of a Kondo lattice system are usually dominated by two characteristic energy scales, which are both susceptible to externally applied pressure: Ruderman-Kittel-Kasuya-Yosida (RKKY) interaction energy and Kondo interaction energy where is the exchange interactionRuderman and Kittel (1954); Kasuya (1956); Yosida (1957); Kondo (1964); Hewson (1993). When , the ground state is magnetic and for , it is nonmagnetic. The competition between them and the resulting ground state is often described by the Doniach phase diagramDoniach (1977). For Ce-based compounds, the ground state is often magnetic. Applying external pressure can suppress magnetic transition temperature to zero and lead to non-magnetic ground state via a quantum critical pointSteglich et al. (1979); Jaccard et al. (1992); Mathur et al. (1998); Park et al. (2006); Knebel et al. (2006a); Jiao et al. (2015). In our study, the AFM transition temperature of CeBi2 is moderately increased by pressure up to 2.5 GPa. This suggests that at ambient pressure, CeBi2 is deeply in its magnetic state and higher pressure is needed to suppress Knebel et al. (2006b); Chen et al. (2006); Kimura et al. (2007); Bauer et al. (2010). This is compatible with the Doniach picture, as there is a maximum of due to the explicit functional dependences of and . Moreover, in the Doniach picture, when pressurizing a Ce-based Kondo lattice, an increase of is often observed due to the enhancement of exchange interaction Thompson and Lawrence (1994); Goltsev and Abd-Elmeguid (2005). This, in turn, should give rise to a shift of broad resistive features, associated with , to higher temperatures with pressure. Therefore, a suppression of observed in this study suggests that the broad drop/hump feature in can not be explained by only the Kondo coherence scatteringHegger et al. (2000); Muramatsu et al. (2001); Nicklas et al. (2003).
The resistance measurements for both CeBi2 and LaBi2 reveal a zero-resistive state at high pressures, suggesting a pressure-induced SC phase for these compounds. By comparing their phase diagrams (Figs. 6 and 7 (a) inset), we see that the two phase diagrams exhibit similar SC phase regions, but with slightly different onset pressures and values. For CeBi2 saturated at 4.8 K by 2.44 GPa whereas of LaBi2 reaches 3 K but seems still rising with pressure. Moreover, at the highest pressures in this study (2.44 GPa for CeBi2 and 2.52 GPa for LaBi2), CeBi2 and LaBi2 have very different critical fields at 2 K ( 2 T for CeBi2 and 500 Oe for LaBi2).
Despite the zero-resistive state and relative sharp resistance drop at high pressures for CeBi2 and LaBi2, we would like to argue that the observed SC feature is extrinsic for the following reasons. First of all, specific heat measurement under pressure for CeBi2 does not reveal any SC feature which strongly speaks in favor of filamentary SC. Second, similar values for Ce and La are unlikely in bulk Bi2. On one hand, if the SC in these two compounds is standard BSC SC, then hybridizing rare earths such as Ce or Yb suppresses aggressivelyMaple et al. (1972); Canfield et al. (1998); Bud’ko and Canfield (2006). On the other hand, if CeBi2 at high pressures becomes a heavy fermion superconductor, the specific heat jump anomaly at should be even bigger. Then similar SC onset pressure and between LaBi2 and CeBi2 are unlikely again as LaBi2 is not a heavy fermion compound.
To speculate about the possible origin of the filamentary SC, we refer to literature. First we notice that similar situation has been found in other Bi compounds as well where SC is attributed to Bi flux or thin films of BiThamizhavel et al. (2003); Mizoguchi et al. (2011); Lin et al. (2013). Moreover, it is know that single-crystalline Bi undergoes sequential structural transitions upon increasing pressure and possesses rich physics under pressureKlement et al. (1963); Degtyareva et al. (2004); Li et al. (2017). Specifically, at low temperature, Bi-II exists between 2.55 GPa and 2.70 GPa with 3.9 K and upper critical field (2 K) 0.05 T, Bi-III exists between 2.70 GPa and 7.7 GPa with 7 K and (2 K) 3 TLi et al. (2017). Owing to the very similar of Bi-II to our results on CeBi2 in the almost identical pressure range, we suspect that the filamentary SC we observed in the resistance measurement of CeBi2 originates from traces of Bi flux. It is likely that the SC in LaBi2 is non-bulk and origins from Bi flux as well. Slight differences in onset pressure and could arise from details of the unit cell parameters which could give rise to slightly different strain conditions.
V Conclusion
In conclusion, the resistance of Bi2 ( = La and Ce) under pressure up to 2.5 GPa and ac specific heat of CeBi2 under pressure up to 2.55 GPa have been studied. Our studies show that for CeBi2 the antiferromagnetic transition temperature, , increases upon increasing pressure with the rate of 0.48 K/GPa. This fits into the Doniach phase diagram and suggests that there might be a maximum of , followed by its decrease and finally a quantum critical point at possibly significantly higher pressures. Resistance and ac specific heat measurements of CeBi2 together suggest that the pressure-induced superconductivity in CeBi2 is likely not bulk. It is likely that the SC phase is filamentary Bi either on the surface or as laminar in the bulk of the sample. We suspect the pressure-induced superconductivity in LaBi2 to arise from a similar extrinsic origin giving that the onset pressure and transition temperature of superconductivity are very similar to that of CeBi2. Further pressure-dependent resistance analyses for CeBi2 and LaBi2 indicate some anomalies in the curves, a change of slope between 1.68 GPa and 1.97 GPa for CeBi2 and a broad minimum between 1.03 GPa and 1.68 GPa for LaBi2. Taken together, these suggest that the stronger, low-temperature features see near and below for CeBi2 are related to the pressure dependent hybridization and crystal electric field splitting of the Ce.
Finally, we would like to point out, again, that when studying the properties of Bi-rich compounds under pressure, one needs to be very careful and mindful for the various phases elemental Bi has and the rich physics they display at different pressuresKlement et al. (1963); Degtyareva et al. (2004); Li et al. (2017).
Acknowledgements.
Work at the Ames Laboratory was supported by the U.S. Department of Energy, Office of Science, Basic Energy Sciences, Materials Sciences and Engineering Division. The Ames Laboratory is operated for the U.S. Department of Energy by Iowa State University under Contract No. DEAC0207CH11358. L.X. was supported, in part, by the W. M. Keck Foundation and the Gordon and Betty Moore Foundation’s EPiQS Initiative through Grant GBMF4411.
The reference list from the paper itself. Each links out to its DOI / PubMed record.
- 1Sambongi (1971) T. Sambongi, J. Phys. Soc. Jpn. 30 , 294 (1971) . · doi ↗
- 2Kushwaha et al. (2014) S. K. Kushwaha, J. W. Krizan, J. Xiong, T. Klimczuk, Q. D. Gibson, T. Liang, N. P. Ong, and R. J. Cava, Journal of Physics: Condensed Matter 26 , 212201 (2014) . · doi ↗
- 3Roberts (1976) B. W. Roberts, Journal of Physical and Chemical Reference Data 5 , 581 (1976) . · doi ↗
- 4Winiarski et al. (2016) M. J. Winiarski, B. Wiendlocha, S. Gołąb, S. K. Kushwaha, P. Wiśniewski, D. Kaczorowski, J. D. Thompson, R. J. Cava, and T. Klimczuk, Phys. Chem. Chem. Phys. 18 , 21737 (2016) . · doi ↗
- 5Matthias and Hulm (1952) B. T. Matthias and J. K. Hulm, Phys. Rev. 87 , 799 (1952) . · doi ↗
- 6Shao et al. (2016) D. F. Shao, X. Luo, W. J. Lu, L. Hu, X. D. Zhu, W. H. Song, X. B. Zhu, and Y. P. Sun, Scientific Reports 6 , 21484 (2016) . · doi ↗
- 7Kinjo et al. (2016) T. Kinjo, S. Kajino, T. Nishio, K. Kawashima, Y. Yanagi, I. Hase, T. Yanagisawa, S. Ishida, H. Kito, N. Takeshita, K. Oka, H. Eisaki, Y. Yoshida, and A. Iyo, Superconductor Science and Technology 29 , 03LT 02 (2016) .
- 8Xiang et al. (2018) L. Xiang, R. A. Ribeiro, U. S. Kaluarachchi, E. Gati, M. C. Nguyen, C.-Z. Wang, K.-M. Ho, S. L. Bud’ko, and P. C. Canfield, Phys. Rev. B 98 , 214509 (2018) .