Discovery of a giant and luminous Lya+CIV+HeII nebula at z=3.326 with extreme emission line ratios
R. Marques-Chaves, I. P\'erez-Fournon, M. Villar-Mart\'in, R. Gavazzi,, D. Riechers, D. Rigopoulou, J. Wardlow, A. Cabrera-Lavers, D. L. Clements, L., Colina, A. Cooray, D. Farrah, R. J. Ivison, C. Jim\'enez-\'Angel, P., Mart\'inez-Navajas, H. Nayyeri, S. Oliver, A. Omont

TL;DR
This paper reports the discovery of a giant, luminous Lya nebula at z=3.326 with extreme emission line ratios, likely powered by AGN activity and jet-induced shocks, revealing complex gas enrichment and feedback processes in the early universe.
Contribution
It presents the first detailed observation of a large, luminous Lya+CIV+HeII nebula with extreme line ratios, linking AGN activity and shocks to nebula energetics and composition.
Findings
Extended emission in Lya, CIV, HeII over ~100kpc
High Lya/CIV and Lya/HeII ratios exceeding standard models
Evidence of AGN-driven shocks influencing nebula properties
Abstract
We present the discovery of HLock01-LAB, a luminous and large Lya nebula at z=3.326. Medium-band imaging and long-slit spectroscopic observations with the Gran Telescopio Canarias reveal extended emission in the Lya 1215\AA, CIV1550\AA, and HeII 1640\AA lines over ~100kpc, and a total luminosity L(Lya)=(6.4+/-0.1)x10^44 erg s^-1. HLock01-LAB presents an elongated morphology aligned with two faint radio sources contained within the central ~8kpc of the nebula. The radio structures are consistent to be faint radio jets or lobes of a central galaxy, whose spectrum shows nebular emission characteristic of a type-II active galactic nucleus (AGN). The continuum emission of the AGN at short wavelengths is, however, likely dominated by stellar emission of the host galaxy, for which we derive a stellar mass M* = 2.3x10^11 Msun. The detection of extended emission in CIV and CIII] indicates that…
Click any figure to enlarge with its caption.
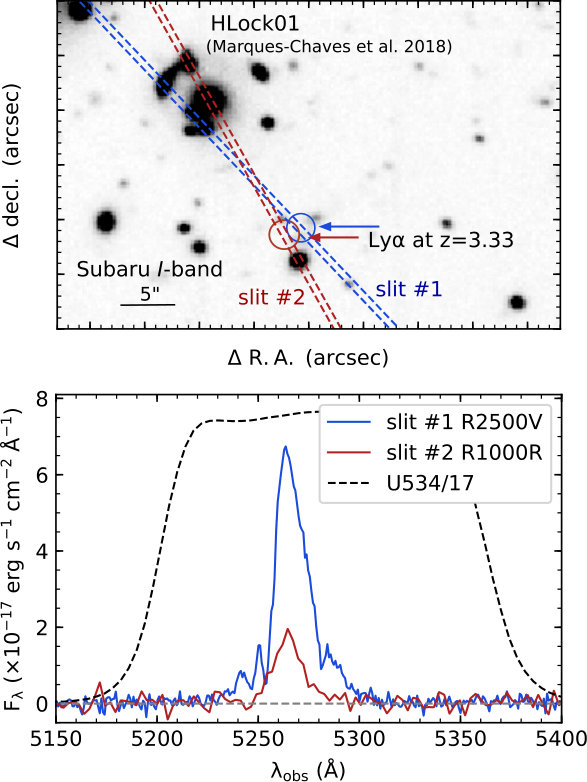 Figure 1
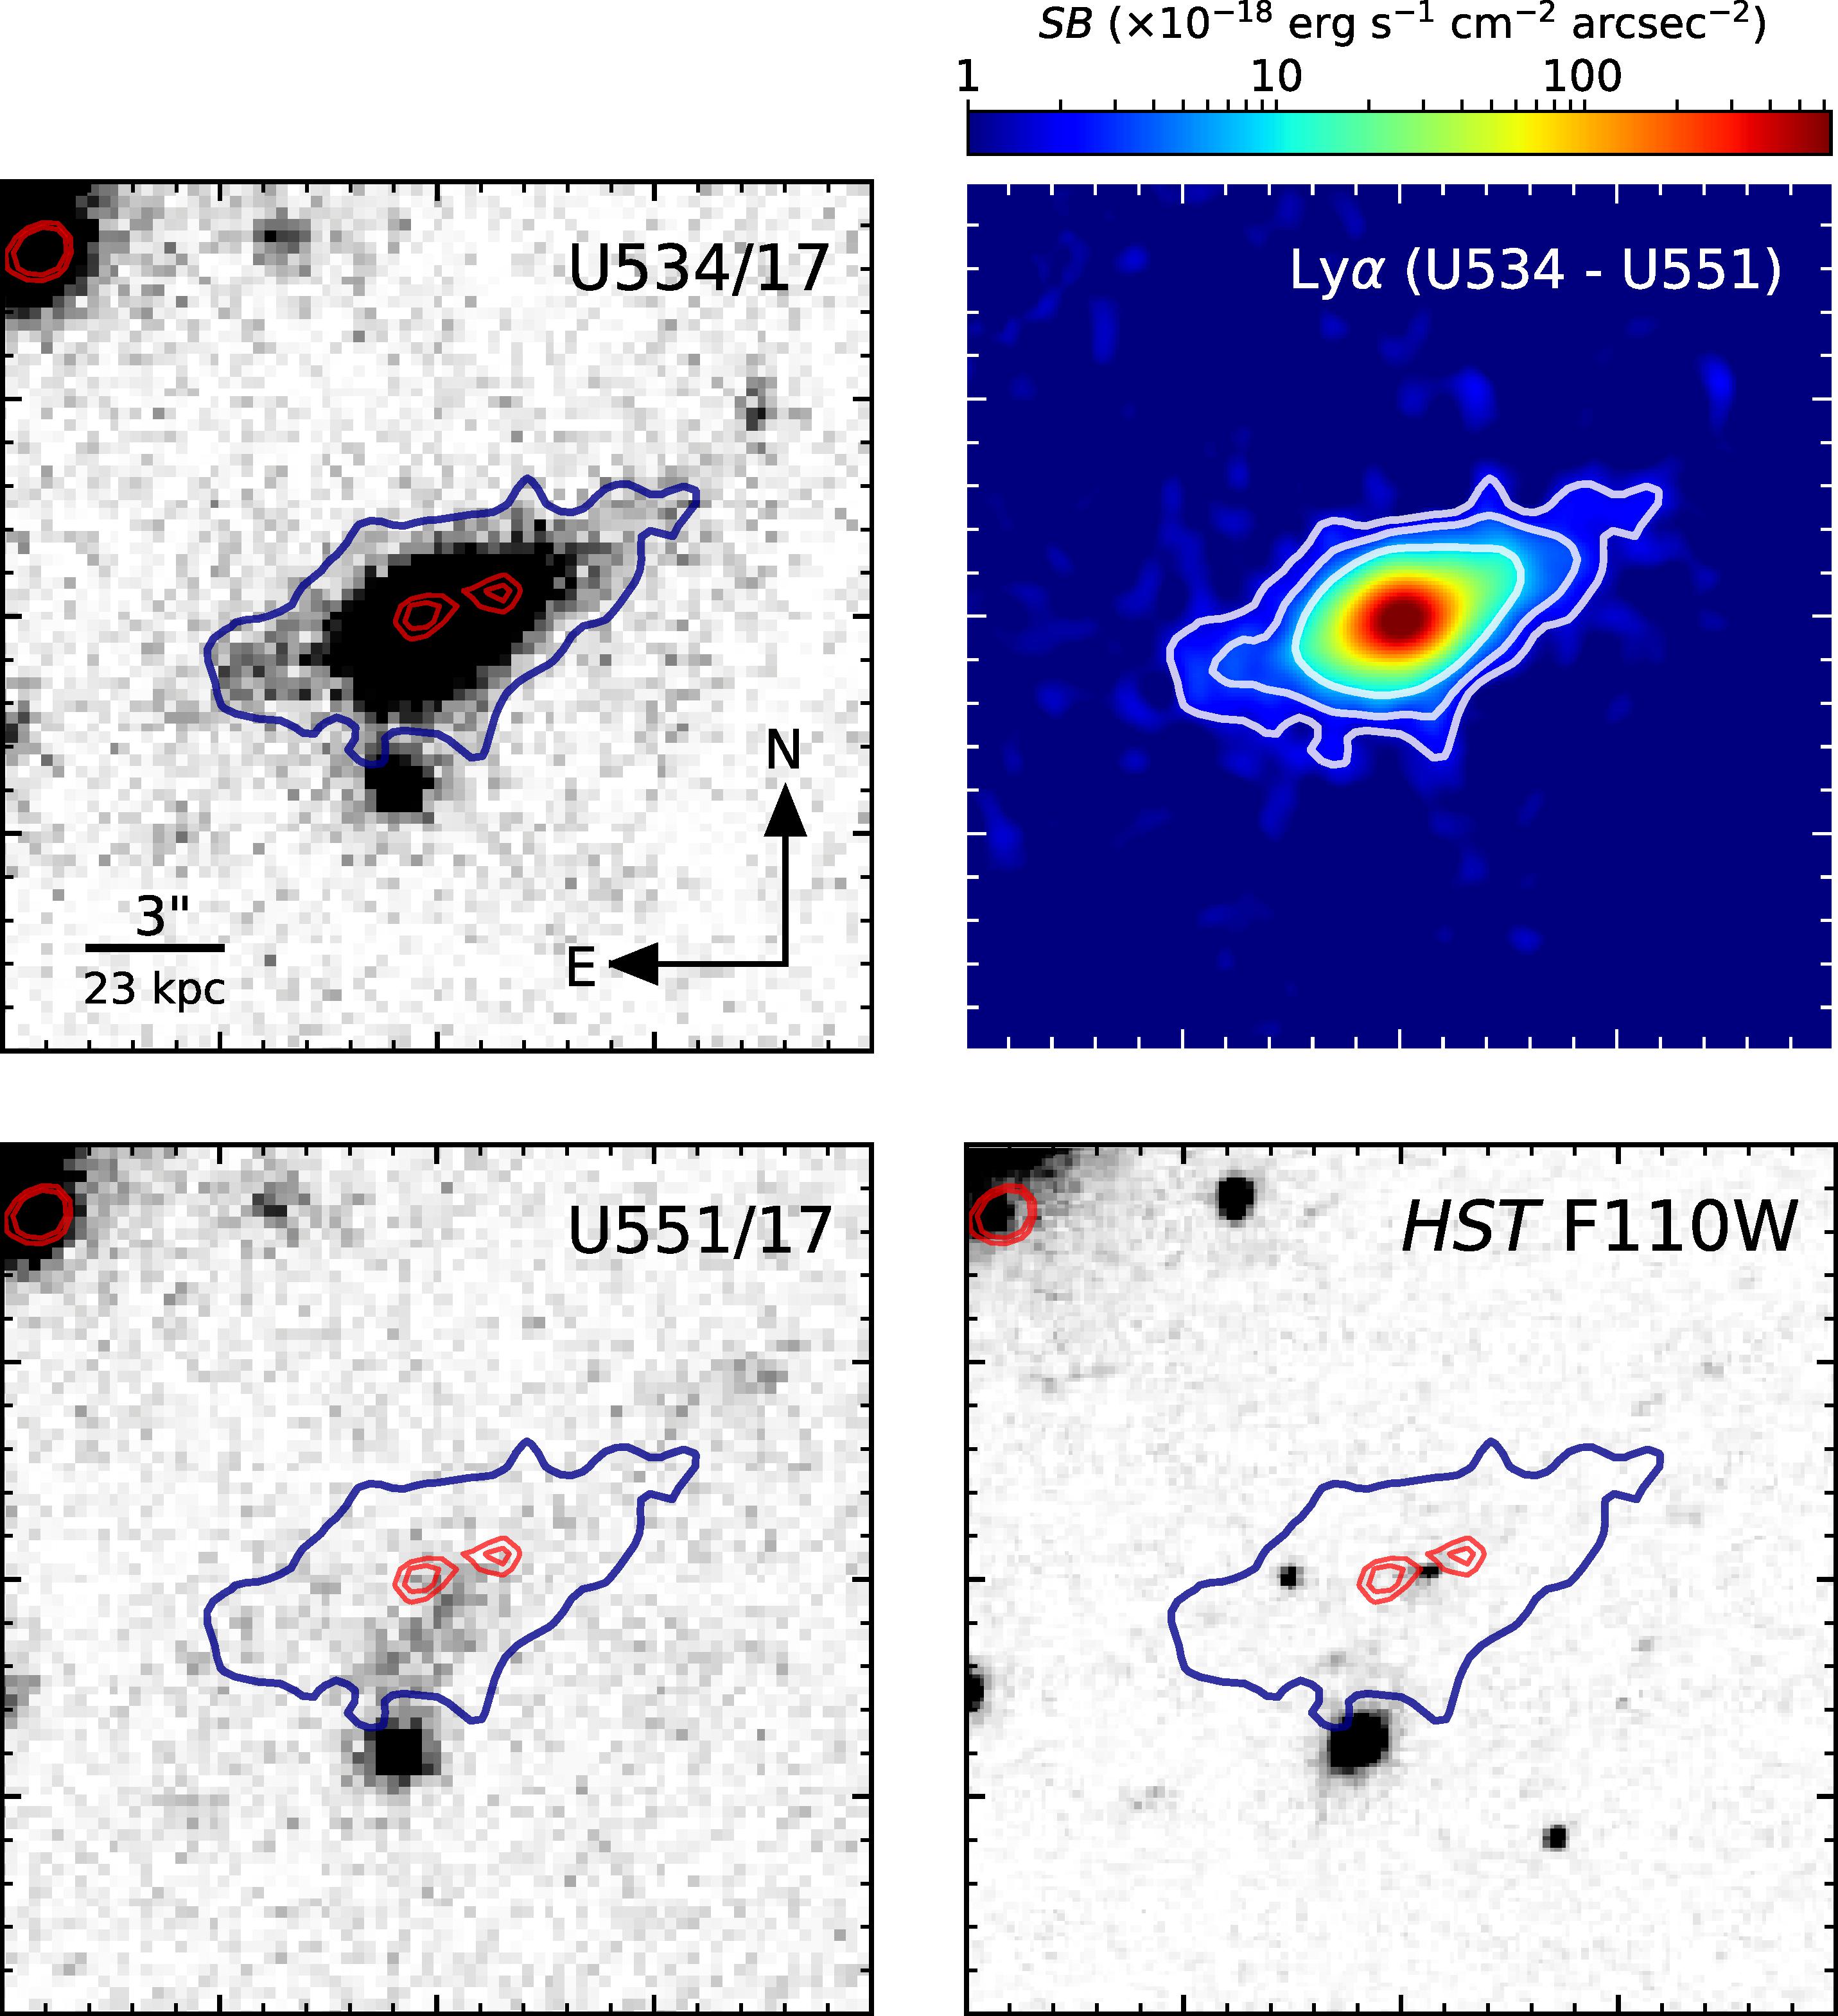 Figure 2
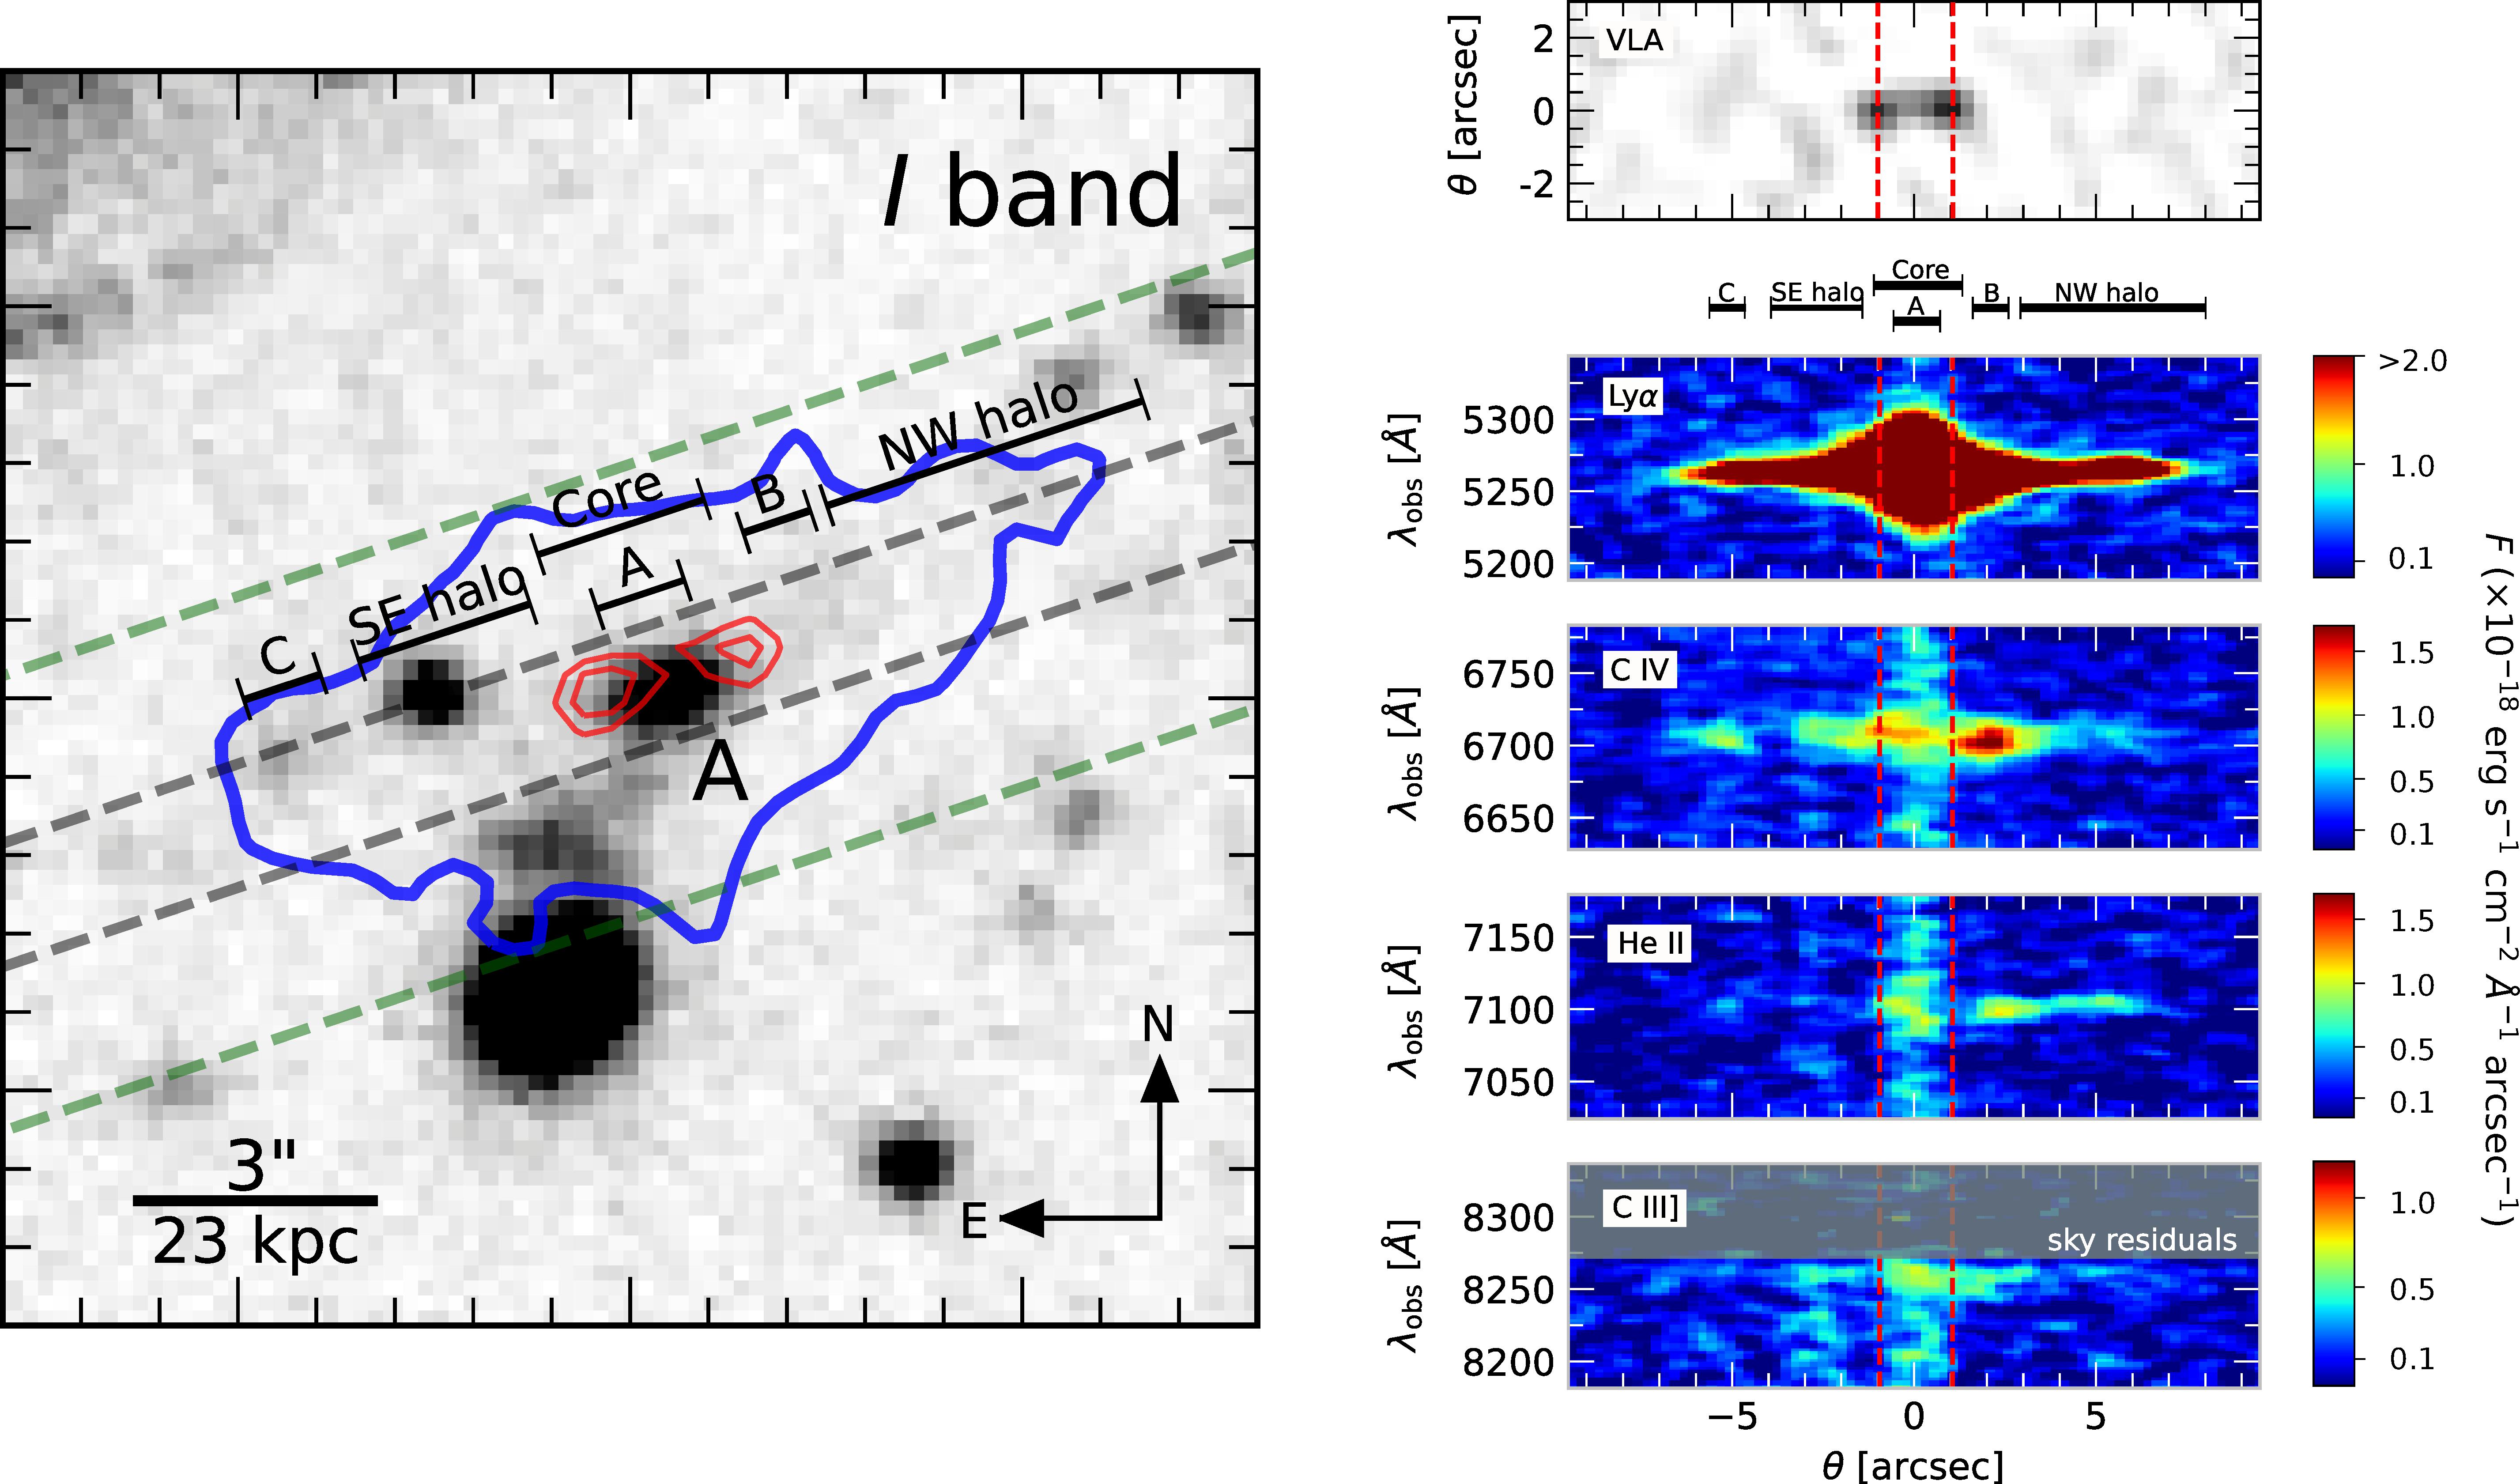 Figure 3
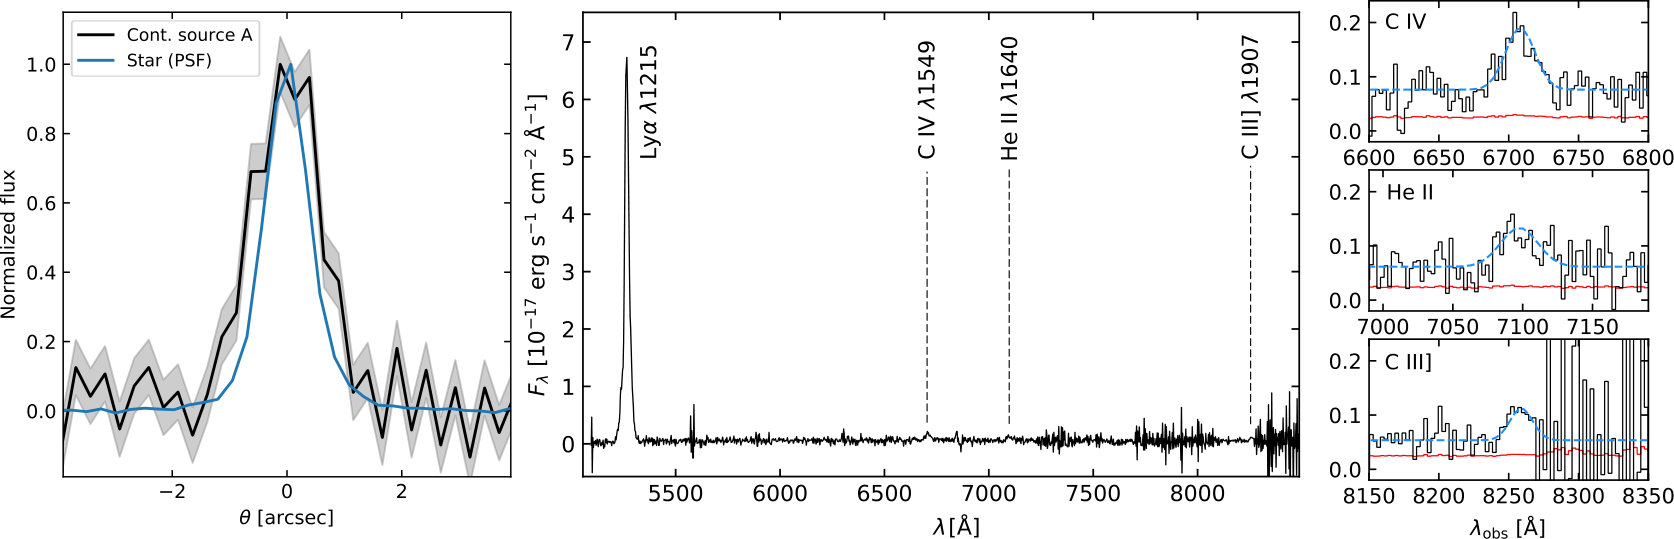 Figure 4
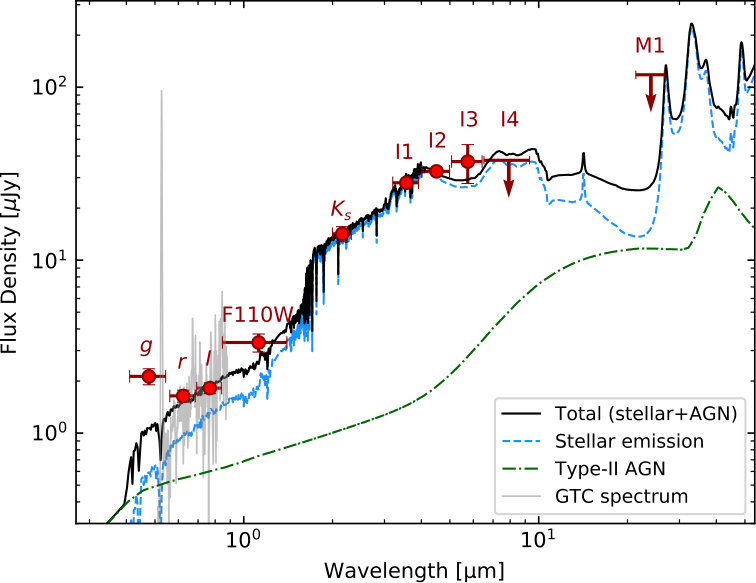 Figure 5
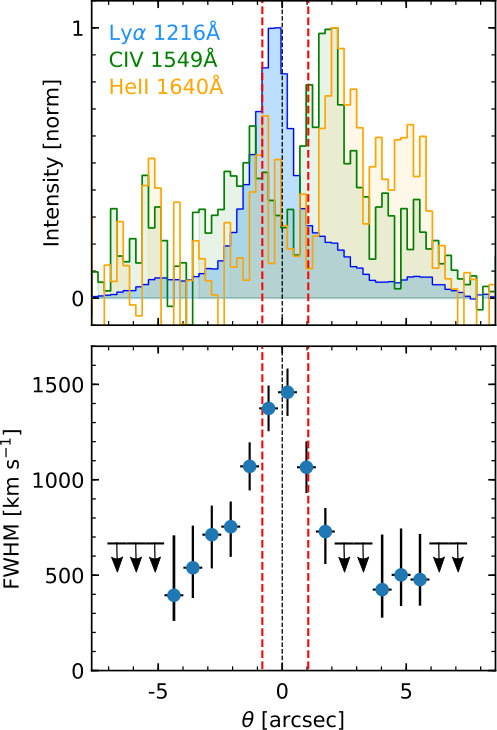 Figure 6
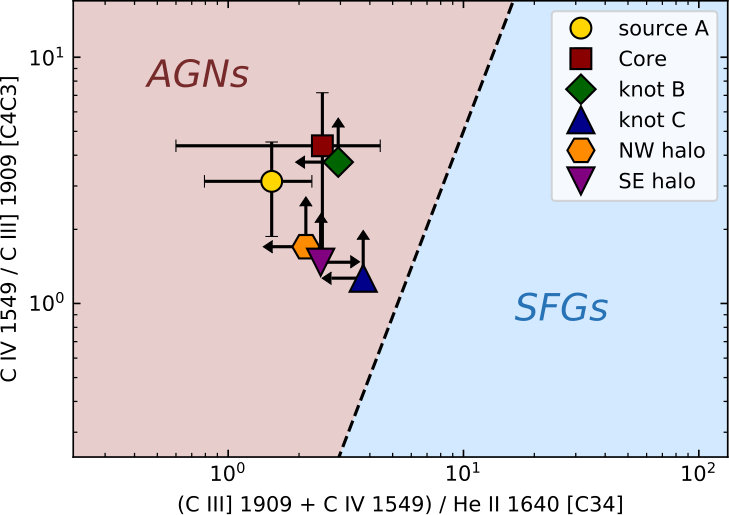 Figure 7
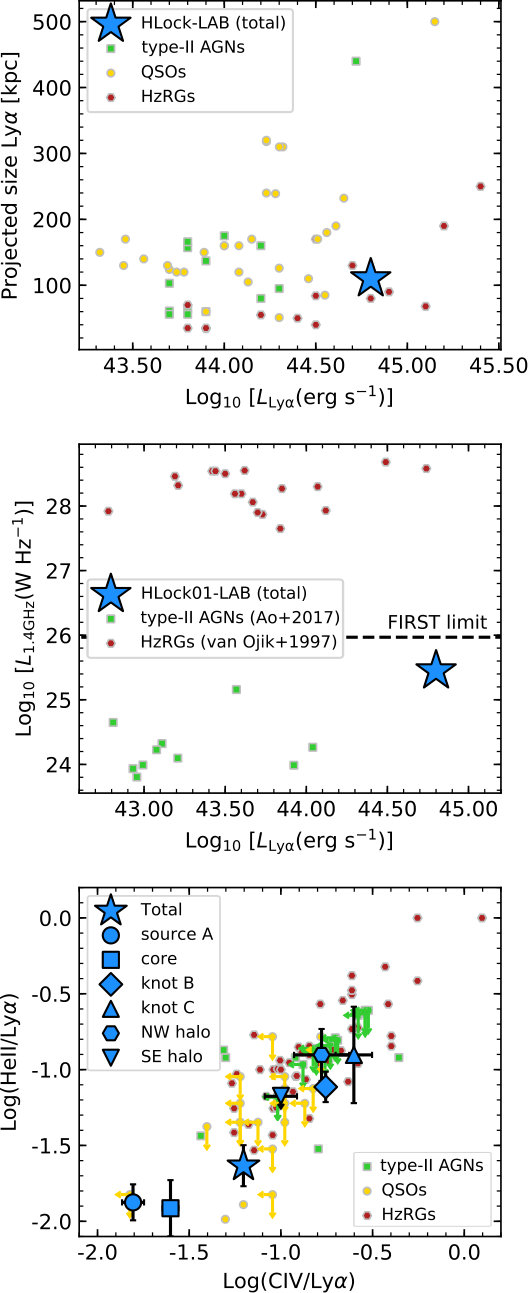 Figure 8
| Telescope/Band | Flux | |
|---|---|---|
| (m) | (Jy) | |
| GTC/-band | 0.48 | |
| CFHT/-band | 0.62 | |
| Subaru/-band | 0.77 | |
| HST/F110W | 1.12 | |
| WHT/ | 2.16 | |
| Spitzer/IRAC I1 | 3.6 | |
| Spitzer/IRAC I2 | 4.5 | |
| Spitzer/IRAC I3 | 5.8 | |
| Spitzer/IRAC I4 | 8.0 | () |
| Spitzer/MIPS M1 | 24.0 | () |
| SMA | 880 | () |
| CARMA | 3300 | () |
| VLA 1.4 GHz | 214000 |
| Region | Aperture | (Ly) | FWHM (Ly) | Ly/N v | Ly/C iv | Ly/He ii | Ly/C iii] | C iv/ He ii |
|---|---|---|---|---|---|---|---|---|
| (′′) | ( erg s-1 cm-2) | (km s-1) | ||||||
| Source “A” | ||||||||
| Core | ||||||||
| knot “B” | ||||||||
| knot “C” | ||||||||
| NW halo | ||||||||
| SE halo | ||||||||
| Total |
| Value | Uncertainty | Unit | |
|---|---|---|---|
| R.A.a) | 10:57:49.74 | J2000 | |
| Dec.a) | +57:30:15.0 | J2000 | |
| — | |||
| Extensionb) | — | kpc | |
| erg s-1 | |||
| — | |||
| W Hz-1 | |||
Peer Reviews
No public reviews on file for this paper yet. If you reviewed it on a platform where reviews are public (OpenReview, ICLR, NeurIPS, ICML), you can paste yours below so the community can read it here.
Videos
No videos yet. Explain this paper in a talk, walkthrough, or lecture? Add one.
11institutetext: 1 Instituto de Astrofísica de Canarias, C/Vía Láctea, s/n, E-38205 San Cristóbal de La Laguna, Tenerife, Spain
2 Centro de Astrobiología (CSIC-INTA), Carretera de Ajalvir, 28850 Torrejón de Ardoz, Madrid, Spain
3 Universidad de La Laguna, Dpto. Astrofísica, E-38206 San Cristóbal de La Laguna, Tenerife, Spain
4 Institut d’Astrophysique de Paris, UMR7095 CNRS & Sorbonne Université (UPMC), F-75014 Paris, France
5 Astronomy Department, Cornell University, Ithaca, NY 14853, USA
6 Astrophysics, Department of Physics, University of Oxford, Keble Road, Oxford, OX1 3RH, UK
7 Department of Physics, Lancaster University, Lancaster, LA1 4YB, UK
8 GRANTECAN, Cuesta de San José s/n, E-38712, Breña Baja, La Palma, Spain
9 Astrophysics Group, Imperial College London, Blackett Laboratory, Prince Consort Road, London SW7 2AZ, UK
10 Department of Physics and Astronomy, University of California, Irvine, CA 92697, USA
11 Department of Physics and Astronomy, University of Hawaii, 2505 Correa Road, Honolulu, HI 96822, USA
12 Institute for Astronomy, 2680 Woodlawn Drive, University of Hawaii, Honolulu, HI 96822, USA
13 European Southern Observatory, Karl-Schwarzschild-Str. 2, D-85748 Garching, Germany
14 Institute for Astronomy, University of Edinburgh, Royal Observatory, Blackford Hill, Edinburgh EH9 3HJ, UK
15 Astronomy Centre, Department of Physics and Astronomy, University of Sussex, Brighton BN1 9QH, UK
16 Department of Physics and Astronomy, University of British Columbia, 6224 Agricultural Road, Vancouver, BC V6T 1Z1, Canada
17 Institute of Astronomy, University of Cambridge, Madingley Road, Cambridge CB3 0HA, UK
Discovery of a giant and luminous Ly+Civ+Heii nebula at with extreme emission line ratios
R. Marques-Chaves, email: [email protected]
I. Pérez-Fournon 1133
M. Villar-Martín 22
R. Gavazzi 44
D. Riechers 55
D. Rigopoulou 66
J. Wardlow 77
A. Cabrera-Lavers 1188
D. L. Clements 99
L. Colina 22
A. Cooray 1010
D. Farrah 1111 12 12
R. J. Ivison 1313 14 14
C. Jiménez-Ángel 1133
P. Martínez-Navajas 1133
H. Nayyeri 1010
S. Oliver 1515
A. Omont 44
D. Scott 1616
Y. Shu 1717
(Received:; accepted:)
We present the discovery of HLock01-LAB, a luminous and large Ly nebula at . Medium-band imaging and long-slit spectroscopic observations with the Gran Telescopio Canarias reveal extended emission in the Ly 1215Å, C iv 1550Å, and He ii 1640Å lines over kpc, and a total luminosity erg s*-1*. HLock01-LAB presents an elongated morphology aligned with two faint radio sources contained within the central kpc of the nebula. The radio structures are consistent to be faint radio jets or lobes of a central galaxy, whose spectrum shows nebular emission characteristic of a type-II active galactic nucleus (AGN). The continuum emission of the AGN at short wavelengths is, however, likely dominated by stellar emission of the host galaxy, for which we derive a stellar mass M*⊙*. Our kinematic analysis shows that the ionized gas is perturbed almost exclusively in the inner region between the radio structures, probably as a consequence of jet-gas interactions, whereas in the outer regions the ionized gas appears more quiescent. The detection of extended emission in C iv and C iii] indicates that the gas within the nebula is not primordial. Feedback may have enriched the halo at at least 50 kpc from the nuclear region. Using rest-frame UV emission-line diagnostics, we find that the gas in the nebula is likely heated by the AGN. Nevertheless, at the center of the nebula we find extreme emission line ratios of Ly/Civ and Ly/Heii , one of the highest values measured to date, and well above the standard values of photoionization models (Ly/Heii for case B photoionization). Our data suggest that jet-induced shocks are likely responsible for the increase of the electron temperature and, thus, the observed Ly enhancement in the center of the nebula. This scenario is further supported by the presence of radio structures and perturbed kinematics in this region. The large Ly luminosity in HLock01-LAB is likely due to a combination of AGN photoionization and jet-induced shocks, highlighting the diversity of sources of energy powering Ly nebulae. Future follow-up observations of HLock01-LAB will help in revealing in more detail the excitation conditions of the gas induced by jets and investigate the underlying cooling and feedback processes in this unique object.
Key Words.:
**galaxies: formation – galaxies: high-redshift – intergalactic medium **
1 Introduction
Extended regions of Ly emission were initially discovered around high redshift powerful radio sources (Chambers et al., 1990; Heckman et al., 1991a, b). Later on, dedicated narrow-band imaging surveys have discovered similar Ly nebulae in overdense regions with no clear association to radio galaxies, also called as Ly blobs (LABs, e.g., Francis et al., 1996; Fynbo et al., 1999; Keel et al., 1999; Steidel et al., 2000).
These spectacular objects are characterized by large Ly luminosities ( erg s*-1*) with sizes of up to hundreds kpc (e.g., Matsuda et al., 2004) or more (Cantalupo et al., 2014; Arrigoni Battaia et al., 2018; Cai et al., 2018; Arrigoni Battaia et al., 2019). Ly nebulae have been found associated with a diverse population of galaxies, from powerful high- radio galaxies (HzRGs; e.g., Chambers et al., 1990; Kurk et al., 2002; Reuland et al., 2003; Villar-Martín et al., 2003; Venemans et al., 2007; Villar-Martín et al., 2007a), quasi stellar objects (QSOs; e.g., Heckman et al., 1991a, b; Bunker et al., 2003; Weidinger et al., 2004; Christensen et al., 2006; Cantalupo et al., 2014; Borisova et al., 2016; Arrigoni Battaia et al., 2018), Lyman-break galaxies (LBGs; e.g., Matsuda et al., 2004), and sub-millimetre galaxies (SMGs; e.g., Ivison et al., 1998; Chapman et al., 2001; Geach et al., 2005; Matsuda et al., 2007; Geach et al., 2014; Oteo et al., 2018; Li et al., 2019). Many others have been found without any clear galactic counterpart (e.g., Nilsson et al., 2006), although deep data have revealed that the majority of them are associated with highly obscured active galactic nuclei (type-II AGNs; e.g., Dey et al., 2005; Geach et al., 2009; Bridge et al., 2013; Overzier et al., 2013; Hennawi et al., 2015; Ao et al., 2017). These extended regions of Ly emission are expected to occupy the densest dark matter regions of the Universe, tracing large-scale mass overdensities (e.g., Steidel et al., 2000; Matsuda et al., 2004; Prescott et al., 2008; Saito et al., 2015; Cai et al., 2017).
There are several possible explanations for the origin of circumgalactic Ly emission. These include the photoinization radiation from strong ultra-violet (UV) ionizing sources (e.g., Cantalupo et al., 2005; Geach et al., 2009; Kollmeier et al., 2010), radiation from shock-heated gas powered by relativistic winds or jets (e.g. Taniguchi & Shioya, 2000; Allen et al., 2008), resonant scattering of Ly (e.g., Villar-Martin et al., 1996; Hayes et al., 2011; Cantalupo et al., 2014), or cooling radiation when the gas falls towards galaxies (e.g., Fardal et al., 2001; Dijkstra & Loeb, 2009). However, investigating the physical process powering the emission in these Ly nebulae is challenging, in particular if only the Ly line is available.
Although typically less luminous than Ly, the detection of other UV emission lines, such as N v 1238,1240Å, C iv 1548,1550Å, He ii 1640Å, or C iii] 1906,1908Å (hereafter N v, C iv, He ii, and C iii], respectively) among others, may provide us key information on the properties of the gas and can help in disentangle the main physical process powering these nebulae (e.g., Villar-Martín et al., 1997; Villar-Martín et al., 2007a; Arrigoni Battaia et al., 2015a, b; Feltre et al., 2016; Nakajima et al., 2018b; Humphrey et al., 2019). For example, He ii is a non-resonant (and recombination) line and it is possible to test whether or not Ly photons are being resonantly scattered, by comparing the morphology and kinematics of both He ii and Ly extended emission. In addition, the C iii] and C iv metallic lines are useful to constrain the size at which the halo is metal-enriched, and to investigate the intensity and hardness of the ionizing sources. Extended emission in these lines have been detected on scales up to kpc in some HzRGs, showing relatively high surface brightness with perturbed kinematics (full width at half maximum km s*-1*) confined by (and aligned with) the radio structures, as further evidence for jet-gas interactions (e.g., Villar-Martín et al., 2003; Humphrey et al., 2006; Morais et al., 2017). However, these lines appear to be very faint and difficult to observe in Ly nebulae associated with sources other than HzRGs (e.g., Arrigoni Battaia et al., 2015b; Borisova et al., 2016), with only a few detections reported so far (e.g., Dey et al., 2005; Prescott et al., 2009, 2013; Caminha et al., 2016; Cai et al., 2017; Cantalupo et al., 2019; Marino et al., 2019).
In this paper, we present the discovery and first characterization of the observed emission line properties and the interpretation using photoionization and shock models of a new Ly nebula at , nicknamed “HLock01-LAB” hereafter. The nebula is powered by a central AGN with two faint and compact radio structures, yet it is one of the most luminous Ly nebulae known, in contrast with the general idea that Ly halos around powerful HzRGs show statistically larger Ly luminosities with respect to fainter HzRGs (e.g., Heckman et al., 1991a; Miley et al., 2006; Saxena et al., 2019). HLock01-LAB shows extended emission over kpc in the Ly, C iv, and He ii lines, and presents one of the highest values of Ly/C iv and Ly/He ii measured to date. It is located close in projection (), but physically unrelated to the strong gravitationally lensed Herschel galaxy HLock01 at already discussed in several works (Conley et al., 2011; Riechers et al., 2011; Gavazzi et al., 2011; Scott et al., 2011; Bussmann et al., 2013; Calanog et al., 2014; Marques-Chaves et al., 2018; Rigopoulou et al., 2018).
The paper is structured as follows. The discovery and follow-up observations are presented in Section 2. The analysis and discussion of imaging and spectroscopic data are presented in Section 3. In Section 4 we compare the properties of HLock01-LAB with those from other Ly nebulae, and, finally, in Section 5 we present the summary of our main findings. Throughout this work, a cosmology with , , and km s*-1* Mpc*-1* is adopted. At , corresponds to kpc. All quoted magnitudes are in the AB system.
2 Discovery and Follow-up Observations
2.1 Serendipitous discovery
In Marques-Chaves et al. (2018) we reported the serendipitous detection of a bright asymmetric line at Å close to the strong gravitational lensed system HLock01 (), consistent with Ly emission at . The Ly line was detected in different spatial positions SW from HLock01 (see Figure 1) in two long-slit spectroscopic observations with the Gran Telescopio Canarias (GTC). The approximate locations of the peaks of the Ly emission found in both long-slit spectra (slit #1 and #2 in Figure 1) are spatially separated by . The total Ly flux within the two slits is erg s*-1* cm*-2*, which corresponds to a Ly luminosity of erg s*-1* at (no extinction correction has been applied). The observed Ly luminosity is much higher () than those found in typical Ly emitting galaxies (LAEs) at similar redshifts ( erg s*-1*, e.g., Ouchi et al., 2008; Sobral et al., 2017) or in other exceptionally luminous LAEs (e.g., Ouchi et al., 2009; Sobral et al., 2015, 2018; Marques-Chaves et al., 2017). All this together suggest that the Ly emission comes from a more extended region, similar to what is found in high- Ly nebulae around AGNs.
2.2 Ly imaging with medium-band SHARDS filters
To understand the origin of the Ly emission, we use the GTC Optical System for Imaging and low-Intermediate Resolution Integrated Spectroscopy instrument (OSIRIS)111http://www.gtc.iac.es/instruments/osiris/ to obtain deep imaging of the Ly emission. OSIRIS has a field of view of with a plate scale of pixel*-1*. We use the SHARDS (Pérez-González et al., 2013)222https://guaix.fis.ucm.es/~pgperez/SHARDS/ medium-band filter U534/17, centered at Å, with Å (see the transmission curve in the lower panel of Figure 1). Additional observations with the consecutive medium-band filter, U551/17 ( Å; Å), were obtained to perform the continuum subtraction. These observations were obtained in service mode in 2017 April 24 in dark conditions as part of the GTC program GTC61-17A (PI: Marques-Chaves). The total exposure time were 3000 and 3750 s for U534/17 and U551/17, respectively, split into 10 individual exposures of 300 and 375 s, respectively, adopting a dither pattern. Individual frames were reduced following standard reduction procedures using Iraf.333http://iraf.noao.edu/ These include subtraction of the bias and further correction of the flat-field using skyflats. The registration and combination of the individual images were done using Scamp (Bertin, 2006) and Swarp (Bertin, 2010). The image astrometry is determined using GAIA DR2 (Gaia Collaboration et al., 2018), yielding a rms . The seeing of both final images was FWHM. The depths of the U534/17 and U551/17 images are 25.6 and 25.4 AB (5) for point sources, respectively. As shown later in Section 3.1, the SHARDS medium-band U534/17 image probes only the highest surface brightness regions of Ly. Therefore, we will use instead the -wide long-slit spectroscopic observations to measure the total Ly flux of the nebula. Figure 2 shows SHARDS medium-band images in the region of HLock01-LAB.
2.3 Long-slit spectroscopic observations
Additional GTC/OSIRIS spectroscopic observations of HLock01-LAB were also obtained. These were carried out in service mode in 2017 May 19 under sub-arsecond seeing conditions ( FWHM). We used a -wide long slit444The seeing (FWHM 0.7*′′-0.9′′) was narrower than the slit width (1.5′′). The potential impact on the kinematic measurements will be mentioned in Section 3.3. centered on a bright reference star SE and oriented so as to encompass the brightest region of the Ly emission. The long slit was aligned along the major axis of the nebula as measured from the Ly image at a sky position angle (measured North to East, see Figure 3). The GTC grism R1000R was used, providing a spectral resolution of km s-1* within the wavelength range of Å, respectively. The total exposure time was 4650 s, split into 6 individual exposures of 760 s each. In addition, we obtained another spectrum with a wider long-slit (-wide), in an attempt to measure and calibrate the total flux of the Ly emission. As shown in the left panel of Figure 3, we do not expect considerable slit losses using the wide long-slit. The data were processed with standard Iraf tasks. Both 1D spectra were extracted and corrected for the instrumental response using observations of the standard stars G191-B2B and GD 153. Atmospheric extinction and air mass have been taken into account in this correction.
2.4 Ancillary data
Since this object lies very close to the HLock01 system, we use the ancillary data available in this field that were already discussed in other works (Conley et al., 2011; Riechers et al., 2011; Bussmann et al., 2013; Wardlow et al., 2013; Marques-Chaves et al., 2018). These consist of optical imaging from OSIRIS/GTC (-band), MEGACAM (-band) on the Canada-France-Hawaii Telescope (CFHT), Suprime-Cam (-band) on the Subaru Telescope, and near-infrared (IR) imaging from Hubble Space Telescope (HST) Wide Field Camera 3 F110W ( m), and LIRIS filter at m on the William Herschel Telescope (WHT). We also use mid-IR Spitzer IRAC and MIPS images and catalogs from the Spitzer Extragalactic Representative Volume Survey (SERVS; Mauduit et al., 2012) and the Spitzer Wide-Area InfraRed Extragalactic survey (SWIRE; Lonsdale et al., 2003). Data from the Submillimeter Array (SMA) at m and the Combined Array for Research in Millimeter-wave Astronomy (CARMA) at 3300 m are also available, but no positive flux is detected at the position of HLock01-LAB at confidence levels of 4.1 and 0.8 mJy, respectively. In addition, radio data from the Karl G. Jansky Very Large Array (VLA) at 1.4 GHz (with beamsize of and from the program ID 11A-182; PI: Ivison) are available, and two unresolved radio structures are detected within the nebula with flux densities mJy and mJy. Finally, this region has been imaged in the X-ray by Chandra with a total integration time of 4.7 ks. However, HLock01-LAB is located near the edge of the field-of-view, and it is not detected with an X-ray flux limit of erg s*-1* cm*-2* (0.5-7.0 keV), corresponding to a luminosity limit of erg s*-1* at (considering a photon index ).
3 Results and Discussion
3.1 Projected size and luminosity of the nebula
Figure 2 shows the images of HLock01-LAB in the SHARDS medium-bands filters, U534/17 and U551/17 with and 5500 Å, respectively. These images probe the Ly continuum emission and only continuum emission redward of Ly, respectively. The only source in the observed field with a significant excess in the U534/17 image is HLock01-LAB due to the strong Ly emission (see Figure 2).
The continuum subtracted Ly image is obtained by estimating and subtracting the continuum emission underlying the U534/17 filter. To do so, we use the continuum emission of HLock01-LAB in the U551/17 filter and assume conservatively a flat UV continuum slope of . Even assuming a redder UV slope (e.g., ), the differences in the continuum emission in U534/17 and U551/17 filters would be negligible ( mag), given the small spectral separation of both medium-band filters, Å. We subtracted the flux-matched images after projecting both onto a common world coordinate system. We did not match the point-spread functions (PSF) given that all data were obtained consecutively with similar seeing conditions ( FWHM). In order to accentuate the faintest levels of the extended Ly emission, we smoothed the resulting continuum-subtracted image using a Gaussian kernel with . The Ly nebula (upper right panel in Figure 2) shows an elongated morphology with an orientation of (measured North to East) and extends over (or kpc at ) within the detection limit.
The OSIRIS spectrum shows Ly emission detected over a significantly larger region, about , which at corresponds to kpc. The observed Ly extension should, however, be regarded as a lower limit, since the total throughput of OSIRIS and the R1000R grism is % at Å. The sensitivity level of the GTC spectrum in the studied spectral range is erg s*-1* cm*-2* () over a aperture, corresponding roughly to a surface brightness sensitivity flux of erg s cm*-2* arcsec*-2*. This detection limit is insufficient to detect, if present, fainter levels of the Ly surface brightness at larger scales, similar to those found over kpc around high- QSOs and type-II AGNs using very deep integral field unit spectroscopic observations (reaching much deeper flux limits, erg s*-1* cm*-2* arcsec*-2*; e.g., Arrigoni Battaia et al., 2018; Cai et al., 2018; Arrigoni Battaia et al., 2019).
In Figure 3 we show 2D GTC spectra encompassing the region of the Ly emission, as well as C iv, and He ii. C iv appears to have the same extension as Ly, although much fainter, whereas He ii emission is highly asymmetric with emission being detected preferentially on the NW side up to a similar extension as C iv and Ly (although He ii is also detected at SW of source “A”, in the spatial region labeled as “C” in Figure 3). Emission in C iii] is also detected over the central kpc of the nebula, but with very low significance (). The detection of Ly and C iv with similar extensions as He ii, at least on the NW side of the nebula, suggests that both are emitted by ionized gas and that resonant scattering plays no significant role on the observed sizes. It is also probable that extended He ii emission is also present on the SE side as well (note that He ii is barely detected in the region marked as “C” on the SE side of the nebula), but with surface brightness levels bellow our detection limits. Notice that Ly scattering is produced by neutral hydrogen, while highly ionized gas is needed to scatter C iv.
Turning to the total Ly luminosity, since the SHARDS medium-band filter only probes the highest surface brightness regions, we use the wide (, displayed with green dashed lines in Figure 3) GTC long-slit spectrum to measure the total Ly flux. Using a large aperture of along the spatial direction we measure a total Ly flux erg s*-1* cm*-2*, which at corresponds to a luminosity erg s*-1* (without any dust correction).
It is worth noting that HLock01-LAB is located close in projection ( SW) to the gravitationally lensed system HLock01 at (Conley et al., 2011; Gavazzi et al., 2011; Riechers et al., 2011). HLock01 is magnified by a group of galaxies with spectroscopic redshifts of (Marques-Chaves et al., 2018). However, at of the main deflecting galaxy (labeled as “G1” in Gavazzi et al. 2011 and Marques-Chaves et al. 2018) we do not expect a large magnification on the observable fluxes in the region of the nebula. Using the lens model presented in Marques-Chaves et al. (2018) and taking in consideration its degeneracy due to the large distance to the main deflector, we estimate an upper limit on the magnification of in the region of HLock01-LAB. Even assuming , the intrinsic (de-magnified) properties of HLock01-LAB (the corrected Ly luminosity and size would be respectively erg s*-1* and kpc) do not change the main results of this work. Furthermore, we do not expect any differential magnification that would change the emission line ratios or equivalent widths of the lines.
3.2 The central galaxy “A”
The deep Subaru -band image (1800 Å rest-frame at ) shows several faint sources ( AB) embedded in the Ly detection limit emission (Figure 3). In particular, the peak of the Ly emission lies very close (, or kpc at ), but not coincident, to the source labeled as “A” in Figure 3. Although not shown here, similar spatial offset of source “A” is seen between - and -band images likely due to the strong contribution of the Ly emission in the latter (see Figure 5). VLA 1.4 GHz data also reveal faint emission on both sides of source “A”. The symmetry of the radio components with respect to source “A” suggests that these could be radio jets or lobes associated with the galaxy “A”, although a different configuration composed of two interacting AGNs (radio sources) with some leakage rest-frame UV light (source “A”) cannot be ruled out with the available data (e.g., Ivison et al., 2007; Rujopakarn et al., 2016; Stach et al., 2019). The scenario with two radio jets associated with “A” is nevertheless favoured by the detection of relatively bright extended emission in metal lines in the nebula (e.g., C iv) with perturbed kinematics within the radio structures (see Section 3.3), similar to what is found in other HzRGs at similar redshifts (e.g., Villar-Martín et al., 2003; Humphrey et al., 2006).
Source “A” is compact, but slightly resolved in the E-W direction in the Subaru image and in the higher spatial resolution HST image. A radial profile fitting of source “A” in the HST image yields a or kpc at , after correcting it for the intrinsic PSF measured using several stars in the field. The resolved spatial structure is also evident in the GTC spectrum (see left panel of Figure 4).
3.2.1 Emission lines and systemic redshift
We extract the OSIRIS 1D spectrum of source “A” (from the -wide long slit) using a small aperture of pixels in the spatial direction (, see Figure 3). Figure 4 shows the 1D spectrum of source “A”. It shows a strong and relatively broad Ly emission with an observed flux erg s*-1* cm*-2* and a km s*-1*, after accounting for the instrumental broadening ( km s*-1*), and a very faint rest-frame UV continuum.
We detect other emission lines, including C iv, He ii, and C iii], although more weakly than the Ly line. By fitting a single Gaussian model to the line profiles, we measure fluxes of , , and erg s*-1* cm*-2*. Errors refer to uncertainties, estimated by perturbing independently 1000 times each spectra using the uncertainty of the flux of each spectral element.
Similar to Ly, C iv and He ii emission lines present relatively broad spectral profiles with and () km s*-1*, respectively (all values already corrected for the instrumental broadening). Despite the low significance of the detection (), the measured FWHMs are too broad to be consistent with systemic rotation. On the other hand, the C iii] doublet emission appears spectrally unresolved, although we note that its red emission wing is highly affected by sky-subtracted residuals (see right panel of Figure 4) making the measurement of its FWHM unreliable. Nevertheless, given the line FWHMs ( km s*-1*) and the weak continuum emission, source “A” can be classified as a type-II AGN (e.g., Zakamska et al., 2003; Alexandroff et al., 2013). See Section 3.4 for a more detailed study of the physical conditions of the ionized gas.
The redshift of source “A” is determined from the central wavelength of a Gaussian fit to the non-resonant He ii emission line. This yields the systemic redshift . The spectrum does not show emission in N v 1238,1242Å (within a limit of erg s*-1* cm*-2*) or N iv 1485Å and O iii] 1660,1666Å (within a limit of erg s*-1* cm*-2*). Note however that, according to the AGN composite spectrum of Hainline et al. (2011), the aforementioned lines are expected to be much weaker than C iv (with C iv/N v , C iv/N iv , and C iv/O iii] ). Similarly, typical high- radio galaxies also show C iv/N v , C iv/N iv , and and C iv/O iii] (Humphrey et al., 2008), and therefore consistent with the non-detection of these lines in the GTC spectrum (C iv/N v , C iv/N iv , and C iv/O iii] , for a limit).
To infer the contribution of the Ly emission associated with source “A” to the total luminosity of the nebula, we compare the normalized spatial profiles (extracted along the slit) of the total Ly emission of the nebula and the UV continuum of source “A” (using the spectral region of Å). We find that the Ly emission from source “A” contributes approximately % of the total emission of the nebula.
3.2.2 Photometry and multi-wavelength analysis
In this section we present the photometry of source “A” using the broad-band imaging data. These measurements are summarized in Table 1. We use aperture photometry in the GTC , Subaru , HST WFC3 F110W, and WHT bands. To do so, we measure the flux in an aperture with a diameter of the PSF FWHM of each image. For band, we use the photometry from the corresponding CFHT/MEGACAM catalog downloaded from the Canadian Astronomy Data Centre (CADC555http://www.cadc-ccda.hia-iha.nrc-cnrc.gc.ca/en/cfht/). For the Spitzer IRAC bands, we use the aperture photometry provided by the Spitzer Enhanced Imaging Products (SEIP) catalog666http://irsa.ipac.caltech.edu/data/SPITZER/Enhanced/SEIP/, which includes catalogs from deep imaging data in the two first IRAC bands ( and m) from the Spitzer Extragalactic Representative Volume Survey (SERVS: Mauduit et al., 2012), and shallower IRAC ( and m) and MIPS ( m) imaging from the Spitzer Wide-Area InfraRed Extragalactic survey data (SWIRE: Lonsdale et al., 2003). However, source “A” is not detected in the IRAC m and MIPS 24 m bands, which correspond to upper limits of and Jy ( confidence level), respectively.
To investigate the contribution of an AGN in the SED of source “A”, we use the multi-component SED fitting tool Sed3fit (Berta et al., 2013). This code is based in the da Cunha et al. (2008) Magphys code and employs the combination of stellar emission, dust emission from star-forming regions, and emission from a type-I/II AGN (AGN torus libraries from an updated version of the Fritz et al. 2006 models by Feltre et al. 2012; see also: Gruppioni et al. 2016; Delvecchio et al. 2017, 2018). The fit uses optical and , near-IR F110W and , and mid-IR Spitzer , , and m flux measurements, along with the detection limits of IRAC m, MIPS m, and SMA 880m images. We exclude the photometry of the GTC band in the fit, given the large contribution of the Ly emission (see Figure 5). At , H 4862Å and [O iii] 4960,5008Å are redshifted to the band. However, in this case, we do use the flux measurement in the fit, as we do not expect a large contribution of these rest-frame optical emission lines in the photometry ( mag, assuming typical line ratios of H/C iv and [O iii]/C iv found in other HzRGs Humphrey et al. (2008)).
Stellar population synthesis models of Bruzual & Charlot (2003), the Chabrier (2003) initial mass function, and an exponentially declining star formation history (i.e., ) are assumed.
The best-fit model (), shown in Figure 5, gives a small AGN contribution () to the total light emission of source “A” between 8 and 1000 (rest-frame). We derive a stellar mass of source “A” as with age , metallicity , and dust attenuation mag. Similar to the host galaxies of powerful radio sources, source “A” is extremely massive (e.g., Rocca-Volmerange et al., 2004; Seymour et al., 2007). The star formation rate is found to be yr*-1*.
On the other hand, the properties of the AGN component are much less constrained due to the lack of deep mid-IR data (see Berta et al., 2013). Nevertheless, the best-fit model gives an IR luminosity (measured from the rest-frame 8 to 1000 m) for the AGN component .
3.2.3 Far-IR and radio emission
Deep VLA 1.4 GHz data with resolution (see: Wardlow et al., 2013; Marques-Chaves et al., 2018) show faint emission on both sides of source “A” with similar intensities, suggestive of radio jets or lobes (red contours in Figures 2 and 3). The radio components show flux densities mJy and mJy for the West and East counterparts, respectively. At the position of HLock01-LAB, we do not detect any emission in the SMA 880 m image at a significance level mJy. Following Magnelli et al. (2015), we use the empirical far-IR/radio correlation to study the radio excess in HLock01-LAB. The parameter is defined as:
[TABLE]
where is the integrated luminosity from the rest-frame 42 to 122 m, and is the rest-frame 1.4 GHz radio luminosity (we assume a radial spectral index , where ; Smolčić et al., 2017). By re-scaling the average far-IR spectral energy distribution of ALESS galaxies (da Cunha et al., 2015) to the SMA 880 m limit, we find a FIR luminosity .777This corresponds to a integrated from 8-1000m in the rest-frame, implying an upper limit of M*⊙* yr*-1* following Kennicutt (1998). Using equation 1 this yields to a , much lower than the mean value and scatter of typically found in other star-forming galaxies (e.g., Yun et al., 2001; Ivison et al., 2010). Thus, the radio exccess in HLock01-LAB clearly indicates the presence of an AGN.
3.3 Kinematics of the ionized gas
Despite the low spectral resolution of the R1000R grism, the visual inspection of the 2D spectra reveals variations on the kinematics of the gas along, and well beyond the radio structures. Figure 6 shows the spatial distribution of the normalized flux along the slit of Ly, C iv, and He ii (the continuum has been subtracted in all lines). It is worth noting that Ly emission drops sharply where both C iv and He ii reach their maximum, at approximately NW of source “A” (knot “B”).
In order to study the kinematics of the Ly emission,888The C iv and He ii extended emission presents low S/N, thus we do not investigate their kinematics. one dimensional spectra were extracted from different apertures along the slit with sizes of 3 pixels each (corresponding to ) and the Ly lines were fitted with Gaussian profiles. FWHM and velocities of Ly line are also shown in Figure 6. Values of FWHM have been corrected for the instrumental broadening ( km s*-1*).
Perturbed kinematics, i.e. km s*-1*, are detected preferentially in the inner region between the two radio components (red dashed lines in Figure 6), and reaches its maximum km s*-1* around source “A” (black dashed line). We are confident that these results are solid, and not dependent on slit effects (see Section 2.3). On one hand, the giant nebula probably fills the slit (see Figure 3), thus, the kinematics of the large scale gas beyond the radio structures is not affected by slit effects. The Ly emission associated with galaxy A is more compact, but slit effects would not affect our conclusions, since the dominant source of line broadening is kinematic, rather than instrumental. On the other hand, accounting for slit effects would result, if anything, on slightly broader lines within the radio structures (Villar-Martín et al., 2000). In addition to the perturbed kinematics, the Ly line presents also high surface brightness within the radio components ( erg s*-1* cm*-2* arcsec*-2*). Both the perturbed kinematics and the high surface brightness highly suggest a strong interaction between the radio jets or lobes and the surrounding gas, as seen in other Ly nebula around powerful HzRGs (e.g., Villar-Martín et al., 1999; Bicknell et al., 2000; Humphrey et al., 2006).
In the outer regions of the nebula the Ly line shows a narrower profile with FWHM km s*-1* (down to km s*-1* in some regions) and much lower surface brightness (few times erg s*-1* cm*-2* arcsec*-2*) than in the central region of the nebula. Such properties resemble those found in quiescent halos around HzRGs and other radio-quiet sources, that are thought to have collapsed in early phases of galaxy formation (Villar-Martín et al., 2003). The presence of heavy elements (C iv) in the outer regions of the nebula also indicates that feedback, associated either with star-formation or AGN outflows, may have enriched the halo at least 50 kpc from the nuclear region (source “A”).
Note, however, that Ly profile is sensitive to absorption by neutral hydrogen and the kinematic analysis based on this line should be treated with care. The spectral resolution of our data is insufficient to further investigate the presence of strong H i absorbers over the full spatial extent of the Ly nebula, although the higher spectral resolution data used in the analysis of HLock01 in Marques-Chaves et al. (2018) show that the blue wing of the Ly emission SW of source “A” is heavily absorbed (see Figure 1).999The red wing of the Ly emission also shows an absorption line at Å, likely associated with C ii 1334Å of the SMG HLock01 (Marques-Chaves et al., 2018). Nevertheless, this effect is not supposed to change our conclusions regarding the striking differences between the gas kinematics within (turbulent) and outside (more quiescent) the radio structures, since the extended halo is not expected to be so severely affected by absorption as the central region.
3.4 Line diagnostics in the nebula
3.4.1 AGN versus star formation
To gain insight into the physical conditions of the ionized gas traced by C iv, He ii, and C iii] nebular emission, we use rest-frame UV emission-line diagnostics to identify the source of photoionization. Following Nakajima et al. (2018b), the line ratios of C iv/C iii] (C4C3) and (C iii]C iv)/He ii (C34) can be used to distinguish star-forming galaxies from AGNs (see also Feltre et al., 2016). These photoionization models were constructed using a grid with ionizing parameter (log ) ranging from to , along with different gas properties of metallicity ( ranging from to ) and density ( cm*-3*), thus they are also valid for distant non-galaxy regions, where the gas is expected to be much more diluted.
In addition to the spectrum of source “A”, we extract 1D spectra from other regions of the nebula. These include the region encompassing the radio emission (core), the NW and SE extended regions of the nebula (NW and SE halos, respectively), and additional knots “B” and “C” where C iv and He ii fluxes are relatively large. The location and size of these apertures are shown in Figure 3, as well as in Table 2.
From the GTC spectra, we find line ratios of , (), , , , and , and ), (), , , , and for source “A”, core, knots “B” and “C”, and NW and SE halos, respectively. As shown Figure 7, these ratios suggest that the ionized gas in the nebula is powered by an AGN, likely source “A”, rather than star formation.
In addition, we also use the rest-frame equivalent widths () of C iv and C iii] combined with the line ratios of C iv/He ii and C iii]/He ii to disentangle AGN from star-formation activity as proposed by Nakajima et al. (2018a) (see also Hirschmann et al. 2019). From the spectrum of source “A” (where the continuum emission is detected) we measure and , and C iv/He ii and C iii]/He ii , indicating that the gas is excited by an AGN.
On the excitation of Ly in the outer regions of HLock01-LAB, the detection of both C iv and He ii over similar extension as Ly makes resonant scattering of Ly or cooling radiation from pristine gas unlikely scenarios (see: Arrigoni Battaia et al., 2015b).
3.4.2 Extreme Ly/Civ and Ly/Heii emission line ratios
The inner region (i.e. core and source “A”) of HLock01-LAB, encompassing the AGN and the radio structures, shows extremely large emission line ratios of Ly/Civ and Ly/Heii, up to and , respectively (see Table 2). Quasars, radio galaxies and type-II AGNs at similar redshifts show significantly lower values (Figure 8). Ly is enhanced both relative to other emission lines and in absolute terms. For comparison, HzRGs, which host more powerful AGNs, have similar Ly luminosities.
AGN photoionization models covering a broad range of gas densities, metallicities and ionization parameters predict Ly/Heii 30 (Villar-Martín et al., 2007a), unless a combination of very low metallicities ( 0.1) and low ionization parameter values (log ) are considered (see also: Humphrey et al., 2019). These models would result on C iv/He ii 1, which is inconsistent with the measured values (, see Table 2). The density in the central region is probably significantly higher than that in the very extended nebula, where the gas is expected to by much more diluted. Indeed, a broad range of densities is possible in the Narrow Line Region of AGNs ( cm*-3*, e.g., Osterbrock 1989). However, high densities cannot explain the strong Ly emission relative to other lines. Even in the most extreme case ( cm*-3*), models predict Ly/Heii (see Figure 3 in Villar-Martín et al. 2007a). On the other hand, the same models predict Ly/C iv 10 and C iv/Heii , which are in contradiction with the observed ratios in the central region of HLock01-LAB (see Table 2).
This suggests that changing the gas properties such as density or metallicity cannot explain the Ly enhancement. Instead, excitation mechanisms rather than pure AGN photoionization have to be taken into account.
The addition of stellar photoinization to the effects of the AGN would result on a softer ionizing continuum, that would enhance the Ly luminosity and its ratios relative to C iv and He ii (Villar-Martín et al., 2007a). This process, however, cannot explain HLock01-LAB. Using Kennicutt (1998) calibration, the inferred M*⊙* yr*-1* (Section 3.2.2) would result on erg s*-1* (assuming case B Ly/H=8.7, Valls-Gabaud, 1993), provided that Ly is not quenched by dust. Therefore, even in the most favourable conditions, star formation could account for less than 10% of the total line luminosity.
Ly collisional excitation is a more promising possibility. For this to happen, the electrons in the ground level of hydrogen must be excited by electrons with eV, and electron temperatures are thus necessary. The effect of collisional excitations upwards from the levels of H can have a dominant effect in astrophysical shocks (Raga et al., 2015). As explained by these authors, immediately after the shock, one has a high temperature region (of for a 100 km s*-1* shock) in which H can be partially neutral, though rapidly becoming collisionally ionized. In this region, H collisional excitations dominate over the recombinations to the excited levels (see also Raymond, 1979).
The fact that the large Ly/Civ and Ly/Heii ratios are seen only in the region encompassing the radio structures, where perturbed kinematics are also found (see Section 3.3), strongly supports that jet-induced shocks are contributing to the enhancement of Ly. To investigate this, we use the shock models presented already by Arrigoni Battaia et al. (2015b). These models are based on libraries of radiative shock models using the code MAPPINGS III (Allen et al., 2008),101010http://cdsweb.u-strasbg.fr/~allen/mappings_page1.html and assume solar metallicity gas, a magnetic parameter G, and a grid with gas densities from 0.01 to 100 cm*-3* and shock velocities from 100 to 1000 km s*-1*. The ionizing flux strongly depends on the shock velocity (), yielding to gas temperatures as high as (see Allen et al., 2008). Values of Ly/Civ and Ly/Heii can be reached in models with shock velocities of km s*-1* and densities cm*-3* (see Figure 13 of Arrigoni Battaia et al., 2015b). Shock models can also explain the high C iv/C iii] observed within the radio structures.
Therefore, shock-heating induced by the radio jets is a natural explanation for the enhanced Ly emission in the inner region of HLock01-LAB. Deep integral field spectroscopy would be very valuable to investigate this scenario in more depth, by mapping the kinematic, ionization and morphological properties of HLock01-LAB in two spatial dimensions. This study will be presented in a future paper.
4 Comparison with other Ly nebulae
In this section we compare the properties of HLock01-LAB with those from other Ly nebulae. A summary of the properties of HLock01-LAB is presented in Table 3.
HLock01-LAB has a total Ly luminosity erg s*-1* extended over kpc. Even considering a possible lensing magnification () from the group of galaxies at SW, HLock01-LAB is one of the most luminous nebulae know at high redshift. In Figure 8 we compare the maximum projected size of Ly emission and the total luminosity of HLock01-LAB with a compilation of other giant Ly nebulae associated with QSOs (Cantalupo et al., 2014; Hennawi et al., 2015; Borisova et al., 2016; Cai et al., 2018; Arrigoni Battaia et al., 2018), HzRGs (van Ojik et al., 1997; Reuland et al., 2003; Villar-Martín et al., 2003; Villar-Martín et al., 2007b; Venemans et al., 2007), and type-II AGNs (Overzier et al., 2013; Ao et al., 2017; Cai et al., 2017). Ly halos around powerful radio-galaxies show statistically larger Ly luminosity and broader kinematics with respect to other radio-quiet systems (e.g., Heckman et al., 1991a; Miley et al., 2006).
As discussed already in Section 3, HLock01-LAB shares several of its properties with those found in other HzRGs at similar redshifts. The Ly morphology probed by the medium-band SHARDS image is apparently aligned with the radio axis, and the gas within the radio structures shows higher surface brightness and very perturbed kinematics. Such properties have been also found in other powerful HzRGs (e.g., McCarthy et al., 1987, 1995; Villar-Martín et al., 2003; Villar-Martín et al., 2007b; Morais et al., 2017), and have been interpreted as further evidence of the jet-gas interaction that distorts the morphological and kinematic properties of the surrounding gas (e.g., Villar-Martín et al., 1999; Bicknell et al., 2000; Humphrey et al., 2006). However, despite the general similarities between HLock01-LAB and other giant and luminous Ly nebulae around powerful HzRGs, there are striking differences that should be discussed.
First of all, the radio emission seen in HLock01-LAB is much weaker (total flux density mJy) than those found in other HzRGs at similar redshifts, showing typically very strong radio emission with flux densities up to hundreds of mJy or more (e.g., Roettgering et al., 1994; van Ojik et al., 1997; De Breuck et al., 2000, 2004). Figure 8 shows the relation between the total radio power and Ly luminosity of nebulae associated with HzRGs (van Ojik et al., 1997) and type-II AGNs (Ao et al., 2017). The radio luminosity of HLock01-LAB is much weaker, more than two orders of magnitude, than in HzRGs harboring luminous nebula. In fact, HLock01-LAB is not detected in the Faint Images of the Radio Sky at Twenty-cm (FIRST) radio catalog (flux density limit of mJy; Becker et al., 1995), highlighting the importance of deep radio data in characterizing the physical mechanisms that power Ly nebulae (e.g., Ao et al., 2017).
Secondly, extended Ly emission has been found beyond the radio structures in some HzRGs (e.g., van Ojik et al., 1997; Maxfield et al., 2002; Villar-Martín et al., 2002, 2003; Humphrey et al., 2008), although the relative extension of the ionized gas and the extremities of the radio structures rarely exceeds a factor of two (with some exceptions e.g., 0943-242 in Villar-Martín et al. 2003, or TN J1338-1942 in Swinbank et al. 2015). In the case of HLock01-LAB, the Ly emission extends over kpc, whereas the radio components are contained within the central kpc. Extended emission in metal lines, such as C iv (and C iii]), is also detected well beyond the radio structures suggesting that the material within the nebula is not primordial. Despite the low surface brightness limit of our VLA radio data, the detection of metal lines well beyond the radio structures may indicate that the AGN activity (as well as the radio jets) had to be more intense in the past than what we observe today.
Lastly, the emission line ratios of Ly/Civ and Ly/Heii seen in the inner region of HLock01-LAB (up to and , respectively) are one of the highest values measured to date (see also Borisova et al. 2016, Arrigoni Battaia et al. 2018, Shibuya et al. 2018, Cantalupo et al. 2019, and Marino et al. 2019), and are much larger than those found in other nebulae around HzRGs (showing typically Ly/Civ and Ly/Heii around 10, e.g.,: Villar-Martín et al., 2007a, see lower panel of Figure 8). As shown in Section 3.4.2, jet-induced shocks can explain relatively well the observed large ratios, further supported by the presence in this region of radio structures and gas with perturbed kinematics. However, it is still unclear why such large ratios are not seen also in other powerful HzRGs with clear signs of jet-gas interactions. A diversity of explanations may apply. Both increasing shock velocities and gas densities result in higher Ly ratios relative to other emission lines (Allen et al., 2008; Arrigoni Battaia et al., 2015b). The radio source in HLock01-LAB is relatively small in comparison with other HzRGs, where sizes larger than few 10s of kpc are commonly observed. In these systems, the decelerated radio source may induce slower shocks that, in addition, propagate in a highly diluted medium well outside the host galaxy. In comparison, the shocks in HLock01-LAB may be propagating through the relatively dense ISM within and near the galaxy. Another relevant aspect is that Ly is often strongly absorbed in HzRGs, especially in systems with strong signs of jet-gas interactions (van Ojik et al., 1996). As these authors proposed, this could be a consequence of the rich cluster environment they lie in. Although absorption is also present in HLock01-LAB (see Figure 1 or Marques-Chaves et al., 2018), the main effect on the Ly profile is to distort the shape of the blue wing although not diminishing its flux noticeably.
5 Summary and Conclusions
This paper has presented the discovery and first analysis of a luminous Ly nebula at . HLock01-LAB was discovered close in projection ( SW), but physically unrelated, to the gravitationally lensed system HLock01 at . We have used OSIRIS on the GTC to image the Ly emission with SHARDS medium-band filters and secure a rest-frame UV spectrum of the nebula, covering several UV emission lines, such as Ly, C iv, He ii, and C iii]. From the analysis of these data together with other existing observations covering a wide spectral range, we arrive at the following main results:
HLock01-LAB has a total Ly luminosity erg s*-1*, being one of the most luminous nebulae at high redshift. The nebula presents an elongated morphology and extends over kpc. Emission in C iv and He ii are also detected over a similar extension, but at much fainter flux levels. 2. 2.
The peak of the Ly emission lies very close ( kpc) to a central and compact galaxy (source “A”) whose spectrum shows C iv, He ii, and C iii] nebular emission characteristic of a type-II AGN. We used the non-resonant He ii line to derive the systemic redshift . 3. 3.
Two faint radio sources are seen on both sides of the central galaxy with a projected separation of kpc. The non detection of a far-IR counterpart yields a radio excess , much lower than those values measured in star-forming galaxies. This implies that the radio emission is due to the AGN, rather than star formation. Nevertheless, the continuum emission at short wavelengths, from optical to 5.8 m, is likely dominated by stellar emission of the host galaxy, for which we derive a stellar mass M*⊙*. 4. 4.
The ionized gas shows perturbed kinematics almost exclusively in the inner region between the radio structures, with km s*-1*, likely as a consequence of jet-gas interactions. In the outer regions of the nebula, the ionized gas presents more quiescent kinematics with line FWHM km s*-1*. 5. 5.
Our data suggest jet-induced shocks, additional to AGN photoionization, as powering mechanisms of the Ly emission. For the whole nebula, line ratios using C iv, He ii, and C iii] emission lines show that the gas is being photoionized by the type-II AGN. However, at the center of the nebula we find extreme line ratios of Ly/Civ and Ly/Heii , one of the highest values measured to date, and well above the standard values of photoionization models. Jet-induced shocks are likely responsible for the Ly enhancement in the center of the nebula, further supported by the presence of radio structures and perturbed kinematics in this region.
In summary, many of the properties of HLock01-LAB are broadly similar to those found in other nebulae around powerful HzRGs, yet many others have been not seen before. In particular, the large Ly/Civ and Ly/Heii emission line ratios observed in the inner region of HLock01-LAB, likely as a consequence of the increase of the electronic temperature from jet-induced shocks, have not been seen before in any other nebula with observational evidence of jet-gas interactions, such as those frequently associated with high redshift radio galaxies. HLock01-LAB offers, therefore, the opportunity to investigate the excitation conditions of the gas due to high-speed shocks and the underlying cooling and feedback processes. Deep and high-spectral resolution integral field spectroscopy are needed to investigate in much more detail the kinematic, ionization and morphological properties of HLock01-LAB.
Acknowledgements.
We would like to thank the anonymous referee for their suggestions which significantly improved the clarity of this paper. Based on observations made with the Gran Telescopio Canarias (GTC) and with the William Herschel Telescope (WHT), installed in the Spanish Observatorio del Roque de los Muchachos of the Instituto de Astrofísica de Canarias, in the island of La Palma. We thank the GTC and WHT staff for their help with the observations. R.M.C. would like to thank Claudio Dalla Vecchia, Pablo Pérez-González, and Rosa González-Delgado for useful discussions. R.M.C. acknowledges Fundación La Caixa for the financial support received in the form of a Ph.D. contract. R.M.C., I.P.F., L.C., P.M.N., and C.J.A. acknowledge support from the Spanish Ministerio de Ciencia, Innovación y Universidades (MICINN) under grant numbers ESP2015-65597-C4-4-R, ESP2017-86852-C4-2-R, and ESP2017-83197. D.R. acknowledges support from the National Science Foundation under grant number AST-1614213. J.L.W. acknowledges support from an STFC Ernest Rutherford Fellowship (ST/P004784/2).
The reference list from the paper itself. Each links out to its DOI / PubMed record.
- 1Alexandroff et al. (2013) Alexandroff, R., Strauss, M. A., Greene, J. E., et al. 2013, MNRAS, 435, 3306
- 2Allen et al. (2008) Allen, M. G., Groves, B. A., Dopita, M. A., Sutherland, R. S., & Kewley, L. J. 2008, Ap JS, 178, 20
- 3Ao et al. (2017) Ao, Y., Matsuda, Y., Henkel, C., et al. 2017, Ap J, 850, 178
- 4Arrigoni Battaia et al. (2015 a) Arrigoni Battaia, F., Hennawi, J. F., Prochaska, J. X., & Cantalupo, S. 2015 a, Ap J, 809, 163
- 5Arrigoni Battaia et al. (2019) Arrigoni Battaia, F., Hennawi, J. F., Prochaska, J. X., et al. 2019, MNRAS, 482, 3162
- 6Arrigoni Battaia et al. (2018) Arrigoni Battaia, F., Prochaska, J. X., Hennawi, J. F., et al. 2018, MNRAS, 473, 3907
- 7Arrigoni Battaia et al. (2015 b) Arrigoni Battaia, F., Yang, Y., Hennawi, J. F., et al. 2015 b, Ap J, 804, 26
- 8Becker et al. (1995) Becker, R. H., White, R. L., & Helfand, D. J. 1995, Ap J, 450, 559