Stress effects on vibrational spectra of a cubic hybrid perovskite: A probe of local strain
Kuntal Talit, David A. Strubbe

TL;DR
This study investigates how uniaxial strain affects vibrational spectra of methylammonium lead iodide perovskite, identifying key vibrational modes for local strain mapping to enhance understanding of strain effects on optoelectronic properties.
Contribution
The paper provides a detailed DFT analysis of strain-induced vibrational frequency shifts and calibration curves for methylammonium lead iodide, aiding local strain mapping in hybrid perovskites.
Findings
Identified vibrational modes suitable for strain mapping (86, 97, 1457, 1537 cm$^{-1}$).
Provided calibration curves linking vibrational frequency shifts to strain.
Analyzed structural changes and mode Gr"uneisen parameters related to strain effects.
Abstract
Inhomogeneous strain may develop in hybrid organic metal-halide perovskite thin films due to thermal expansion mismatch with a fabrication substrate, polycrystallinity or even light soaking. Measuring these spatially varying strains is difficult but of prime importance for understanding the effects on carrier mobility, non-radiative recombination, degradation and other optoelectronic properties. Local strain can be mapped using the shifts in vibrational frequencies using Raman or infrared microscopy. We use density functional theory to investigate the effect of uniaxial strain on the vibrations of pseudo-cubic methylammonium lead iodide (CHNHPbI), and identify the vibrational modes most favorable for local strain mapping (86 cm, 97 cm, 1457 cm, and 1537 cm) and provide calibration curves. We explain the origin of the frequency changes with strain…
Click any figure to enlarge with its caption.
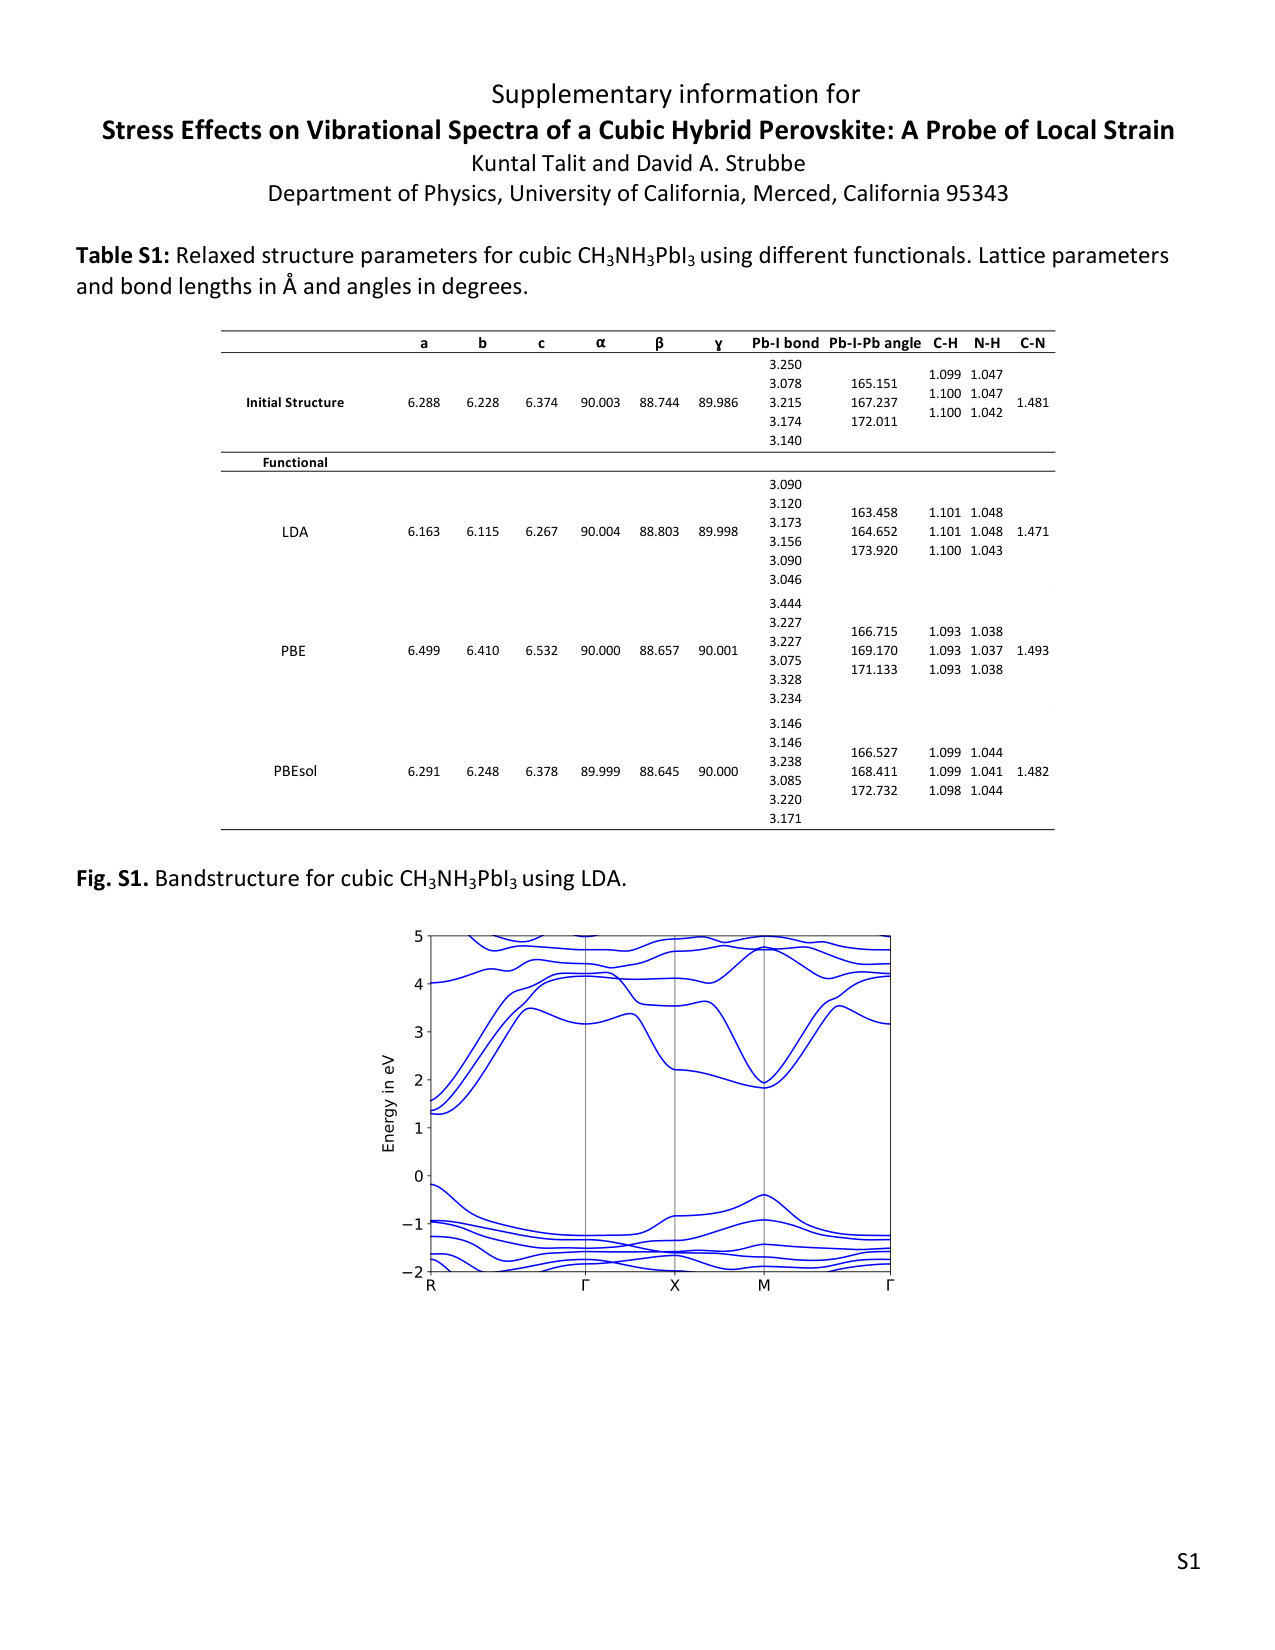 Figure 1
| a () | b () | c () | (deg.) | (deg.) | (deg.) | |
|---|---|---|---|---|---|---|
| DFT/LDA | 6.163 | 6.115 | 6.267 | 90.00 | 88.80 | 90.00 |
| DFT/PBE | 6.499 | 6.410 | 6.532 | 90.00 | 88.66 | 90.00 |
| DFT/PBEsol | 6.291 | 6.248 | 6.378 | 90.00 | 88.64 | 90.00 |
| DFT/PBEsol41, 74 | 6.289 | 6.229 | 6.374 | 90.00 | 88.74 | 89.99 |
| PND (352 K)75 | 6.317 | 6.317 | 6.317 | 90.00 | 90.00 | 90.00 |
| XRD (400 K)77 | 6.311 | 6.311 | 6.316 | 90.00 | 90.00 | 90.00 |
|
|
|
|
|
|
|
|
|
||||||||||||||||||||||||
|---|---|---|---|---|---|---|---|---|---|---|---|---|---|---|---|---|---|---|---|---|---|---|---|---|---|---|---|---|---|---|---|---|
| 85.8 | 86.6843 | 4.77 | 193.2 | -379.87 | -334.8 | -127.8 | -677.0 |
|
||||||||||||||||||||||||
| 97.4 |
|
5.53 | 20.2 | -348.77 | -140.8 | -772.7 | -132.8 |
|
||||||||||||||||||||||||
| 1457.1 | 1460.045 | 5.65 | 138.9 | 75.5 | 63.2 | 74.8 | 88.5 |
|
||||||||||||||||||||||||
| 1537.4 | 1582.045 | 7.48 | 15.6 | 157.33 | 79.2 | 302.3 | 90.5 |
|
Peer Reviews
No public reviews on file for this paper yet. If you reviewed it on a platform where reviews are public (OpenReview, ICLR, NeurIPS, ICML), you can paste yours below so the community can read it here.
Videos
No videos yet. Explain this paper in a talk, walkthrough, or lecture? Add one.
Stress Effects on Vibrational Spectra of a Cubic Hybrid Perovskite: A Probe of Local Strain
Kuntal Talit
Department of Physics, University of California, Merced, 5200 N. Lake Rd., Merced, CA 95343
David A. Strubbe
Department of Physics, University of California, Merced, 5200 N. Lake Rd., Merced, CA 95343
Abstract
Inhomogeneous strain may develop in hybrid organic metal-halide perovskite thin films due to thermal expansion mismatch with a fabrication substrate, polycrystallinity or even light soaking. Measuring these spatially varying strains is difficult but of prime importance for understanding the effects on carrier mobility, non-radiative recombination, degradation and other optoelectronic properties. Local strain can be mapped using the shifts in vibrational frequencies using Raman or infrared microscopy. We use density functional theory to investigate the effect of uniaxial strain on the vibrations of pseudo-cubic methylammonium lead iodide (CH3NH3PbI3), and identify the vibrational modes most favorable for local strain mapping (86 cm*-1*, 97 cm*-1*, 1457 cm*-1*, and 1537 cm*-1*) and provide calibration curves. We explain the origin of the frequency changes with strain using dynamical matrix and mode eigenvector analysis and study strain-induced structural changes. We also calculate mode Grüneisen parameters, giving information about anharmonicity and anisotropic negative thermal expansion as recently reported for other phases. Our results provide a basis for strain mapping in hybrid perovskites to further the understanding and control of strain, and improve stability and photovoltaic performance.
\SectionNumbersOn
1 Introduction
Organic-inorganic hybrid perovskites are promising materials for next-generation solar cell applications.1 They have a direct bandgap, 2, 3 high absorption coefficient4 long diffusion length,5, 6 and large carrier mobility7 which make them favorable for PV applications. In the last 10 years the record photoconversion efficiency (PCE) has increased drastically from 3.8% 8 to 25.2%.9 Owing to other benefits like ease of bandgap engineering,10, 11 flexibility for use in portable electronic devices,12 tunability of transparency to light for tandem cells,13 and suitability for mass production14 with a cheaper cost, perovskites have been the object of great interest in the solar cell industry recently. There are also other non-PV applications of perovskites, e.g. spin-optoelectronic applications,15 luminescent solar concentrators,16 and light-emitting diodes. 17
Despite these favorable properties, hybrid perovskites suffer from serious instability due to moisture,18 heat19 and light,20 which hinder their commercialization as solar cells. Although different encapsulation techniques can help to eliminate the moisture issue,21, 22 degradation due to unavoidable exposure to heat and light is still a challenge that needs to be addressed. Different studies have suggested that strain plays an important role in both degradation and photovoltaic performance of perovskites.23, 24, 25, 26, 27, 28, 29, 30, 31, 32 This strain arises in thin films via substrate thermal expansion mismatch, epitaxial lattice mismatch,33 phase transitions, grain structure, and composition inhomogeneities, creating both global and local strain.30 Strain within the lattice can affect the carrier dynamics,31 defect concentration, non-radiative recombination,30 bandgap27 etc. and decrease the PCE of the device. Strain can also decrease the activation energy of ion migration within the material which accelerates its degradation.25 Slow photocurrent degradation caused by deep trap states has been attributed to polarons, consisting of strain and reorientation of the organic ion, which form under light soaking.24 On the other hand, light soaking can also create lattice expansion which reduces residual strain within the lattice and help to increase efficiency.29 High compressive strain (more than 1% for cubic CH3NH3PbI3) can also be responsible for structural phase changes.26, 27 To understand all these strain-induced behaviors, we need to understand the structural and vibrational changes due to strain.
In this work, we study as a benchmark system the pseudo-cubic phase of methylammonium lead iodide (MAPI, CH3NH3PbI3),34, 35 one of the best studied hybrid perovskites. Depending on temperature, MAPI exists in three different phases: orthorhombic at low temperature ( 161.4 K), tetragonal at room temperature (161.4 K 330.4 K) and cubic (or pseudo-cubic)36 at high temperature ( 330.4 K). Both orthorhombic and tetragonal structures are based on supercells of the cubic structure with four times the number of atoms in the unit cell.
We have chosen to begin with a study of the high-temperature cubic phase due to its simpler structure. Further work will study the orthorhombic and tetragonal structures, which clearly have their own individual characteristics. The cubic phase can be considered as a reference to describe the structures of the other phases.36 It is not only significant at high temperatures, but also it can be stabilized at lower temperature in quantum dots via ligands on the surface,37 use of other organic cations 38 such as formamidinium, or substitution of Br for I.39 Generally cubic phases are found to have higher PCE than the other phases.40 Due to the strong resemblance between the cubic, tetragonal, and orthorhombic phases’ vibrational properties, particularly in the mid-frequency range,41 we believe this work also gives insight into those phases.
Vibrational properties of all three phases have been extensively studied.42, 43, 44, 45, 46, 41, 47, 48, 49 The infrared (IR) and Raman spectra of all three phases show three distinct regimes of the vibrational frequencies, due to the Pb-I cage and coupled cage/methylammonium (MA) ion modes at low frequency, and MA ion at medium and high frequency.47 There are only a few experimental results on vibrational spectroscopy available for the cubic structure42, 45, 43, 49. Others have argued that there is no Raman activity of the low-frequency PbI cage modes for cubic MAPI50 or cubic MAPbBr3,51 based on the symmetry argument given for CsPbCl3 and SrTiO3.36 Observation of small but nonzero Raman activity in this regime was attributed to disorder.50 However, even in a perfectly ordered cubic MAPI crystal the fact that we have different atomic coordinates from CsPbCl3 means that the PbI cage phonon modes (by hybridization with the MA ion modes) can have other irreducible representations that are Raman active, as indeed we demonstrate in this work. Measurement of low-frequency Raman has been attributed to light-induced degradation products,50 but our results suggest the validity of at least some measurements in this regime, demonstrated by the agreement in frequencies in Fig. 2.
The detailed behavior of vibrational modes under applied tensile and compressive strain for these materials has not been studied. A high-pressure study of MAPbBr351 showed only broad features in the cubic phase in the low-frequency region, and clear peaks occurring after phase transition to tetragonal. However the related macroscopic Grüneisen parameter , and the related thermal expansion, have been studied. For the tetragonal structure, a negative thermal expansion coefficient was measured along the [001] direction (-axis).52, 53 For the cubic structure, the Grüneisen parameter was calculated and measured in previous studies52, 41 but not along all three crystallographic axes. (including the individual mode Grüneisen parameters, also known as phonon deformation potentials54) are of fundamental interest as a probe of anharmonicity, which is quite strong in perovskites55, 56 and relates to phonon-phonon scattering and thermal transport.
Using strain effects on vibrations to measure local strain can help us to understand the material degradation and its performance instability. To measure local strain within a material, we want to focus on a length scale m or below. Most of the experiments done so far to measure strain in perovskites have used grazing incidence X-ray diffraction (GIXRD), normal XRD57, 29, 31, 25 or the substrate curvature method 57 which probe large areas. Scanning XRD has been used for more local mapping, but requires a synchrotron.30 Another standard non-destructive technique used to characterize perovskites and other semiconductor thin films is Raman spectroscopy.58 Raman microscopy, in which small areas are probed, can be used to measure the stress distribution within a material. This is a well established technique for crystalline Si (c-Si) in the semiconductor industry,59 and is used for 2D materials.60 It can even be used in hydrogenated amorphous silicon, a disordered material with very broad peaks, as we showed in a previous theory-experiment collaboration.61 This method has resolution on the m scale, or even down to nanometers with tip-enhanced Raman spectroscopy.62 Synchrotron-based IR microscopy has also been used for local mapping of strain and related structural changes.63, 64
In this paper, we analyze vibrations under compressive and tensile strain for cubic CH3NH3PbI3 and determine the calibration data needed to gauge local strain. The paper is organized as follows. In section II we detail our computational methods of structural optimization, calculation of normal mode frequencies and theoretical framework to understand frequency shifts in terms of perturbations of the dynamical matrix and mode eigenvectors. In section III, we discuss the behavior of phonon modes under uniaxial strain, understand the different behaviors in terms of structural changes and dynamical matrix analysis, find the best possible modes to probe local strain using Raman spectroscopy, and calculate the Grüneisen parameter and compare to other theory and experimental data. In section IV, we conclude and present the four best modes for measuring strain using Raman or IR spectra.
2 Methods
2.1 Computational Details
For structural optimization and phonon mode calculations we have used density functional theory (DFT) and density functional perturbation theory (DFPT) 65 as implemented in Quantum ESPRESSO (version 6.1)66, 67, 68. The Brillouin zone is sampled using a half-shifted 666 Monkhorst-Pack grid with an energy cutoff of 100 Ry for the wave-functions. Atomic positions are optimized until the total force per atom is smaller than 1 meV/; for the initial variable-cell relaxation, a 0.5 kbar stress convergence threshold is used. The Local Density Approximation69 (LDA) with the Perdew-Wang (PW) parametrization70 is used for the exchange-correlation potential for all the calculations. Scalar relativistic Optimized Norm-Conserving Vanderbilt (ONCV) pseudopotentials71 are used which treat Pb 5 orbitals as valence. All the pseudopotentials are taken from Pseud Dj72, 73 (NC SR ONCVPSP v0.4) with standard accuracy. We have not considered spin-orbit coupling as it does not have much effect on interatomic interactions near equilibrium.41
The initial structure is taken from the work of Brivio et al.,74, 41 with the cation oriented close to the [100] direction, which was found to be slightly favored in molecular dynamics. It can be difficult to obtain an optimized exact cubic structure of MAPI without distortion to other phases.2 Some experiments show the structure as cubic,75 others pseudo-cubic.76, 77 Experimental work reports the fast reorientation of the CH3NH ion and also the rotation of CH3 and NH3 groups along the C-N axis, and these rotations and reorientation are extremely fast (14 ps).78 These motions can make a cubic symmetry averaged over space and time, but obviously cannot be captured in a static DFT calculation, which instead represents a single local snapshot. A periodic calculation imposes an artificial long-range order, but our dynamical matrix calculations suggest that this does not have an important effect on the vibrational properties (Sec. 3.3), consistent with the conclusion of Leguy et al.49 that dynamical disorder broadens peaks in MAPI but does not shift them significantly. Local asymmetry in the structure along with spin-orbit coupling has been calculated to cause splitting and an indirect gap.79, 80 A theoretical study showed that changes in the c/a ratio are coupled to the orientation of the CH3NH ion.23 Our structural optimization makes the structure pseudo-cubic, in agreement with other calculations.23, 41 As in standard DFT calculations, our lattice is at zero temperature, and the high temperature at which the cubic phase is observed does not enter into the calculations.
The equilibrium structural parameters are reported in Table 1. More detailed information, including results with different functionals, are reported in Table S1, along with bandgaps in Table S2 and the LDA bandstructure in Fig. S1 in agreement with previous work.81 Optimized crystallographic angles , and are 90∘, 88.8∘ and 90∘ respectively. Pb-I-Pb angles are 164.65∘, 163.46∘ and 173.92∘ along , and axes, respectively. The C-N bond-length is found to be 1.47 with average C-H and N-H bond lengths of 1.1 and 1.05 . Due to the pseudocubic lattice, off-centering of the Pb atom, cation orientation, and distortion of the Pb-I cage, the structure has no symmetry,36 even when we checked the structure without the CH3NH ion or with the H atoms removed. Our final relaxed cation orientation has the C-N bond lying in the (010) plane, at an angle of 23.3∘ to the -axis ([100] direction).
Before applying strain to the structure, the convergence of the phonon frequencies with respect to the -grid and phonon self-consistency threshold are checked, and all the calculations are done using phonon self-consistency threshold 10*-16* to avoid imaginary frequencies at the point. We compared different functionals (PBE,82 PBEsol83 and LDA69) and found only small changes in mode frequencies at . For low-frequency phonons, the pattern is LDAPBEsolPBE whereas for medium (800–1600 cm*-1*) and high (2900–3200 cm*-1*) frequencies it is LDAPBEsolPBE with most deviation at high frequencies, as shown in Fig. 1. For this comparison, we have performed the variable-cell relaxation using the same functional used to calculate the phonon frequencies.
For reference, we performed similar calculations for the well studied case of c-Si (Fig. S2) and the result follows the same low frequency pattern LDAPBEsolPBE that we have found in cubic MAPI. We apply uniaxial strain in the [100] direction and plot frequency changes; the three degenerate optical phonons are split into a doublet and singlet. Results are shown in Table S3 and Fig. S2. LDA in fact has the best agreement with experiment84, 85 for both frequency and slope, in this case; PBEsol is similar, but PBE is more different.
Moving now to the effect of strain on cubic MAPI, we applied up to 1 uniaxial compressive (negative, in our convention) and tensile (positive) strain along the three crystallographic directions [100], [010] and [001] to the optimized zero-strain structure. Shear strains were not calculated as they generally have a smaller effect on the frequencies59, and are less commonly found in thin films. We considered results up to 0.4 strain where the changes in frequency with the applied strain are typically at least 1 cm*-1*, which is generally measurable in Raman spectroscopy.45 Strain more than 0.4 gives more signal-to-noise ratio, but more modes also become nonlinear. To make sure that this strain range is appropriate for studying linear responses, we have also computed the elastic constants by applying isotropic, tetragonal, and trigonal strain to the cubic MAPI lattice and thereby calculating elastic constants , and following the procedure based on a quadratic fit of total energy86. Within the range of 0.4, our result with LDA shows reasonable agreement with previously published results (Table 2). Note that we have separately calculated each diagonal element of the elastic constant tensor, and found some differences between them due to the pseudocubic lattice and lack of symmetry, whereas previous reports appeared to assume perfect cubic symmetry and calculated only and .26, 87
Having confirmed reasonable results for LDA on phonon frequencies and elastic constants, we are using LDA for all our strain and phonon calculations as Quantum ESPRESSO can only provide Raman intensities for LDA.88 The code’s ASR=crystal setting is used to enforce the acoustic sum rule (ASR) and make the acoustic modes exactly zero.89 For each mode, we have calculated the uniaxial mode Grüneisen parameter for [100], [010] and [001] crystallographic directions using the slope of the frequency versus strain graph, with the formula , where is the applied strain and is the frequency of mode 61. By taking the weighted average over all the modes, we have calculated the temperature-dependent Grüneisen parameter . This is connected to the macroscopic property of the material by the relation where is volume thermal expansion coefficient, is isothermal bulk modulus, is heat capacity at constant volume and is the density.90 Raman intensities are calculated using the approach of Lazzeri et al.88 and IR intensities computed from Born effective charge tensors which are calculated as the variation of macroscopic polarization with the atomic displacement using the modern theory of polarization91, 65.
2.2 Theoretical frame-work to understand the frequency change
To obtain the normal mode frequencies, we solve the secular equation65 given below:
[TABLE]
where denote atoms within the unit cell; represent and directions; is the dynamical matrix of the system; and represents the mode eigenvector. The dynamical matrix can be expressed as
[TABLE]
where is the total energy of the system, denotes the position vector of atom , and denotes mass of atom . For non-strained condition, the normal-mode frequency will be represented as . To treat the variation of with strain, we write as
[TABLE]
Strain can be treated as a perturbation to the vibrational properties of the material. The perturbation changes the dynamical matrix as well as the mode eigenvectors of the system, as given in equations (4) and (5) (up to quadratic order):
[TABLE]
[TABLE]
Since the mode eigenvectors are real in our case at , we can use . If we apply the perturbed dynamical matrix with perturbed eigenvector to equation (3), we can calculate the change in frequency as
[TABLE]
The above equation can be used to find the change in frequency59 due to strain as
[TABLE]
For silicon, a simple matrix equation for the Raman-active transverse optical (TO) modes has been theoretically derived54, 92 and experimentally verified,92 but for the pseudo-cubic perovskite the secular equation is more complicated as it has five different types of atoms and has no symmetry or degeneracy. Instead, to analyze this situation, we have considered changes in eigenvectors with strain, as well as the changes in the dynamical matrices to clearly understand which atomic interactions contribute significantly to the changes in phonon frequencies, as detailed in section 3.3.
3 Results and Discussion
3.1 Behavior of phonon modes under uniaxial strain
Calculated normal modes at of cubic CH3NH3PbI3 show three distinct frequency regions – low (20-350 cm*-1*), medium (850-1600 cm*-1*) and high (2900-3200 cm*-1*) – as described for cubic as well as orthorhombic and tetragonal structures in previous studies.41 Low-frequency modes are mainly due to the vibration of PbI6 octahedra and some coupling between the PbI6 octahedra and CH3NH ion, while the medium and high frequency modes involve the vibration of the CH3NH ion. Since pseudo-cubic MAPbI3 does not have any symmetry,36 it is not possible to assign spectral activity to any particular mode using group theory. All modes show both IR and Raman activity to some degree.
Our ab initio IR and Raman results are shown in Fig. 2. Calculated -point phonon modes are convolved with 1 cm*-1* Lorentzian broadening and compared with the calculations of F. Brivio et al..41 The difference in results are primarily due to our use of LDA and their use of PBEsol, as expected from Fig. 1. Calculated frequencies match well with published theoretical results,41 and experimental measurements from THz at low frequencies 49 and Raman45, 43 and IR42 at medium to high frequencies.
We have 12 atoms in our unit cell for cubic CH3NH3PbI3, which gives 36 phonon modes, of which 3 have exactly zero frequency according to the ASR. For the other 33 modes we plotted frequency vs. applied strain (both compressive and tensile). Different patterns are noticed for different modes. Some of them are linear, some are parabolic, and some are neither (Fig. 4). For comparison, c-Si shows linear changes for small strain, and a splitting of degeneracy (Fig. S2). Given the much more complicated structure of the perovskite and lack of symmetry (hence no degeneracy), more complex behavior is observed. Low-frequency modes (27.97 cm*-1*, 28.3 cm*-1*, 34.92 cm*-1* and 35.81 cm*-1*), which closely approach other modes under strain, show the parabolic pattern expected for an avoided crossing in phonons (or electronic bands), along with mixing and exchange of eigenvector character on either side of the crossing. The modes which approach or cross under strain are shown in Fig. 3. Using the eigenvectors as a guide, in a few cases we found crossing of modes under strain, and therefore relabeled the modes to maintain a continuous character. Other modes with irregular behavior show even more mixing between modes, in a non-perturbative way, which we attribute to strong coupling to structural changes as discussed in Sec 3.2. Those modes where the frequency change is mostly linear can be categorized into four different categories: i) slopes of [100] and [010] strain are of same sign while slope of [001] is opposite sign (e.g. 143.6 cm*-1*, 3053.38 cm*-1*), ii) slopes of [010] and [001] strain are of same sign while slope of [100] is of opposite sign (e.g. 908.09 cm*-1*, 1403.54 cm*-1*), iii) slopes of [100] and [001] strain are of same sign while slope of [010] is of opposite sign (e.g. 20 cm*-1*, 34 cm*-1*) and iv) all slopes have same sign for [100], [010] and [001] strains (e.g. 97.4 cm*-1*, 312.59 cm*-1*). The number of modes falling under different slope categories are given in Table S5 and the frequency change pattern for most of the modes is linear. There are some modes for which the slopes are almost the same for two different directions. For example, 97.4 cm*-1* has Pb-I-Pb bending perpendicular to both [100] and [001], giving rise to the same slopes for these strain directions. For 1365.3 cm*-1*, symmetric umbrella type C-H bending has components in all directions and has comparable behavior for [100] and [010] strain directions. These behaviors indicate approximate symmetries of particular modes despite the lack of overall symmetry. In Fig. 4, we provide four representative modes’ frequency vs. strain patterns.
To understand these behaviors, we plotted eigenvectors (displacement patterns) for each mode, contributed by each atom in the unit cell as ; those for the chosen four representative modes are given in Fig. 5. We noticed that the change in frequency with strain is linear when the eigenvector does not change appreciably but the dynamical matrix does, as the effect of 2nd order change in dynamical matrix comes in only at 2nd order (Eqn. 6). Due to the lack of symmetry, the dynamical matrix elements always have a change with strain in this system. On the other hand, if the eigenvector does change, we can have some non-linear effect in the frequency change which can be understood from the second-order part of Eqn. 6. In most cases, the dynamical matrix change is large enough to produce effects beyond quadratic. For example, Fig. 4(a) shows a kink at zero for the frequency for both [010] and [001] strain while for [100] strain it is almost linear (parabolic under compressive strain). We can see that the change in mode eigenvector for the corresponding mode shows a drastic change at zero for strain along [010] direction (Fig. 5(a)) and the mode’s character is a combination of translation of the CH3NH ion along [001] direction and Pb-I-Pb rocking mode. Fig. 4(b) shows parabolic frequency changes for [100] and [010] strain which can be understood from the changes of the eigenvector and close approach with another mode (Fig. 5(b)). This mode is a combination of CH3NH ion libration in the [010] direction and a Pb-I-Pb rocking mode. In Fig. 4(c) we can see that the frequency change is linear and if we check the corresponding change in eigenvector (Fig. 5(c)) we can see that there is very little change with strain which as per Eqn. 6 will produce a linear pattern. The mode character for this mode is libration and spin (all the H atoms attached to C and N are rotating in the same direction) of CH3NH ion, and Pb-I-Pb bending. Finally, in Fig. 4(d) we found that the frequency change pattern is irregular despite very little change in atomic contributions to the eigenvector (Fig. 5(d)). This is because the , and components for C, N and H are changing irregularly with strain even though the sum of squares over the Cartesian directions is constant for each atom. This is a pure molecular mode with symmetric C-H and N-H bending with C-N stretch. We find that generally C-H and N-H vibrations are associated with nonlinear changes in the mode character under strain. We will see by structural and dynamical analysis that C-H, N-H vibrations are important for most of the frequency change under strain. Corresponding plots for all modes are given in Fig. S12.
3.2 Structural Changes under uniaxial strain
While highly symmetric structures such as c-Si do not have internal parameters that can change with strain, in hybrid perovskites, the structure evolves under applied strain, which can play a role in vibrational changes. The significant changes are a sign of the anharmonicity of MAPI. Lengths of bonds parallel to strain are changed most, but those perpendicular to the direction of strain are also affected. For example, the Pb-I bond length along [100] changes most for strain along [100] but Pb-I bond lengths along other two perpendicular directions, such as along [010] and [001] are also changing as shown in Fig. 6(a). This change in bond lengths in the perpendicular direction to the strain is more prominent when the strain is acting perpendicular to the direction of the methylammonium ion which is close to [100] (Fig. S3). The Pb-I-Pb bond angles also change with applied strain: they decrease with compressive strain acting parallel to the bond angle and increase when it is acting perpendicular to the bond angle as can be seen in Fig. 6(b). Pb-I-Pb bond angle which is along [100] decrease, and those along [010] and [001] directions increase, for compressive strain along the [100] direction. Similar behavior is found in a theoretical study for tetragonal structure where the Pb-I-Pb bond angle which is parallel to the strain direction increases for tensile strain and decreases for compressive strain, but the Pb-I-Pb bond angle perpendicular to the strain direction increases for compressive strain and decreases for tensile strain.27 There are almost no changes (0.007%) in the C-N bond length but the N-H bond length (along [001]) decreases with compressive strain (Fig. S9). This reduction in N-H bond length supports the idea that compressive strain may be useful to stabilize the material.93, 94
The CH3NH ion, which lies in the (010) or -plane also rotates with an increasing angle with respect to the [100] direction or -axis under compressive strain and a decreasing angle under tensile strain (Fig. S11), with changes of up to over our strain range which is related to the change in ratio23 as mentioned in Sec. 2.1. Rotation is largest for [010] strain. This may be due to the fact that the CH3NH ion lies in the (010) plane perpendicular to [010]. Rotation of CH3NH is also reported for tetragonal structure under compressive strain.27 The distances of C and N with their nearest Pb and I change with strains and the discontinuity in the I-N, I-C, N-Pb and C-Pb distances gives an indication why we see certain kinks or irregularities in the Raman shift vs strain graphs. For example, mode 128.01 cm*-1* shows kinks in the frequency change pattern (Fig. S12) where C-H and N-H are showing asymmetric bending modes with libration of the MA ion within the Pb-I cage, which is affecting the C-Pb and I-N distances most. Similarly, for 1023.57 cm*-1*, we see that the irregularity is greater for [010] and [001] strain than [100]. We have further analyzed these changes in terms of the dynamical matrix in the next section. Full plots of structural parameters with each direction of strain are in Fig. S3-S11, and all atomic coordinates and phonon eigenvectors of relaxed strained structures are provided in the Supporting Information.
3.3 Change in dynamical matrix due to uniaxial strain.
To understand the different behaviors of the phonon modes under strain, we have analysed the dynamical matrix of each strained structure according to Section 2.2. We have calculated the changes in dynamical matrices and plotted the results as heat-maps in Fig. 7(a) and 7(c) to understand which changes in interatomic interactions are most significant for the vibrational frequency changes under strain and how they relate to the different linear/parabolic/irregular pattern observed. Fig. 7(b) shows the dynamical matrix for the unstrained lattice. Note that these plots are symmetric about the diagonal and the scales are different for the strained and non-strained cases. The largest elements are in the C, N, H block due to lighter masses (see Eqn. 2). Diagonal elements are generally larger than off-diagonal elements, as can be seen at Fig. 7(b). It can be also seen that changes due to compressive strain are more than those of tensile strain, which can be understood based on the typical curve of energy vs. bond length, the Morse potential. Since Pb and I are heavier than C, N and H, Pb-I interactions will be significant most for low frequency modes. It can be noticed that there are very small interactions between H atoms and their nearest Pb or I atoms (Fig. 7(b)) which gives an indication that van der Waals interactions are of minor importance for vibrations of the cubic structure which is also supported by a previous study.95 We have calculated also the dynamical matrix for a supercell, and found that the matrix elements are significantly smaller when the two atoms are in different primitive cells. This indicates that the artificial long-range order in our periodic structure does not make much difference in the vibrational properties compared to the true dynamical disorder.
From the change in dynamical matrix in Fig. 7(a) and Fig. 7(c), we can see that the component of Pb-I interactions changes most when it is parallel to the direction of strain. For example, the Pby-Iy interaction changes most for [010] strain whereas Pbx-Ix and Pbz-Iz interactions change most for [100] and [001] strains respectively (Fig. S14-S15). We have already seen in the structural changes that Pb-I bond length is affected most when the stretches are along the direction of polarization of the bond. It is clear from Fig. 7(a) and Fig. 7(c) that Pb-I modes are significantly affected due to strain. It can also be seen that I-N coupling (lower left and upper right) is important and greater than I-C coupling which is due to the electrostatic interaction between the MA ion and the cage. These interactions play a significant role in the frequency shifts and are important for the medium and high frequency regions.
Given the success of analyzing vibration separately47 (lattice and ion), one might think that the lattice strain will not affect the MA ion, but this turns out not to be true. Among the hydrogens attached to C, or the hydrogens attached to N, there are significant changes with strain in the interactions, which explain the behaviors of some of the high frequency modes. Modes that have a large component of C-H, N-H stretch have higher slopes in the high frequency region, whereas in the low frequency region large Pb-I stretch or bend with C-H, N-H stretch is associated with large slope. C-H, N-H asymmetric stretch or CH3NH3 spin and torsion are found to have high slopes. It is found that slope values are high in the low and high frequency region and small in the medium frequency region. It is also found that the slope values are typically higher when the strain is perpendicular to the direction of the MA ion (along [010] and [001]) and lower when its along the direction of the MA ion i.e. along [100]. We attribute this asymmetry to the orientation of the C-H bonds: two of the C-H and N-H bonds lie closer to [010] than to [100], giving greater effects from [010]; one C-H and one N-H bond lie parallel to [001], and these bond lengths are affected most by [010], and also show the greatest effects of any C-H or N-H bonds in any strain direction (Fig. S9, S10). Therefore the strain effects on the MA ion, and its interactions with the cage, are greatest when we apply strain along [010] and [001].
IR and Raman intensities are much higher in the high frequency region than in the low or mid-frequency regions, and are mainly contributed by C-H and N-H stretches. From our full phonon analysis, shown in Table S4, we found that low-frequency modes are mainly due to Pb-I-Pb vibration with translation or libration mode of the MA ion. The mid-frequency modes mainly consist of C-H and N-H asymmetric bending with some spin or twist. The high-frequency modes are mainly symmetric and asymmetric stretch of C-H and N-H bonds of the methylammonium ion. For all the modes, IR intensity vectors are lying in the plane, either in (100) or in (001) plane. Modes which have high slopes in all three directions – among them, high frequency modes (3053.38 cm*-1*, 3058.42 cm*-1*, 3161.71 cm*-1*) – are both highly IR- and Raman-active while low frequency modes (27.97 cm*-1*, 65.02 cm*-1*, 85.82 cm*-1*) are less IR- and Raman-active. Modes involving libration and translation of the CH3NH ion and Pb-I-Pb bending have high slopes along [100] direction while modes having high slope in [010] show C-H and N-H stretch in CH3NH ion.
3.4 Best modes to probe local strain in cubic CH3NH3PbI3
An appropriate mode for strain mapping with IR/Raman microscopy should have i) a large IR or Raman intensity, for ease of detection; ii) a linear frequency change with strain, for simple and unique relation of frequency to strain; iii) a large slope for frequency vs. strain, for sufficient signal-to-noise ratio in measuring frequency shifts; and finally, iv) a small change in frequency with respect to cation orientation, ensuring the validity of our results in the presence of cation rotations at elevated temperature.36
A difficulty in checking these frequency changes with cation orientation is that phonon calculations are not very meaningful except from a relaxed structure, and only a few cation orientations are stable.41, 79 We took our zero-strain structure and rotated the cation close to the [111] direction, and relaxed the structure. The result is 0.01 eV higher in energy, and has the cation in the plane, with the C-N bond at an angle of (compared to for our main data set) with respect to [100] direction. From a phonon calculation, we find some mode frequency changes due to the CH3NH rotation, typically by a few wavenumbers. We may expect this variation to be a contribution to heterogeneous broadening of Raman peaks as ions rotate thermally. Indeed Nakada et al. report larger peak widths for high- and low-frequency modes than for mid-frequency modes, for all 3 crystal phases,45 in accordance with our results for frequency changes with ion rotation. The high- and low-frequency modes change most while the mid-frequency modes change less due to the CH3NH rotation. This is because the mid-frequency region is mainly symmetric/asymmetric bending modes of the MA ion which are not affected much by rotation of the MA ion, whereas stretching modes at high and low frequency are the ones that change more when the distances change between the MA ion and the Pb-I cage. For this reason, the same modes that have large frequency changes with ion rotation have large slopes with strain. Full results are shown in Table S4. If the mode frequency changes by a significant amount due to rotation of the molecule, our static result may have a larger error, and the predicted frequency shifts due to strain will be less reliable. Therefore, we need to focus on those modes for which frequency change due to rotation of the MA ion is minimal.
After this analysis, we can identify the best modes for IR or Raman microscopy for probing local strain.59, 61 We note 4 suitable modes, whose properties are detailed in Table 3 and whose displacement patterns are shown in Fig. S13. A combination of all 4 modes can be used together for better precision, or even to find a best fit to 3 directions of uniaxial strain. Two are low-frequency Pb-I modes and two are mid-frequency molecular modes. The frequency changes vs. strain are shown in Fig. 8 and the eigenvectors vs. strain are shown in Fig. 9, exhibiting little change in mode character and a robust linear frequency change. Each of these modes has all slopes positive or all slopes negative. In the case of triaxial strain or when cation rotations wash out directional dependence, the average of the three uniaxial slopes would be the appropriate slope according to Eq. 6. Having all uniaxial slopes with the same sign is convenient, because the three directions will reinforce each other rather than cancelling out, as could happen when the slopes have different signs. The IR and Raman intensity for these 4 modes show only moderate changes with strain (Fig. S16-17) as for c-Si optical modes,59 which we expect would not cause any problem for experimental measurement. We find another mode at 1365.3 cm*-1* that has favorable properties with reasonable Raman intensity to probe local strain (Fig. S12); however it is not observed in experiment. The reason may be limitations of our model. Our structure is pseudocubic rather than cubic, and our calculation is static and done at 0 K at which this is not the stable phase. As a result, this mode may in fact lose its Raman activity due to dynamic average symmetry in the real high-temperature structure.
There is a final point to consider in assessing experimental feasibility. To be able to measure strain by Raman shifts, we need to obtain a frequency shift that is higher than the experimental resolution. For typical strain26, 27 of 1% we can expect to obtain shifts -3.8 cm*-1*, -3.5 cm*-1*, 0.75 cm*-1* and 1.57 cm*-1* for the favorable Raman modes at 85.8 cm*-1*, 97.4 cm*-1*, 1457.1 cm*-1* and 1537.4 cm*-1*, respectively based on the average slopes in Table 3. Experimentally measured full widths at half maximum (FWHMs) for Raman spectra43, 42, 45 around the low-frequency modes are 8 cm*-1*, 10 cm*-1*, and 18 cm*-1*, and for the mode at 1460 cm*-1*, the FWHM is around 35 cm*-1*. One contribution to FWHM can be strain itself – inhomogeneous strain distributions within the Raman focus will result in broadening.96 Although these FWHMs are high, peak shifts can be resolved less than 1 cm*-1*, as seen for the temperature-dependent Raman shifts measured by Nakada et al.45 and in Strubbe et al.61 on a-Si:H, because fitting of Gaussian peaks allows determination of differences in peak centers to much greater precision than the FWHM. Temperature dependent frequency shifts were measured for MAPI by Nakada et al.45 and they were able to measure shifts less than 1 cm*-1* which is well within the expected shifts from 1% strain in case of our cubic structure. One contribution to the temperature-dependent frequency shift is thermal expansion which is a sign of significant effect of anharmonicity. Our results show that this is a relatively minor contribution because our predicted shifts due to thermal expansion are much less than the shifts reported by Nakada et al.,45 in accordance with results of Bonini et al. for graphite.97
Finally, note that the deviation between calculated and measured frequencies for these modes is larger than expected strain shifts. Due to this unavoidable systematic difference, we would recommend use of our calculated slopes to infer relative strains in a sample, rather than by direct comparison of experimental frequencies to our calculated frequencies.61
3.5 Calculation of mode Grüneisen parameter
The uniaxial mode Grüneisen parameter is calculated using the slope of the frequency vs strain curve for each mode (Fig. 10), as done in a-Si.61 Pb-I vibrations at lower frequency have significant values, whereas CH3NH ion vibrations at higher frequency have much smaller values. One of the reasons for the low values at high frequency is the high frequency itself, as we divide the slope with the mode frequency, although some high-frequency modes do have large absolute slopes. To connect to macroscopic properties, we calculate the Grüneisen parameter, as the weighted average over all the modes using the Bose-Einstein formula for heat capacity. In distinction to F. Brivio et al.,41 we are using uniaxial strain, and we include only modes at , because of the conceptual problem in the quasiharmonic approximation of how to handle the imaginary frequencies.98 Also, due to dynamical disorder 49, which is not included in our calculation, the phonon bandstructure away from may be less accurate or lose some of its meaning without periodicity. The imaginary frequencies are indicative of the fact that the cubic structure is not the most stable phase at , and were observed in previous work.41 They occur around =R and =M, and are not reduced by strain (Table S6). Our calculated values of the directional Grüneisen parameter at 330 K (the transition temperature to tetragonal) for strain along [100], [010], and [001] are 1.06, 2.10, and -0.51, respectively, for an average of 0.88. The isotropic value reported by F. Brivio et al.,41 averaged over temperature, was 1.6. We expect the difference is due to the handling of Brillouin zone integration, as well as their calculation via quasiharmonic thermal expansion rather than mode Grüneisen parameters. This result shows a directional dependency of the Grüneisen parameter that suggests an unusual negative thermal expansion along [001] direction for cubic MAPI, due to the negative value. While the existence of cation rotations at 330 K complicates the physical interpretation of this result, it connects to previous studies reporting that tetragonal perovskites have a negative thermal expansion coefficient along the [001] or -axis,52, 53 which is perpendicular to the direction of polarization of the CH3NH ion and also the largest lattice vector, in both cubic and tetragonal structures.
4 Conclusion
We have comprehensively studied the structural and vibrational properties of cubic CH3NH3PbI3 under uniaxial strain. By analysing the dynamical matrix of the system under each strain we are able to identify the interactions which contribute significantly to the frequency changes due to applied strain. The phonon modes have frequency changes under strain, which can show linear, parabolic, or irregular patterns. Linear is associated with change in dynamical matrix but no change in mode eigenvector with strain, while parabolic is associated with changes in both dynamical matrix and mode eigenvector, in accordance with a perturbative analysis. Irregular patterns are due to large changes in mode eigenvector due to discontinuous structural changes, which are a sign of anharmonicity. These changes give insight into the interplay between structure, strain, and vibrations, and show approximate symmetries for some modes. We find that not only the Pb-I bond lengths but also the Pb-I-Pb bond angles change under strain, showing a buckling of the Pb-I lattice. Decrease in N-H bond length under compressive strain may be connected to the increased stability under compressive strain. We also find that the cation rotates with respect to the lattice under strain. We have identified 4 modes that are promising for IR or Raman microscopy measurement of local strain, as done in other semiconductors and even amorphous Si which has broad peaks. Results on the mode Grüneisen parameters and macroscopic Grüneisen parameters give insight into anharmonicity and directional negative thermal expansion. Our study of the cubic phase is relevant not only to high temperatures but also to cubic phases stabilized by ligands or other cations. Our results are expected to be similar in many respects to results for the tetragonal and orthorhombic phases, particularly in the mid-frequency range where the spectra are similar, and these phases will be the subject of future publications. We look forward to experimental work to confirm these results with uniform strain, and employ our calibration for strain mapping. Our work opens the for a standard bench-top characterization method to be usable for analyzing the critical role of local strain in hybrid perovskite photovoltaics.
{suppinfo}
Structural parameters, bandstructure and bandgap, phonon mode characterization, structural changes with strain, mode eigenvector and frequency changes with strain, imaginary modes at the =M and =R points (PDF). Relaxed atomic coordinates at each strain including phonon eigenvectors (AXSF).
{acknowledgement}
We acknowledge a helpful discussion with Yong Zhang. Work was supported by UC Merced start-up funds and the Merced nAnomaterials Center for Energy and Sensing (MACES), a NASA-funded research and education center, under award NNX15AQ01. This work used computational resources from the Multi-Environment Computer for Exploration and Discovery (MERCED) cluster at UC Merced, funded by National Science Foundation Grant No. ACI-1429783, and the National Energy Research Scientific Computing Center (NERSC), a U.S. Department of Energy Office of Science User Facility operated under Contract No. DE-AC02-05CH11231.
TOC Graphic
The reference list from the paper itself. Each links out to its DOI / PubMed record.
- 1Green et al. 2014 Green, M. A.; Ho-Baillie, A.; Snaith, H. J. The emergence of perovskite solar cells. Nat. Photon. 2014 , 8 , 506–514
- 2Frohna et al. 2018 Frohna, K.; Deshpande, T.; Harter, J.; Peng, W.; Barker, B. A.; Neaton, J. B.; Louie, S. G.; Bakr, O. M.; Hsieh, D.; Bernardi, M. Inversion symmetry and bulk Rashba effect in methylammonium lead iodide perovskite single crystals. Nat. Commun. 2018 , 9 , 1829
- 3Umari et al. 2014 Umari, P.; Mosconi, E.; De Angelis, F. Relativistic GW calculations on CH 3 NH 3 Pb I 3 and CH 3 NH 3 Sn I 3 perovskites for solar cell applications. Sci. Rep. 2014 , 4 , 4467
- 4Shirayama et al. 2016 Shirayama, M.; Kadowaki, H.; Miyadera, T.; Sugita, T.; Tamakoshi, M.; Kato, M.; Fujiseki, T.; Murata, D.; Hara, S.; Murakami, T. N. et al. Optical transitions in hybrid perovskite solar cells: Ellipsometry, density functional theory, and quantum efficiency analyses for CH 3 NH 3 Pb I 3 . Phys. Rev. Appl. 2016 , 5 , 014012
- 5Stranks et al. 2013 Stranks, S. D.; Eperon, G. E.; Grancini, G.; Menelaou, C.; Alcocer, M. J. P.; Leijtens, T.; Herz, L. M.; Petrozza, A.; Snaith, H. J. Electron-hole diffusion lengths exceeding 1 micrometer in an organometal trihalide perovskite absorber. Science 2013 , 342 , 341–344
- 6Xing et al. 2013 Xing, G.; Mathews, N.; Sun, S.; Lim, S. S.; Lam, Y. M.; Grätzel, M.; Mhaisalkar, S.; Sum, T. C. Long-range balanced electron- and hole-transport lengths in organic-inorganic CH 3 NH 3 Pb I 3 . Science 2013 , 342 , 344–347
- 7Wehrenfennig et al. 2014 Wehrenfennig, C.; Eperon, G. E.; Johnston, M. B.; Snaith, H. J.; Herz, L. M. High charge carrier mobilities and lifetimes in organolead trihalide perovskites. Adv. Mater. 2014 , 26 , 1584–1589
- 8Kojima et al. 2009 Kojima, A.; Teshima, K.; Shirai, Y.; Miyasaka, T. Organometal halide perovskites as visible-light sensitizers for photovoltaic cells. J. Am. Chem. Soc 2009 , 131 , 6050–6051