Far-Infrared Properties of the Bright, Gravitationally Lensed Quasar J0439+1634 at z=6.5
Jinyi Yang, Bram Venemans, Feige Wang, Xiaohui Fan, Mladen Novak,, Roberto Decarli, Fabian Walter, Minghao Yue, Emmanuel Momjian, Charles R., Keeton, Ran Wang, Ann Zabludoff, Xue-Bing Wu, and Fuyan Bian

TL;DR
This study presents detailed far-infrared and radio observations of the most distant gravitationally lensed quasar at z=6.5, revealing its dust, gas, and emission line properties, and providing insights into early universe galaxy conditions.
Contribution
First detailed multi-wavelength analysis of a z=6.5 gravitationally lensed quasar, including dust, gas, and line emission, with new measurements of its physical properties.
Findings
Brightest FIR quasar at z>6 with strong [CII] emission
Molecular gas mass estimated between 3.9-8.9 x 10^{10} μ^{-1} M_sun
Evidence for complex photodissociation regions
Abstract
We present IRAM/NOEMA, JCMT/SCUBA-2 and VLA observations of the most distant known gravitationally lensed quasar J0439+1634 at z = 6.5. We detect strong dust emission, [CII] 158 m, [CI] 369 m, [OI] 146 m, CO(6-5), CO(7-6), CO(9-8), CO(10-9), HO , and HO lines as well as a weak radio continuum. The strong [CII] line yields a systemic redshift of the host galaxy to be z=6.51880.0001. The magnification makes J0439+1634 the far-infrared (FIR) brightest quasar at z > 6 known, with the brightest [CII] line yet detected at this redshift. The FIR luminosity is (3.40.2)10 , where 2.6 - 6.6 is the magnification of the host galaxy, estimated based on the lensing configuration from HST imaging. We estimate the dust mass to be (2.20.1)10…
Click any figure to enlarge with its caption.
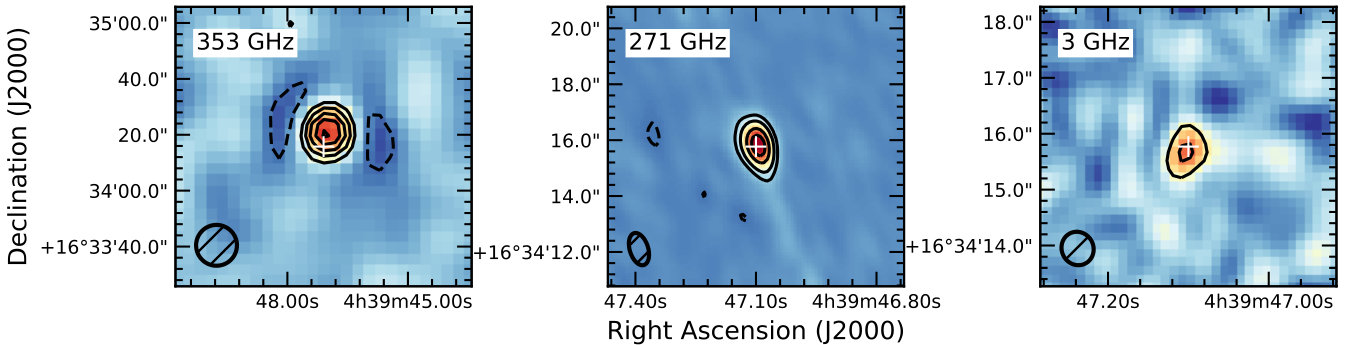 Figure 1
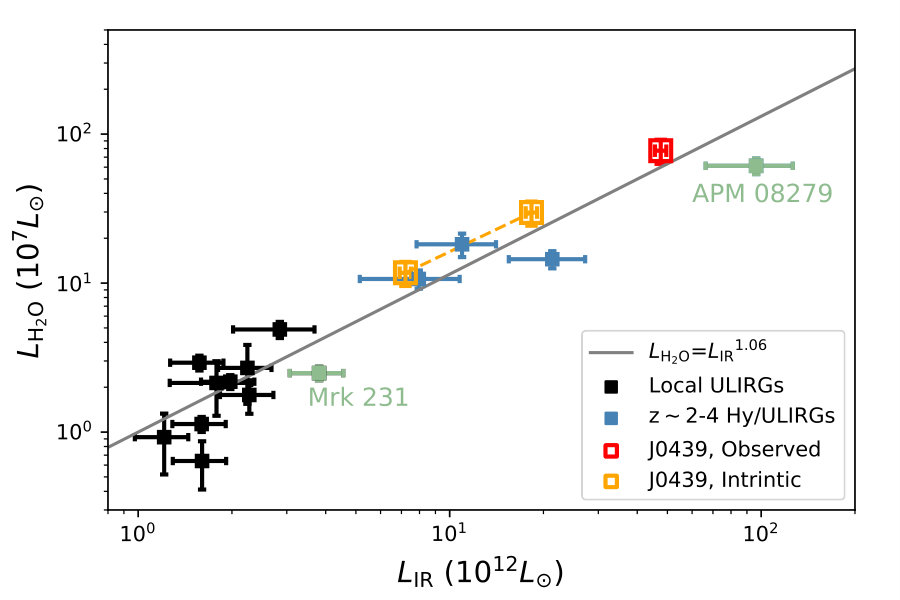 Figure 2
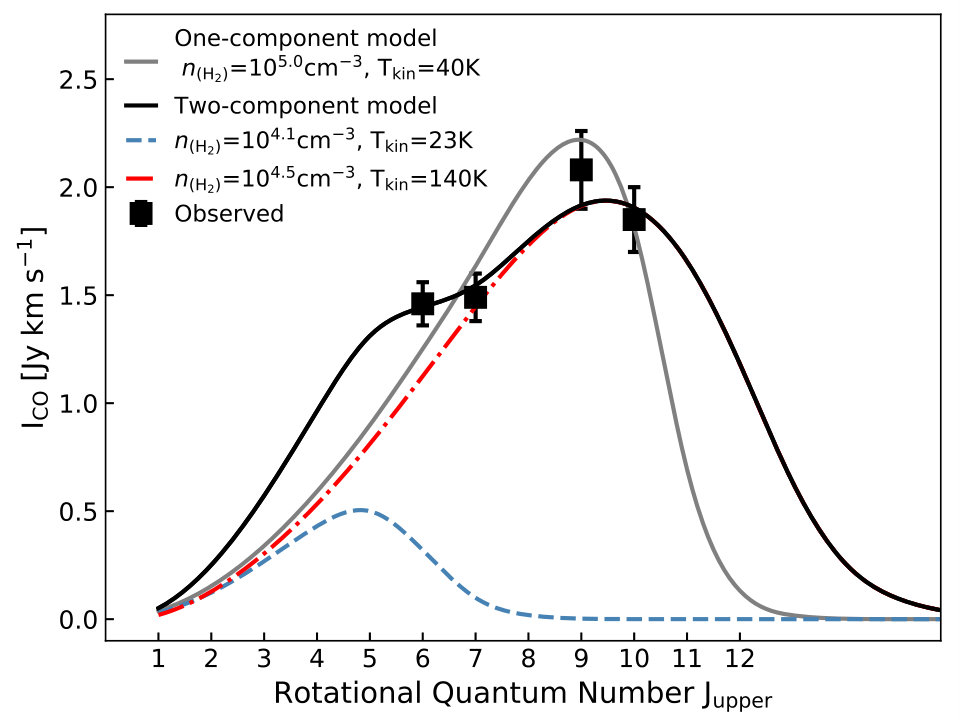 Figure 3
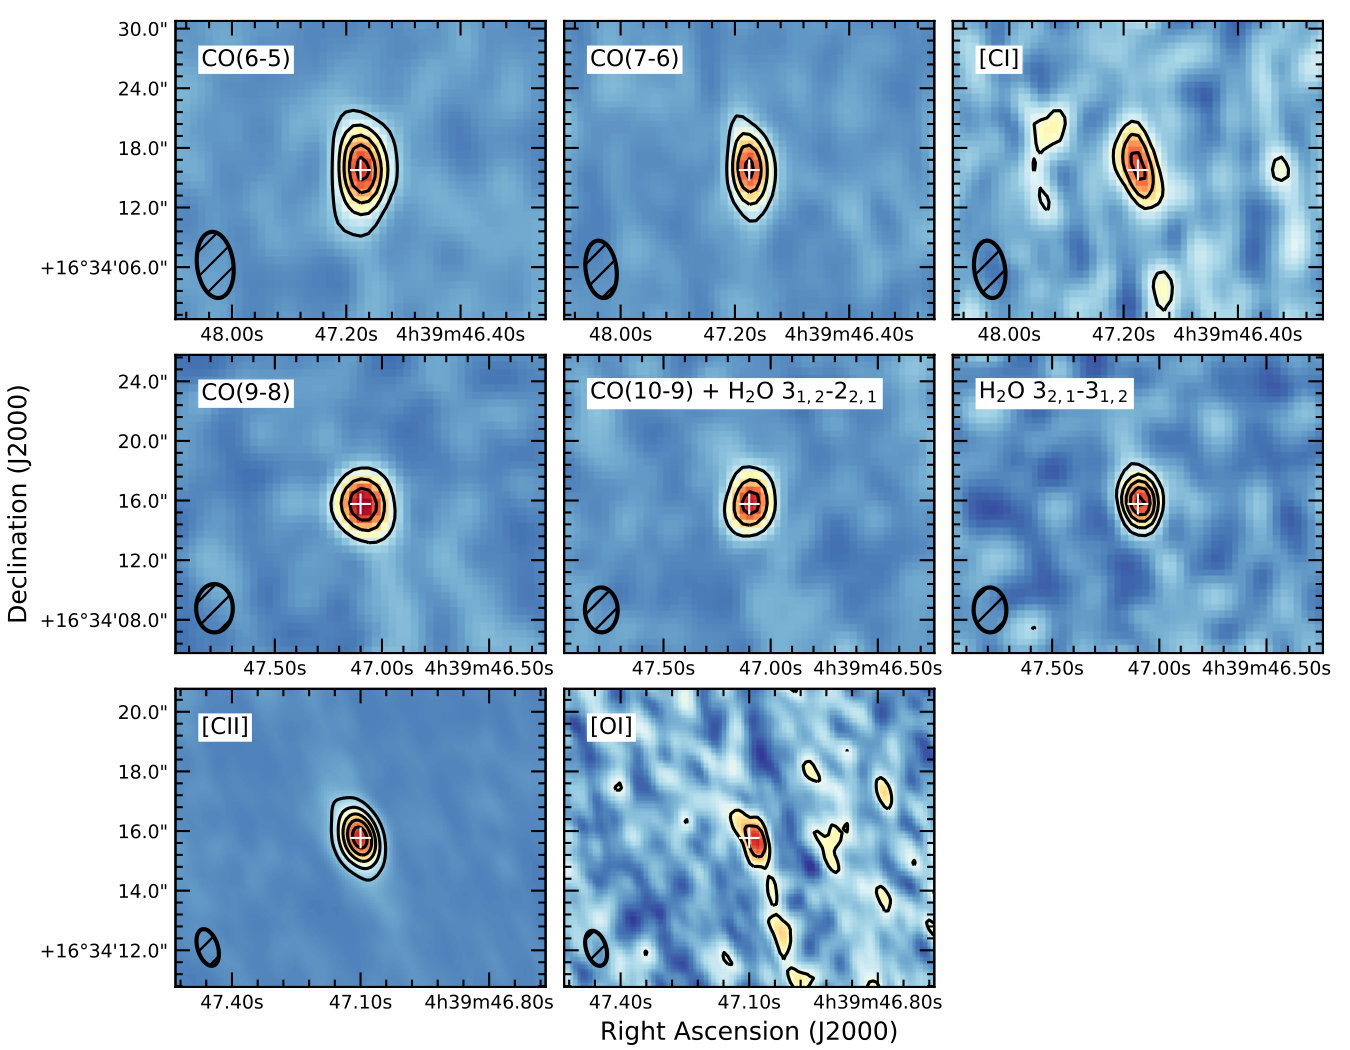 Figure 4
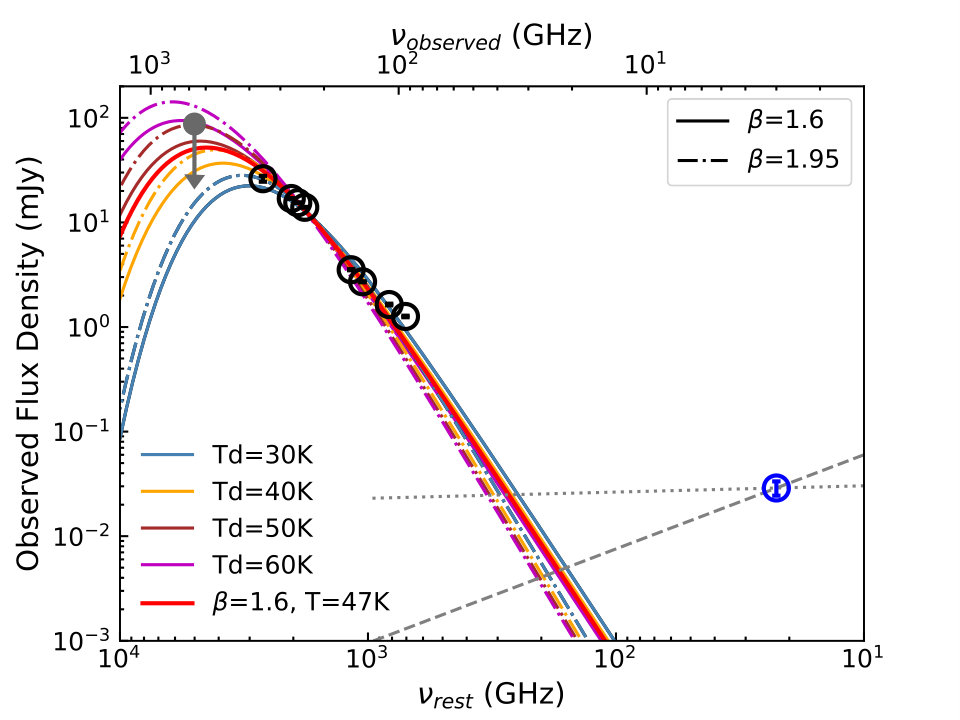 Figure 5
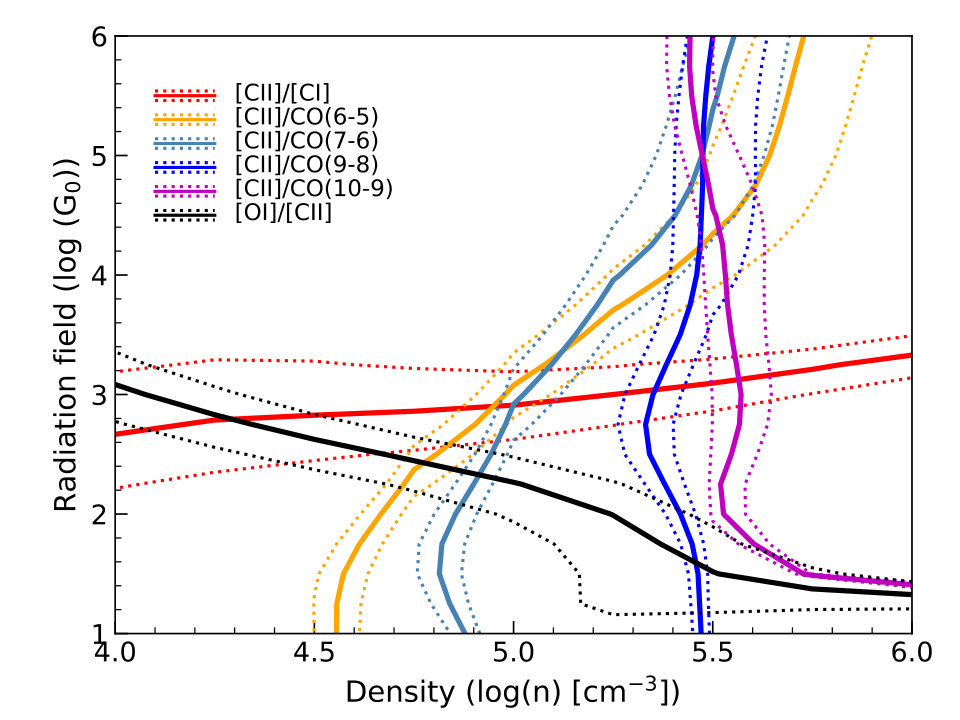 Figure 6
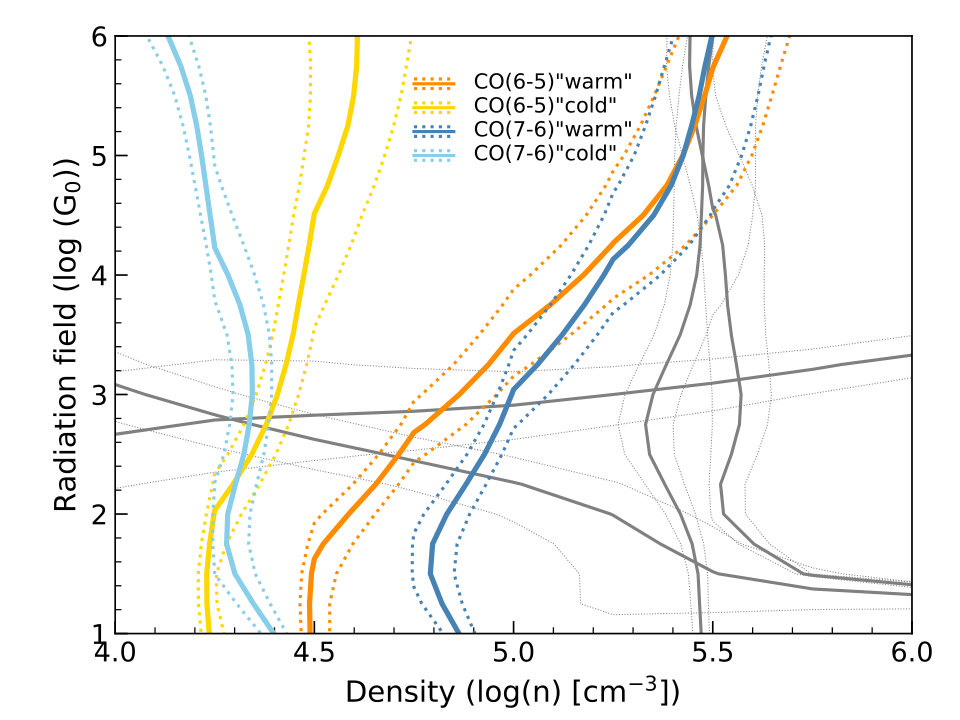 Figure 7
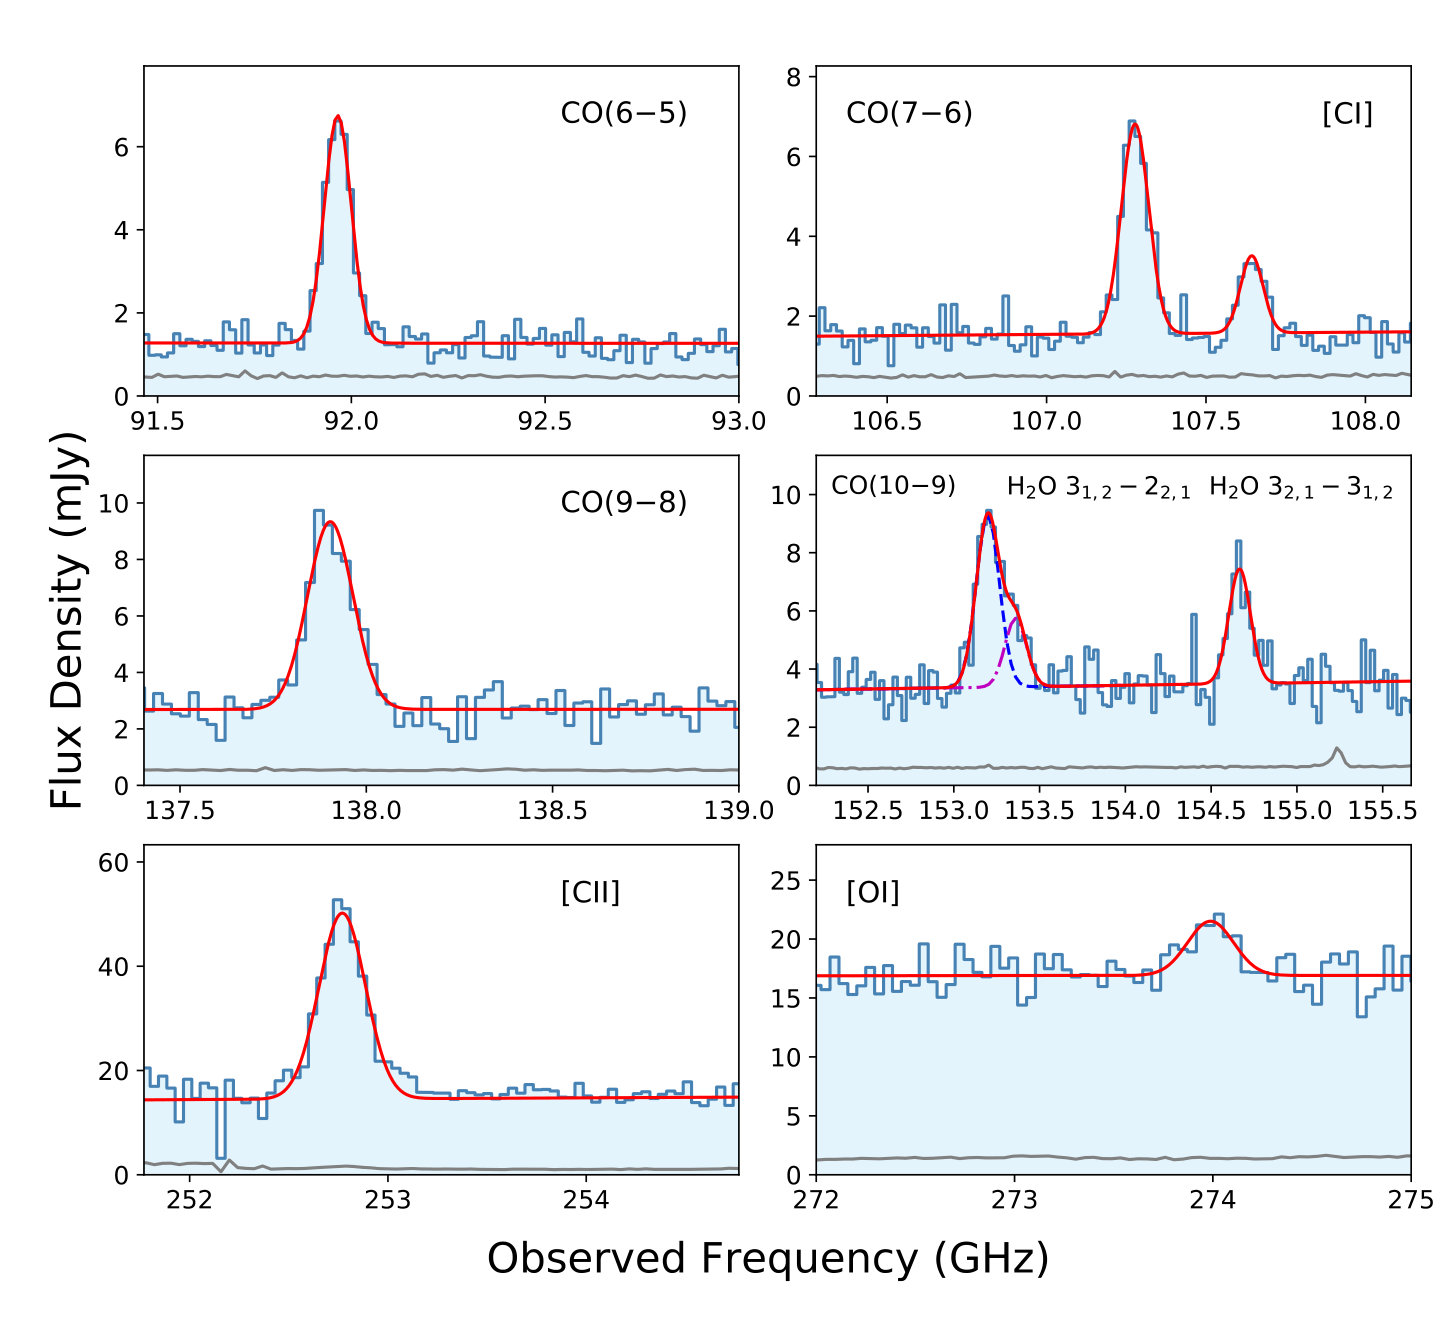 Figure 8
| R.A. (J2000) | 04h39m4710 |
|---|---|
| Decl. (J2000) | 16∘34′1577 |
| 6.51880.0002 | |
| (Jy km s-1) | 11.70.8 |
| FWHM[CII] (km s-1) | 328.118.0 |
| (Jy km s-1) | 1.50.1 |
| FWHMCO(6-5) (km s-1) | 266.015.8 |
| (Jy km s-1) | 1.50.1 |
| FWHMCO(7-6) (km s-1) | 282.718.0 |
| (Jy km s-1) | 2.10.2 |
| FWHMCO(9-8) (km s-1) | 312.522.4 |
| (Jy km s-1) | 1.90.2 |
| FWHMCO(10-9)aaWe fix the FWHM of CO(10–9) line to that measured from CO(9–8) line. (km s-1) | 312.517.9 |
| (Jy km s-1) | 0.50.1 |
| FWHM[CI] (km s-1) | 232.036.6 |
| (Jy km s-1) | 1.40.3 |
| FWHM[OI] (km s-1) | 298.956.1 |
| (Jy km s-1) | 0.90.2 |
| FWHMbbWe fix the FWHM of H2O line to that measured from H2O line. (km s-1) | 288.442.5 |
| (Jy km s-1) | 1.10.2 |
| FWHM (km s-1) | 288.444.4 |
| S (mJy) | 87.3 |
| S (mJy) | 26.21.7 |
| S (mJy) | 16.90.1 |
| S (mJy) | 15.50.1 |
| S (mJy) | 14.00.1 |
| S (mJy) | 3.50.04 |
| S (mJy) | 2.70.03 |
| S (mJy) | 1.60.03 |
| S (mJy) | 1.30.03 |
| S (Jy) | 28.94.5 |
| cc is the lens magnification of host galaxy (see Section 3). | 2.6–6.6 |
| () | (3.40.2)1013 |
| () | (4.80.2)1013 |
| () | (1.20.1)1010 |
| (K km s-1 pc2) | (5.70.4)1010 |
| () | (2.00.4)108 |
| (K km s-1 pc2) | (1.20.2)1010 |
| SFRTIR ( yr-1) | 7080 |
| SFR[CII] ( yr-1) | 1000 – 6000 |
| () | (2.20.1)109 |
| () | (2.60.5)107 |
| () | (3.70.3) |
| ()ddMolecular gas mass derived from the CO(1–0) luminosity, assuming a luminosity-to-gas mass conversion factor of = 0.8(K km s-1 pc2)-1. | 5.4 1010 |
| ()eeMolecular gas mass derived from the atomic carbon mass, assuming a carbon abundance of X[C I]= (8.43.5) . | (3.9 – 8.9) 1010 |
Peer Reviews
No public reviews on file for this paper yet. If you reviewed it on a platform where reviews are public (OpenReview, ICLR, NeurIPS, ICML), you can paste yours below so the community can read it here.
Videos
No videos yet. Explain this paper in a talk, walkthrough, or lecture? Add one.
Far-Infrared Properties of the Bright, Gravitationally Lensed Quasar J0439+1634 at =6.5
Jinyi Yang
Steward Observatory, University of Arizona, 933 N Cherry Ave, Tucson, AZ, USA
Bram Venemans
Max-Planck Institute for Astronomy, Königstuhl 17, D-69117 Heidelberg, Germany
Feige Wang
Department of Physics, University of California, Santa Barbara, CA 93106-9530, USA
Xiaohui Fan
Steward Observatory, University of Arizona, 933 N Cherry Ave, Tucson, AZ, USA
Mladen Novak
Max-Planck Institute for Astronomy, Königstuhl 17, D-69117 Heidelberg, Germany
Roberto Decarli
Osservatorio Astronomico di Bologna, via Gobetti 93/3, I-40129 Bologna, Italy
Fabian Walter
Max-Planck Institute for Astronomy, Königstuhl 17, D-69117 Heidelberg, Germany
Minghao Yue
Steward Observatory, University of Arizona, 933 N Cherry Ave, Tucson, AZ, USA
Emmanuel Momjian
National Radio Astronomy Observatory, P. O. Box O, Socorro, NM, 87801, USA
Charles R. Keeton
Department of Physics and Astronomy, Rutgers University, Piscataway, NJ 08854
Ran Wang
Kavli Institute for Astronomy and Astrophysics, Peking University, Beijing 100871, China
Ann Zabludoff
Steward Observatory, University of Arizona, 933 N Cherry Ave, Tucson, AZ, USA
Xue-Bing Wu
Kavli Institute for Astronomy and Astrophysics, Peking University, Beijing 100871, China
Department of Astronomy, School of Physics, Peking University, Beijing 100871, China
Fuyan Bian
European southern Observatory, Alonso de Córdova 3107, Casilla 19001, Vitacura, Santiago 19, Chile
Abstract
We present IRAM/NOEMA, JCMT/SCUBA-2 and VLA observations of the most distant known gravitationally lensed quasar J0439+1634 at . We detect strong dust emission, [C II] 158 m, [C I] 369 m, [O I] 146 m, CO(6–5), CO(7–6), CO(9–8), CO(10–9), H2O , and H2O lines as well as a weak radio continuum. The strong [C II] line yields a systemic redshift of the host galaxy to be . The magnification makes J0439+1634 the far-infrared (FIR) brightest quasar at known, with the brightest [C II] line yet detected at this redshift. The FIR luminosity is (3.40.2)1013 , where 2.6 – 6.6 is the magnification of the host galaxy, estimated based on the lensing configuration from HST imaging. We estimate the dust mass to be (2.20.1)109 . The CO Spectral Line Energy Distribution using four CO lines is best fit by a two-component model of the molecular gas excitation. The estimates of molecular gas mass derived from CO lines and atomic carbon mass are consistent, in the range of 3.9 – 8.9 10 . The [C II]/[C I], [C II]/CO, and [O I]/[C II] line luminosity ratios suggest a photodissociation region model with more than one component. The ratio of H2O line luminosity to is consistent with values in local and high redshift ultra-/hyper-luminous infrared galaxies. The VLA observations reveal an unresolved radio continuum source, and indicate that J0439+1634 is a radio quiet quasar with R = 0.05 – 0.17.
cosmology: observations — galaxies: high-redshift — galaxies: ISM — galaxies: active
††facilities: IRAM:NOEMA, JCMT, VLA
1 Introduction
As the most luminous non-transient objects, quasars at 6 are unique probes for the investigation of supermassive black holes (SMBHs) and their host galaxies at early cosmic time. Up to date, more than 150 quasars have been discovered at 6, with the highest redshift at 7.54 (Bañados et al., 2018). Detections of such objects indicate the existence of up to (ten) billion SMBHs and place the strongest constraints on SMBH-galaxy coevolution at early epochs. A large fraction of quasars have been detected with significant [C ii], CO and dust emission in the rest-frame far-infrared (FIR). The sub-millimeter/millimeter (submm/mm) observations suggest that the vast majority of the quasar host galaxies are intensely forming stars, at rates of a few 100 to 1000 yr*-1* (e.g. Bertoldi et al., 2003a; Maiolino et al., 2005; Walter et al., 2009; Wang et al., 2013; Willott et al., 2015; Venemans et al., 2016, 2017a, 2017b; Decarli et al., 2018; Venemans et al., 2018), supported by large reservoirs of molecular gas, resulting in bright CO detections (e.g. Bertoldi et al., 2003b; Walter et al., 2003, 2004; Wang et al., 2011; Venemans et al., 2017c).
Strong gravitational lensing provides a unique probe of the properties of quasars and their host galaxies. Lensing not only magnifies fluxes, but also stretches images, resulting in higher effective spatial resolution and better separation of the central quasar and host galaxy (Carilli et al., 2003; Peng et al., 2006; Treu, 2010). Lensed quasars at 3 and 4 have been important tools for our understanding of interstellar medium (ISM) in high redshift quasar hosts (e.g., Weiß et al., 2007). At higher redshift (), lensed quasars could be powerful tools to study those distant supermassive black holes (SMBHs) and their host galaxies that are not easily resolved by current facilities. However, at , only two lensed quasars at (McGreer et al., 2010; More et al., 2016) were known until recently, although more than 200 quasars at have been observed with HST at 01 resolution (Richards et al., 2004, 2006). The lack of high-redshift lensed quasars has been attributed to either a reduced magnification bias due to a flat quasar luminosity function or a strong selection effect against lensed objects in morphology or color selection used in high-redshift quasar surveys.
Our new wide-area quasar survey (Wang et al., 2018; Yang et al., 2019) in a 20,000 field has discovered the most distant known lensed quasar at , UHS J043947.08+163415.7 (hereafter J0439+1634 Fan et al., 2019, hereafter Paper I). The Mg II-based redshift is . In Paper I, based on our HST FR782N and FR853N imaging which has a spatial resolution of 0075, we fit a singular isothermal ellipsoid lensing model and obtain the best-fit three-images lensing model of quasar. The high magnification ( 51.31.4 at optical wavelengths111This magnification factor is derived from HST imaging for the central quasar; the total magnification for the extended host galaxy is usually significantly smaller, see Section 3.) makes this quasar the brightest observed quasar at at optical and near-infrared wavelengths. Follow-up observations with the James Clerk Maxwell Telescope (JCMT) indicate that J0439+1634 is also the brightest far-infrared (FIR) emitter at (Paper I). In this paper, we report new FIR and radio observations of J0439+1634 with the IRAM NOrthern Extended Millimeter Array (IRAM/NOEMA), JCMT, and Karl G. Jansky Very Large Array (VLA) and the detections of gas, dust emission, and radio continuum emission. We describe the observations in Section 2. The high quality detections of dust continuum and various molecular and atomic emission lines allow detailed studies of the inter stellar medium in the quasar host, which are presented in Section 3. The summary is given in Section 4. All results below refer to a CDM cosmology with parameters = 0.7, = 0.3, and H0 = 70 .
2 Observations
2.1 NOEMA Observations
We used IRAM/NOEMA to detect the [C ii], CO(10–9), CO(9–8), CO(7–6), CO(6–5), [C i] 369 m (hereafter [C i]), [O I] 146 m (hereafter [O I]), and water emission lines from quasar host through two programs in 2018 Summer and Winter. The observations were carried out from 2018 July to December with the array in D and C configurations, using 7–10 antennas. We used the PloyFiX correlator which has two 7.744 GHz sidebands separated by 7.744 GHz (centers are separated by 15.488 GHz). The NOEMA data have been reduced using the latest version of the GILDAS222http://www.iram.fr/IRAMFR/GILDAS software.
For the first program in 2018 Summer, we designed three set-ups. The CO(6–5), CO(7–6), and [C i] lines were covered by a single setting with receiver 1 (3 mm) tuned at 107.410 GHz. The CO(9–8), CO(10–9), H2O , and H2O lines were observed with receiver 2 (2 mm) tuned at 153.395 GHz. The [C ii] line was observed in receiver 3 (1 mm) with tuning frequency at 253.068 GHz. Quasars 0507+179, J0440+146 and 0446+112 were used as amplitude and phase calibrators. Radio sources 3C84 and 3C454.3 were observed as bandpass calibrators. Stars MWC349 and LKHA101 were used to set the absolute flux density scale. The total on-source integration time in the receivers 1, 2, and 3 were 1.6, 2.8, and 1.3 hours (8 antenna equivalent), respectively. The synthesized beams are , , and in the 1 mm, 2 mm, and 3 mm bands, respectively. The final 1 mm, 2 mm, and 3 mm cubes reach the sensitivity of 2.2 mJy beam*-1*, 0.7 mJy beam*-1*, and 0.5 mJy beam*-1* per 50 km s*-1* channel (1-). In the second program in 2018 Winter, the [C II] and [O I] lines were covered by one setting with the receiver 3 (1mm) with a tuning frequency of 270.244 GHz. The on-source integration time in this observation is 3.13 hours (9 antenna equivalent). The synthesized beam is and final data cube reaches a 1.5 mJy beam*-1* per 50 km s*-1* sensitivity (1-).
From the NOEMA observations, we obtained high quality detections of the CO(6–5), CO(7–6), CO(9–8), CO(10–9), [C II], [C I], [O I], H2O , and H2O emission lines (see Figure 1 & 2). The dust continuum is significantly detected in all cubes. All the NOEMA detections are spatially unresolved. Measured line fluxes and continuum flux densities are summarized in Table 1 and Section 3. We only include statistical errors and the systematic flux density calibration uncertainties (of the order of 15%) are not taken into account.
2.2 JCMT Observations
We observed the 450 m (observed frame, 666 GHz) and 850 m (353 GHz) dust continuum from J0439+1634 using the Submillimetre Common-User Bolometer Array 2 (SCUBA-2; Holland et al., 2013) on the JCMT in 2018 February. The observations were carried out in Band 2 weather conditions (i.e., 0.05 0.008), and in ′′CV DAISY′′ mode. The effective beam size of SCUBA-2 has a diameter of 98 at 450 m and 146 at 850 m. Our target was observed for 1.1 hours on source time (two 34 min scans). The data were reduced using the STARLINK SCUBA-2 pipeline for faint point sources (Chapin et al., 2013). The 1 sensitivities in 450 m and 850 m are 29.12 mJy beam*-1* and and 1.69 mJy beam*-1*, respectively. From the JCMT observations, we obtained an 850 m flux density of 26.201.68 mJy and a 2 signal of 65.7129.12 mJy at 450 m, which is measured at the peak flux pixel of the 850 m detection.
2.3 VLA Observations
We observed the radio continuum emission from J0439+1634 using VLA DDT time in S band (2–4 GHz) with the A configuration. The observed reference frequency of 3 GHz corresponds to the rest-frame frequency of 22.6 GHz for this quasar. The 8-bit samplers were utilized to cover the 2 GHz span of the S-band receiver. The total telescope time was 3 hours (2.1 hours on-source). We used J0440+1437 for complex gain calibration and 3C138 for bandpass and flux density scale calibration. The data were reduced by the the Common Astronomy Software Applications package (CASA) and the VLA calibration pipeline. The synthesized beam was , and the 1 rms noise of continuum image was 4.5 Jy beam*-1*. The VLA 3 GHz image shows an unresolved radio continuum source with a flux density of 28.94.5 Jy.
3 The Host Galaxy of J0439+1634
The NOEMA spectra are shown in Figure 2 and all detections are summarized in Table 1. The detections of multi-emission lines and dust continuum at multiple frequencies allow us to investigate the properties of gas and dust in the host galaxy of J0439+1634. All measurements of emission lines and derived properties such as gas mass, dust mass, and star formation rate (SFR) are also listed in Table 1. The position of the quasar host derived from the [C II] emission, R.A. = 04h39m4710 and Decl. = 16∘34′1577, is consistent with the optical location of the quasar (Paper I).
J0439+1634 is a compact lensed quasar with 02 separation, and has only been resolved in the HST image with a spatial resolution of 0075 (Paper I). The HST image was designed to image quasar’s Ly emission line. The two-orbit narrow-band imaging is relatively shallow and is dominated by emission from the central AGN. Therefore, we can only model the lensing configuration of quasar base on HST image (see details in Paper I). The lensing configuration of host galaxy, in particular, the total magnification could be significantly different since the quasar is a point source, while the host galaxy is an extended source with unclear morphology, inclination angle, and position angle. The source was not spatially resolved in our NOEMA, JCMT or VLA observations. Therefore, all measurements of intrinsic properties of the host galaxy are made based on the simulated lensing model of host galaxy and the simulation is based on the lensing configuration of quasar.
We use the isothermal ellipsoid lens model from Fan et al. (2019), including uncertainties sampled with Markov chain Monte Carlo methods. We assume the host galaxy as an exponential disk centered on the inferred position of the quasar. We set a grid of effective radius (0.1*′′* to 0.25*′′*) based on the typical size of quasar host galaxies at this redshift (Wang et al., 2013) and also assume a range of the projected ellipticity (0.0–0.8) with random position angles. The median magnification of the host galaxy ranges from 2.6 to 4.9 across the grid of effective radius and ellipticity; over the whole grid, the 95% confidence interval for the magnification is 2.6–6.6. Note that the total magnification of the host galaxy is significantly smaller than that of the central quasar () because the host galaxy is extended. For the rest of the paper, we will use as the magnification factor of the host galaxy. Our forthcoming high resolution ALMA imaging will directly resolve the host galaxy into a lensed arc, and allow detailed lensing modelling to measure the size and shape of the quasar host galaxy, and to derive its magnification factor accurately.
In a lensed system, the different angular size of extended emissions from different lines or continuum (e.g., if the dust emission is more compact than the [C II] emitting region) could result in differential lensing effect. Differential lensing could also distort the velocity profile of emission lines, depending on how the kinematic structure of the source couples with the lensing magnification pattern (Rivera et al., 2018; Yang et al., 2019). The emission lines of J0439 from NOEMA observations are well fitted by a single Gaussian profile except for the blended CO(10–9) and H2O and the possible wings of [C II] line (see Figure 2 and Section 3.1). Therefore, we do not include any discussion of this effect in this paper, and until we resolve the host we assume the same magnification of all FIR emission. The intrinsic properties measured in this paper, especially the ratios between different parameters, could nevertheless be affected by differential lensing. Giving these complications, in this paper, we simply report the observed values of quasar host galaxy properties with a common magnification factor .
3.1 Continuum Emission and Infrared (IR) Luminosity
We detect dust continuum at observed frame frequencies of 352.7 GHz from JCMT, and 271 GHz, 254 GHz, 239 GHz, 155 GHz, 139 GHz, 109 GHz, and 93 GHz from NOEMA. The dust continuum from the NOEMA observations used in this section are measured by averaging spectra over all channels within the line free regions in each sideband. The dust continuum is detected with high signal-to-ratio in the NOEMA spectra, as shown in Figure 1 and Figure 2. All flux densities are listed in Table 1. The JCMT observation at 666.2 GHz show a 3 upper limit.
To estimate the far-infrared (FIR, rest-frame 42.5–122.5 m) luminosity , total infrared (TIR, rest-frame 8–1000 m) luminosity and the dust mass, we fit the dust emission with an optically thin grey body following the literature (e.g., Beelen et al., 2006). We fit a set of models with different dust temperatures and fixed the emissivity index = 1.6 or 1.95, as shown in Figure 3. We take the effect of the cosmic microwave background (CMB) on the dust emission into account (e.g., da Cunha et al., 2013). We exclude the 666.2 GHz upper limit for the model fitting. We obtain a best-fit (least ) dust temperature of = 39 9 K at fixed =1.6, consistent with the canonical value of = 47 K (Beelen et al., 2006). If we fix the to 47 K, the best-fitting value of is 1.40.2. The temperature strongly depends on the flux densities measured near the peak of the dust spectral energy distribution (SED). Stronger constraints on the dust temperature require additional photometry at higher frequency. Therefore, we assume the = 47 K and = 1.6 for related measurements. With this assumption, the luminosities derived from the grey body model are = (3.40.2) 1013 and = (4.80.2) 1013 . The derived FIR luminosity is the highest for all known high redshift quasars (observed value before correcting for lensing magnification).
We estimate the SFR from the based on the local scaling relation from Murphy et al. (2011) and assuming the is dominated by star formation. We obtain an SFR of 7080 yr*-1*. Any contribution from quasar to the IR luminosity will result in an overestimation of the SFR. The dust mass based on the assumption of dust emission model is = 2.20.1109 , where the uncertainty is only from fitting. Some recent works suggest that the relatively low metallicity galaxy template Haro 11 could provide a better fit to the IR SED of high redshift quasar(Lyu et al., 2016; De Rossi et al., 2018). As a comparison, we also fit the observed data with the Haro 11 template and a AGN template from Lyu et al. (2016), which results in a 1.6 times higher TIR luminosity, consistent with the systematic difference between the optically thin grey body model and Haro 11 template (De Rossi et al., 2018).
The VLA 3 GHz detection represents the rest-frame 22.6 GHz radio emission from quasar. We calculate the radio-loudness by adopting the definition of , where the is the optical flux density at rest frame 2500 Å, measured from the NIR spectrum of J0439+1634. The rest frame 5GHz flux density is estimated from the VLA detection assuming a power-law radio continuum (). The radio-loudness is constrained to be = 0.05 with a flat continuum , and = 0.17 with a steep slope of , which indicates that J0439+1634 is a radio quiet quasar. Based on the current lensing models, if the radio emission is dominated by the quasar, the intrinsic radio emission will be – Hz*-1* assuming a slope of . On the other hand, based on the radio–FIR relation (Yun et al., 2001; Wang et al., 2007), the radio emission from host could be expected to be Hz*-1* when assuming the is dominated by star formation and considering the scatter of the radio–FIR relation. This result suggests that the host galaxy contributes a significant fraction of radio emission, which could be higher than or comparable to that from quasar. Currently, only one frequency detection of radio continuum and the uncertain lensing configuration limit the more detailed investigation of radio emission properties.
3.2 [C II] Emission Line
The [C II] 158 m emission line is detected from NOEMA observations (Figure 2) with a line peak flux density of 36 mJy, the brightest [C II] line detected from any quasar at (e.g., Decarli et al., 2018). We extract the spectrum from the peak pixel in the data cube and fit the emission line with a Gaussian profile. The [C II] line tentatively shows wings that can not be matched by a single Gaussian fit (see Figure 2). Due to the relatively low signal-to-noise ratio (S/N) at the wings, we adopt a single Gaussian profile as the best fit. Future high S/N observations are needed to confirm and to investigate the nature of the extended wing of [C II] line. The redshift measured from [C II] line is = 6.51880.0002, which is slightly higher than the Mg II -based redshift (), indicating a 311 km s*-1* blueshift of the Mg II line. This blue shift is similar to shifts between Mg II and [C II] found in other quasars (e.g., several hundred km s*-1*; Mazzucchelli et al., 2017; Decarli et al., 2018). We obtain a line flux of = 11.70.8 Jy km s*-1*, and a FWHM[CII] = 328.118.0 km s*-1*, corresponding to a line luminosity of = (1.20.1) 1010 ( = (5.70.4)1010 K km s*-1* pc2).
The detection of the [C II] line allows us to derive a -based SFR. We use the SFR– relations for high-redshift () galaxies from De Looze et al. (2014):
[TABLE]
which has a systematic uncertainty of a factor of 2.5. Therefore, we obtain an observed SFR[CII] of 1000 – 6000 yr*-1*, slightly lower than the SFRTIR. The [C II] -to-FIR luminosity ratio / is (3.1–4.1) , within the range of the / distribution of previously known quasars (Venemans et al., 2017b; Decarli et al., 2018).
The [C II] line also enables us to derive the mass of singly ionized carbon . Following Venemans et al. (2017c), we calculate the using
[TABLE]
where is the conversion between pc2 and cm2, is the mass of a carbon atom, =2.29 s*-1* is the Einstein coefficient (Nussbaumer & Storey, 1981), is the C II partition function, is the excitation temperature and is the line luminosity in K km s*-1* pc2. We also assume the K (e.g., Meijerink et al., 2007; Venemans et al., 2017b). The derived is (3.7 0.3) with K and 3.1 if K.
Although the NOEMA observations do not resolve the source, the [C II] line could provide a constraint on the dynamical mass to first order. In a dispersion-dominated system, the dynamical mass can be estimated as . We adopt the velocity dispersion estimated from the FWHM[CII] of Gaussian fit to the emission line and assume a radius of the [C II] line emitting region of kpc, the mean value of the quasar sample from Decarli et al. (2018), which results in a dynamical mass of . Alternatively, the [C II] emission might originate from a thin rotating disk with an inclination angle (e.g., Wang et al., 2013; Willott et al., 2015; Venemans et al., 2016, 2017b). In this case, the dynamical mass is computed as = (0.75 FWHMsin()) (e.g., Ho, 2007; Wang et al., 2013). Since we assume an intrinsic radius of 2.8 kpc, the host galaxy dynamical mass is estimated directly from the line width here and not affected by the value of (except for the potential differential lensing effect) . The median value of the inclination angle of 6 quasars is (e.g., Wang et al., 2013; Venemans et al., 2017b). Adopting this inclination angle, we obtain . The lensing-corrected Mg II-based black hole mass of J0439+1634 is 6.89 M*⊙* (Paper I). Thus, the ratio is 0.011 – 0.036, which is consistent with the measurements of quasar sample (Decarli et al., 2018) and higher than the typical value 0.002 of local galaxies.
3.3 CO Lines and Molecular Gas Mass
With the NOEMA observations, we detect four CO emission lines: CO(6–5), CO(7–6), CO(9–8) and CO(10–9) (Figure 2). To measure the line luminosities, we fit each emission line with a Gaussian profile. The measured line fluxes and FWHMs are summarized in Table 1. The CO(10–9) line is blended with water vapor emission H2O line. We fit the blended line with two Gaussian components and fixed FWHMs. We fix the FWHM of one component to the value measured from CO(9–8) line and assume the other one to be the same FHWM to that of H2O line. With multiple CO lines, we can investigate the physical condition (e.g., temperature and density) of molecular gas through the CO spectral line energy distribution (COSLED). We fit the COSLED with large velocity gradient (LVG) model using fitting. We use the one-dimensional non-LTE (Local Thermodynamic Equilibrium) radiative transfer code, RADEX, developed by van der Tak et al. (2007). We use both a single LVG model and a two-component model for the fitting, as shown in Figure 4. We set the background temperature to be the CMB temperature at = 6.5188 of 20.5 K. The best-fit of one-component model has temperature = 40 K and gas density , while the best-fit two-component model includes a “cold” component with = 23 K and , and a “warm” component with = 140 K and .
The current models can be used to estimate the CO(1–0) line luminosity and further constrain the molecular gas mass, although the COSLED is still uncertain due to the lack of low- CO line. The one-component model results in a CO(1–0) line flux of 0.04 Jy km s*-1and a line luminosity of ( K km s-1* pc2). The two-component model provides 0.05 Jy km s*-1and ( K km s-1* pc2). Therefore, the [C II] -to- CO(1–0) luminosity ratios from one-component and two-component models are 5200 and 3900, respectively. The [C II] -to-CO(1–0) luminosity ratio of three quasars given by Venemans et al. (2017c) is 2500–4200, and the typical value measured from local and star forming galaxies is 4100 (Stacey et al., 1991; Gullberg et al., 2015). The [C II] -to-CO(1–0) luminosity ratio derived from two-component model is more consistent with these previous measurements, although the one-component model can not be ruled out either. We adopt the two-component model to estimate the molecular gas mass using and assuming the luminosity-to-gas mass conversion factor of = 0.8(K km s*-1* pc2)-1. The molecular gas mass is estimated as 5.4 1010 , consistent with the value measured from atomic gas mass (see Table 1).
3.4 [C I] and Atomic Carbon Mass
The [C I] emission line has a line luminosity of = 2.040.41 108 ( = 1.200.241010 K km s*-1* pc2) and FWHM[CI] = 232.0436.59 km s*-1*. We can estimate the atomic carbon mass based on the [C I] line using the following relation between [C I] brightness and the mass in neutral carbon from Weiß et al. (2003, 2005) assuming the [C I] emission is optically thin:
[TABLE]
where is the C I partition function, K and K are the energies above the ground state. We assume the excitation temperature to K (see, e.g. Walter et al., 2011) and obtain the atomic carbon mass of = (2.60.5) 107 . Assuming the atomic carbon abundance (X[C I] = ) to be X[C I] = (8.4) , following Walter et al. (2011) and Venemans et al. (2017c), we can estimate an independent molecular gas of = (3.9 – 8.9) 1010 . This is consistent with the molecular gas mass estimated from CO lines derived in the previous section.
3.5 The Characteristics of the ISM
The multiple FIR lines could place constraints on the physical properties of the ISM in the host galaxy through different line ratios. We compare the luminosity ratios of [C II]/[C I], [C II]/CO and [O I]/ [C II] observed from J0439+1634 to the predictions by the photodissociation regions (PDR) model from PDR Toolbox (Kaufman et al., 1999, 2006; Pound & Wolfire, 2008). A one-sided illuminated slab geometry is adopted in this PDR model. In reality, assuming spherical clouds, we would detect optical thin emission from both the front and the back of the cloud, but only detect optically thick emission from the front. Therefore, when we apply this model to observed data, we need to multiply the observed optically thick line flux by two or divide the observed optically thin emission by two to match the model. Here we divide the optically thin [C II] line emission by a factor of two. We also assume the fraction of [C II] emitted from PDR is 80%, considering the dust temperature and the correlations of local luminous infrared galaxies from Díaz-Santos et al. (2017).
The overlapped region of line ratios will constrain the gas density and the incident far-ultraviolet radiation field (in units of the Habing Field, , ergs cm*-2* s*-1*). As shown in Figure 5 (top panel), the four ratios of / overlap in a region with high radiation field , while the ratios of lower- CO (i.e., CO(6–5) and CO(7–6)) and ratios of higher- CO (i.e., CO(9–8) and CO(10–9)) are overlapping with / and / separately in regions with lower ( ). We also try to split the CO(6–5) and CO(7–6) lines based on the best-fit two-component model of COLSED in Figure 4, as shown in Figure 5 (Bottom panel). The “warm” components of CO(6–5) and CO(7–6) overlap with CO(9–8) and CO(10–9) at the region with high radiation field ( ) and high density ( ), while the “cold” components are overlapping with the ratios of / and / at the region having lower radiation field ( ) and lower density ( ). This result could be explained by a two-component model of CO lines, with a “cold” component dominated by the star formation and a “warm” component from other heating sources (e.g. AGN). However, we note that the simplified, one-cloud models of the ISM adopted here can be insufficient to encapsulate the full complexity of the ISM. In addition, the magnifications of different emission lines can introduce further complications.
3.6 Water Vapor Emission
Water vapor emission lines have been detected from galaxies and quasars, (e.g. van der Werf et al., 2011; Combes et al., 2012; Omont et al., 2013; Riechers et al., 2013). However, for quasars, only a tentative detection of two blended water emissions has been obtained (Bañados et al., 2015). From J0439+1634, two water vapor emission lines, H2O and H2O , are detected from the NOEMA observations with high S/N (see Figure 2). This is the first high quality detection of multiple water vapor emission lines from quasar host galaxy at .
A tight correlation between submm H2O lines () and total infrared luminosity () has been found in local and high redshift infrared galaxies (Yang et al., 2013, 2016), although the relation between submm H2O emission and AGN activity is still unclear. Yang et al. (2016) suggested a correlation between H2O line luminosity and total infrared luminosity as /() = (/())1.06±0.22, using a sample of local ultra-luminous infrared galaxies (ULIRGS) and high-redshift ( ) ULIRGS or hyper-luminous infrared galaxies. The luminosity of H2O detected of J0439+1634 is 7.4. The ratio of / follows the observed relation within scatter, as shown in Figure 6.
Previous studies (van der Werf et al., 2011; Yang et al., 2013, 2016) also show that strong-AGN-dominated sources may have smaller average ratios than those in star-forming-dominated galaxies. This could be explained by the very warm dust heated by the AGN. The higher dust temperature yields a higher IR luminosity, with only a modest increase in the rate of 75 m photons which dominates the excitation of H2O emission lines (Kirkpatrick et al., 2015; Yang et al., 2016). The / ratio of J0439+1634 is 15.4 , slightly above the value based on the correlation of Hy/ULIRGS as shown in Figure 6 and higher than the mean values of both local AGN-dominated sources (6.7) and local star-forming-dominated galaxies (10.8 ) from Yang et al. (2016), which could indicate a significant contribution from star formation to the IR radiation of J0439+1634.
4 Summary
We report FIR and radio observations of the gravitationally lensed quasar J0439+1634 at . Observations from NOEMA and JCMT have detected its dust continuum emission, multiple CO, [C I], [C II], [O I], and water vapor emission lines with very high quality. Their properties make the host of J0439+1634 the brightest quasar host known at high redshift in the FIR. The VLA 3 GHz imaging detects the radio continuum of J0439+1634 at rest frame 22.6 GHz. All these observations are spatially unresolved. The main results based on these observations are summarized as following.
- •
Based on multi-frequency continuum emission detected from NOEMA and JCMT, we model J0439+1634’s dust emission and estimate its FIR luminosity of = (3.40.2)1013 with = 2.6–6.6, TIR luminosity of = (4.80.2)1013 , SFRTIR = 7080 yr*-1*, and dust mass of = (2.20.1)109 .
- •
The [C II] line detected of J0439+1634 is the brightest [C II] line detected from source, with a peak flux density of 36 mJy and line luminosity of = (1.20.1) 1010 . The [C II] line also provides en estimates of -based SFR, SFR[CII] = 1000 – 6000 yr*-1*and the mass of singly ionized carbon, = (3.70.3) . The [C II] line also allows us to constrain its dynamical mass to first order.
- •
With the four CO lines, CO(6–5), CO(7–6), CO(9–8), and CO(10–9), we model the COSLED of J0439+1634 with a LVG model and find that a two-component excitation model is needed to explain the observations of its molecular gas, although the constrain still has large uncertainty due to the lack of low- and very high- emission lines. Using the two-component model, we estimate the CO(1–0) line luminosity and further constrain the molecular gas mass to be = 5.4 1010 .
- •
The [C I] line in J0439+1634 allows us to estimate the atomic carbon mass of = (2.60.5)107 and offers an independent constraint on the molecular gas mass, = (3.9 – 8.9) 1010 . We find that the molecular gas masses of J0439+1634 derived from CO(1–0) luminosity and atomic carbon mass are consistent.
- •
The line luminosity ratios between [C II], [C I], CO, and [O I] places a first constraint on the radiation field and gas density of ISM in the host galaxy of J0439+1634. Comparing with the the predicted luminosity ratios from the PDR model of Kaufman et al. (1999), to explain the result of J0439+1634, a PDR model including more than one component is required.
- •
The / luminosity ratio of J0439+1634 follows the – correlation of ULIRGS and is higher than the mean value of AGN-dominated sources, probably suggesting a signification contribution from star-formation to FIR luminosity.
- •
The VLA 3 GHz observations indicate that J0439+1634 is a radio quiet quasar with radio loudness = 0.05 – 0.17.
Future high resolution ALMA observations of J0439+1634 will fully resolve the [C II] and dust continuum emission of the quasar host galaxy and will refine the lensing model, allowing accurate measurements of the host dynamical mass and star formation surface density. Further high resolution imaging of multiple- CO emissions could spatially resolve the excitation condition of the molecular gas. In addition, future observations of multiple fine structure lines (e.g., [O I], [OIII], [NII]) and molecular emissions (e.g., low- and high- CO, HCN) will provide detailed measurements of ISM properties such as excitations and metallicities in the host galaxy of J0439+1634.
We thank Jianwei Lyu, George Rieke, Chentao Yang, and Chris Carilli for important discussions. J. Yang, X. Fan and M. Yue acknowledge support from the US NSF grant AST 15-15115 and NASA ADAP Grant NNX17AF28G. B.P.V. and F.W. acknowledge funding through the ERC grant “Cosmic Gas”. C. Keeton acknowledges support from US NSF grant AST-1716585. X.-B. Wu thanks the support by the National Key R&D Program of China (2016YFA0400703) and the National Science Foundation of China (11533001, 11721303). We are grateful to the JCMT and VLA for providing DDT observations. This work is based on observations carried our under project number S18DO and W18EI with the IRAM NOEMA Interferometer. IRAM is supported by INSU/CNRS (France), MPG (Germany), and IGN (Spain). The National Radio Astronomy Observatory is a facility of the National Science Foundation operated under cooperative agreement by Associated Universities, Inc.
The reference list from the paper itself. Each links out to its DOI / PubMed record.
- 1Bañados et al. (2018) Bañados, E., Venemans, B. P., Mazzucchelli, C., et al. 2018, Nature, 553, 473
- 2Bañados et al. (2015) Bañados, E., Decarli, R., Walter, F., et al. 2015, Ap J, 805, L 8
- 3Beelen et al. (2006) Beelen, A., Cox, P., Benford, D. J., et al. 2006, Ap J, 642, 694
- 4Bertoldi et al. (2003 a) Bertoldi, F., Carilli, C. L., Cox, P., et al. 2003 a, A&A, 406, L 55
- 5Bertoldi et al. (2003 b) Bertoldi, F., Cox, P., Neri, R., et al. 2003 b, A&A, 409, L 47
- 6Carilli et al. (2003) Carilli, C. L., Lewis, G. F., Djorgovski, S. G., et al. 2003, Science, 300, 773
- 7Chapin et al. (2013) Chapin, E. L., Berry, D. S., Gibb, A. G., et al. 2013, MNRAS, 430, 2545
- 8Colbert et al. (1999) Colbert, J. W., Malkan, M. A., Clegg, P. E., et al. 1999, Ap J, 511, 721