Precision measurements on the $^{138}$Ba$^+$ $6s^2S_{1/2}-5d^2D_{5/2}$ clock transition
Kyle J. Arnold, Rattakorn Kaewuam, Sapam R. Chanu, Ting Rei Tan,, Zhiqiang Zhang, and Murray D. Barrett

TL;DR
This paper reports highly precise measurements of the $^{138}$Ba$^+$ $6s^2S_{1/2}-5d^2D_{5/2}$ clock transition frequency and Landé $g_J$ factor, improving the accuracy of the $g_J$ measurement by a factor of 30.
Contribution
The study provides the most accurate measurement to date of the $g_J$-factor for the $D_{5/2}$ level and precise clock transition frequency for $^{138}$Ba$^+$.
Findings
Clock transition frequency measured with sub-Hz accuracy.
Landé $g_J$-factor for $D_{5/2}$ level improved 30-fold.
Systematic effects from ac-magnetic fields are significant and corrected.
Abstract
Measurement of the Ba clock transition frequency and Land\'e factor are reported. The clock transition frequency Hz, is obtained with accuracy limited by the frequency calibration of the maser used as a reference oscillator. The Land\'{e} -factor for the level is determined to be , which is a 30-fold improvement on previous measurements. The -factor measurements are corrected for an ac-magnetic field from trap-drive-induced currents in the electrodes, and data taken over a range of magnetic fields underscores the importance of accounting for this systematic.
Click any figure to enlarge with its caption.
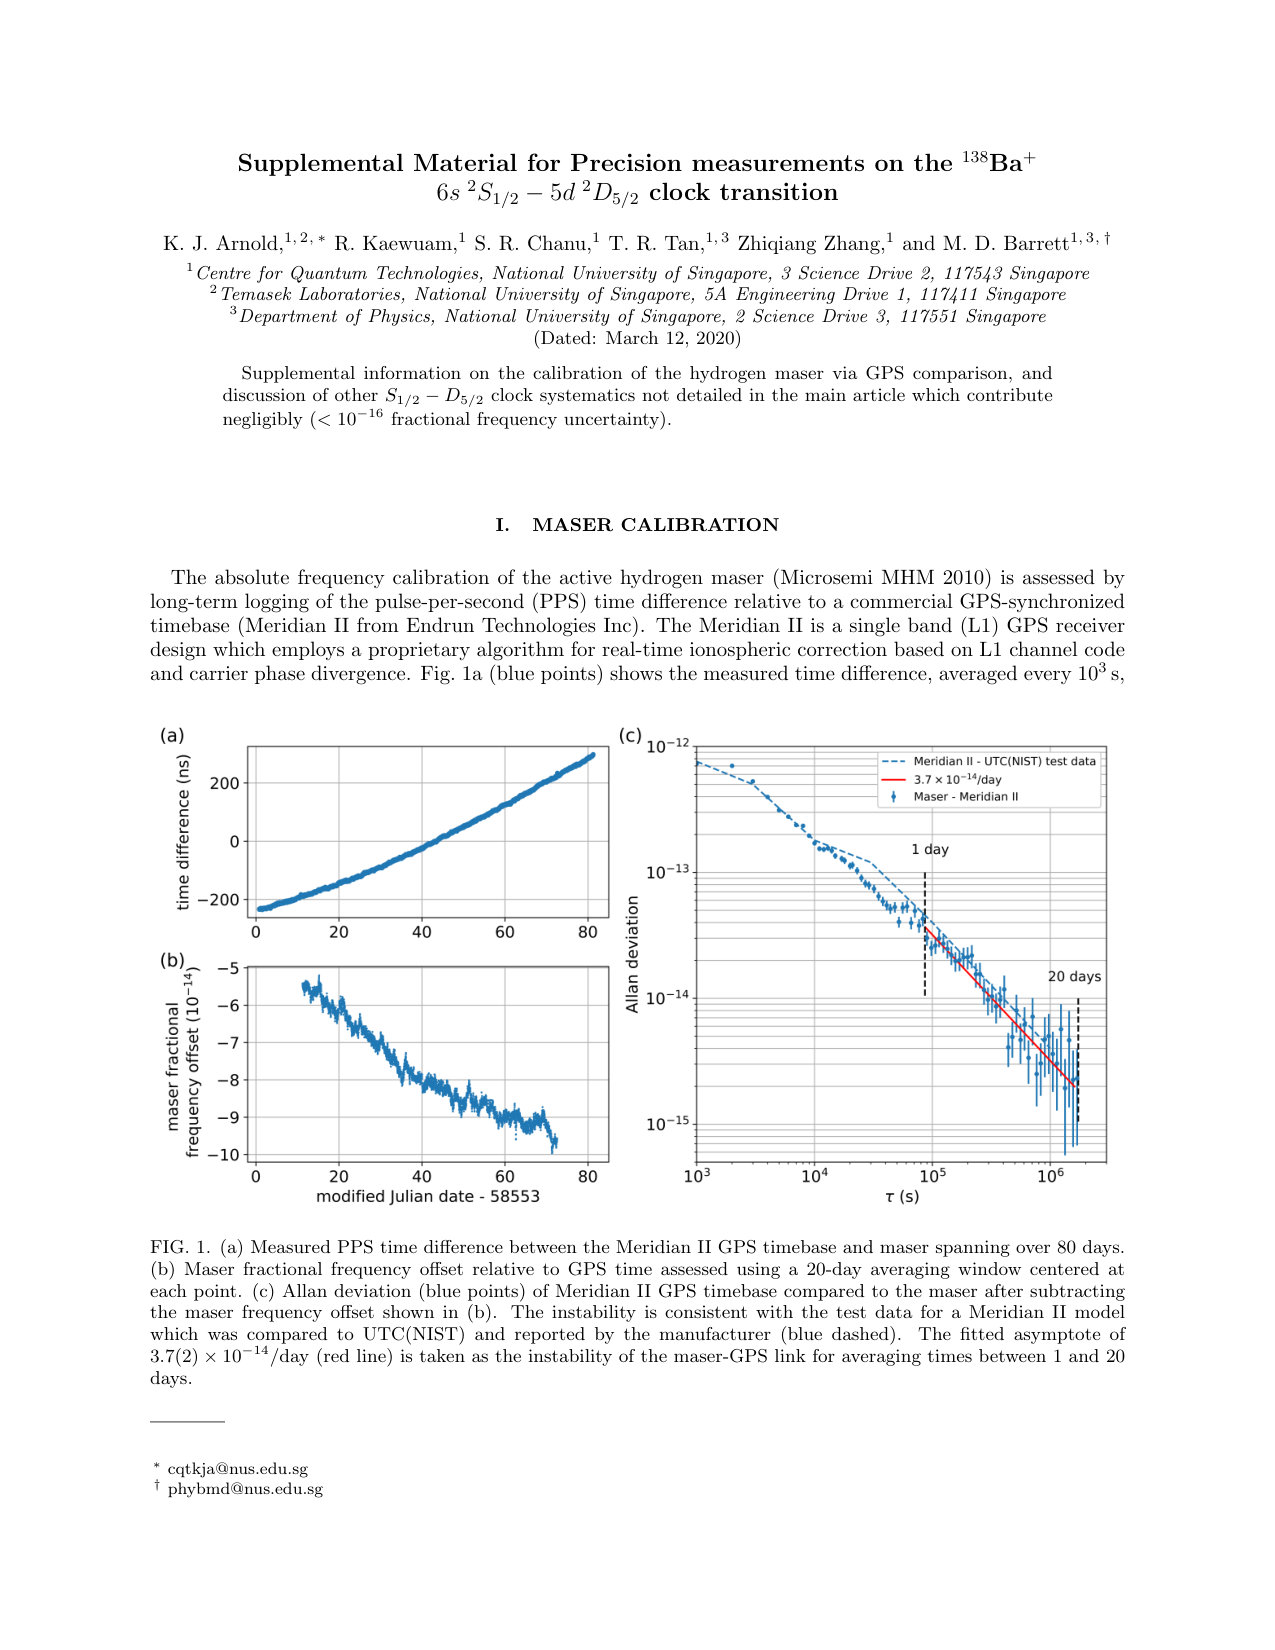 Figure 1
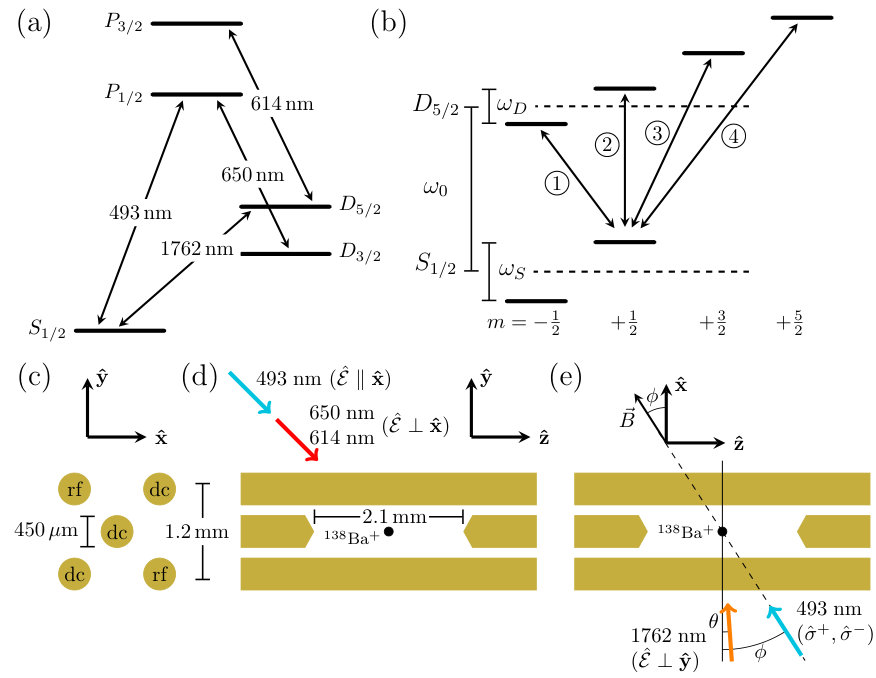 Figure 1
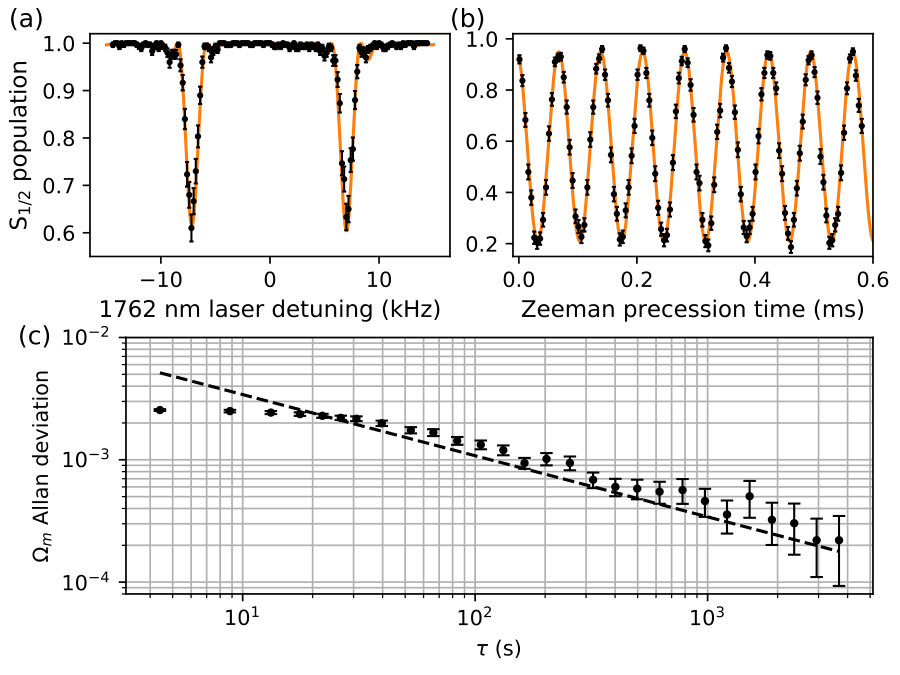 Figure 2
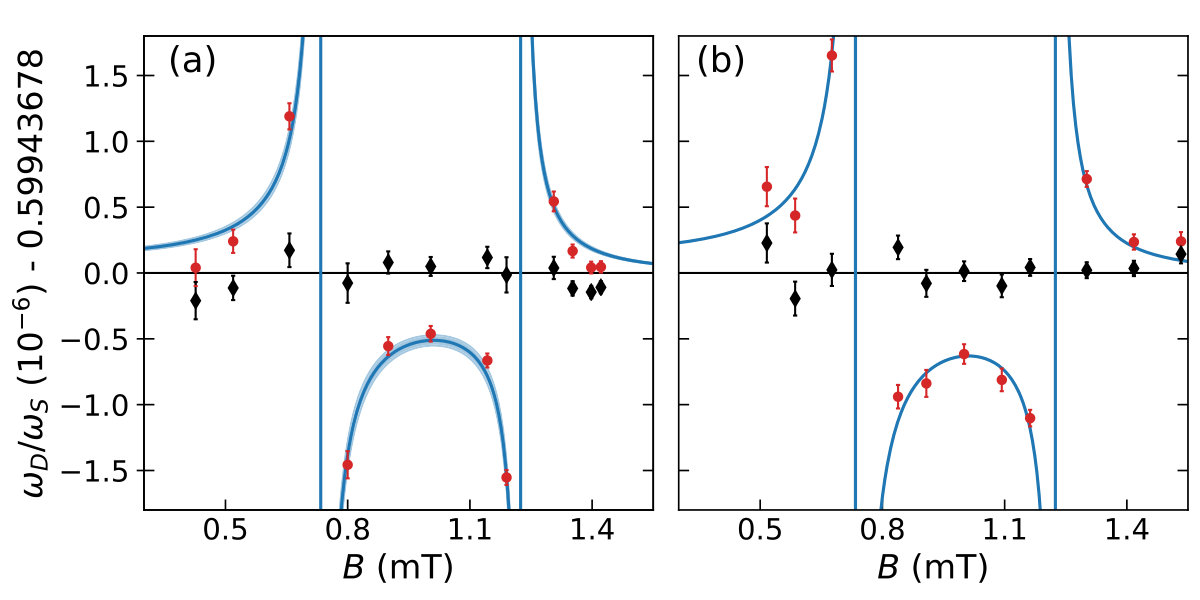 Figure 3
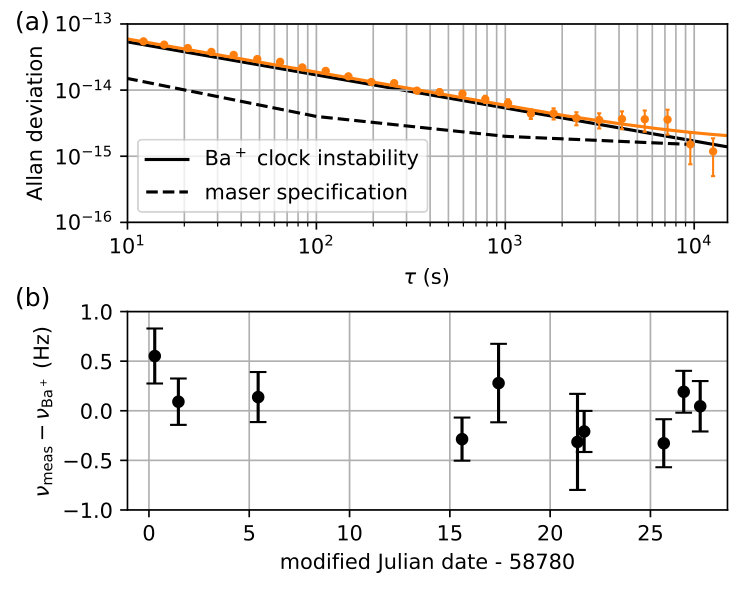 Figure 4
| Description | (Hz) | |
|---|---|---|
| black body radiation | 0.66 | 0.09 |
| ac Stark (1762 nm) | 0.53 | 0.27 |
| quadratic Zeeman | 0.05 | 0.01 |
| gravitational redshift | 0.32 | 0.06 |
| total | 1.56 | 0.29 |
Peer Reviews
No public reviews on file for this paper yet. If you reviewed it on a platform where reviews are public (OpenReview, ICLR, NeurIPS, ICML), you can paste yours below so the community can read it here.
Videos
No videos yet. Explain this paper in a talk, walkthrough, or lecture? Add one.
Precision measurements on the 138Ba+ clock transition
K. J. Arnold
Centre for Quantum Technologies, National University of Singapore, 3 Science Drive 2, 117543 Singapore
Temasek Laboratories, National University of Singapore, 5A Engineering Drive 1, 117411 Singapore
R. Kaewuam
Centre for Quantum Technologies, National University of Singapore, 3 Science Drive 2, 117543 Singapore
S. R. Chanu
Centre for Quantum Technologies, National University of Singapore, 3 Science Drive 2, 117543 Singapore
T. R. Tan
Centre for Quantum Technologies, National University of Singapore, 3 Science Drive 2, 117543 Singapore
Department of Physics, National University of Singapore, 2 Science Drive 3, 117551 Singapore
Zhiqiang Zhang
Centre for Quantum Technologies, National University of Singapore, 3 Science Drive 2, 117543 Singapore
M. D. Barrett
Centre for Quantum Technologies, National University of Singapore, 3 Science Drive 2, 117543 Singapore
Department of Physics, National University of Singapore, 2 Science Drive 3, 117551 Singapore
Abstract
Measurement of the 138Ba+ clock transition frequency and Landé factor are reported. The clock transition frequency Hz, is obtained with accuracy limited by the frequency calibration of the maser used as a reference oscillator. The Landé -factor for the level is determined to be , which is a 30-fold improvement on previous measurements. The -factor measurements are corrected for an ac-magnetic field from trap-drive-induced currents in the electrodes, and data taken over a range of magnetic fields underscores the importance of accounting for this systematic.
Singly-ionized Barium has been considered for a variety of applications in atomic physics including parity non-conservation (PNC) investigations Fortson (1993), optical clocks Sherman et al. (2005), and quantum information Dietrich et al. (2010); Inlek et al. (2017); Hucul et al. (2017). Being a monovalent atom, it is also amenable to precise theoretical predictions of atomic properties Iskrenova-Tchoukova and Safronova (2008); Safronova (2010), making it a testbed for theoretical and experimental techniques. This has led to high accuracy measurement of a variety of atomic properties including Landé -factors Marx et al. (1998); Knöll et al. (1996); Hoffman et al. (2013); Lewty et al. (2013), matrix elements Woods et al. (2010); Sherman et al. (2008), branching ratios from the and levels Kurz et al. (2008); De Munshi et al. (2015); Dutta et al. (2016), lifetime measurements of the lower lying metastable -states Yu et al. (1997); Auchter et al. (2014), fine-structure splittings Whitford et al. (1994) and hyperfine structure of odd isotopes Blatt and Werth (1982); Lewty et al. (2012).
The 138Ba+ clock transition shares many of the advantages of the corresponding transitions in 88Sr+ and 40Ca+. In addition, the upper-state lifetime of would allow long interrogation times. Moreover, dynamic-decoupling, as recently demonstrated in Sr+ Shaniv et al. (2018), is directly applicable to Ba+ and opens the door to multi-ion clock implementations Aharon et al. (2019). Our objective in this study is three-fold: (i) determination of the clock transition frequency for which an accurate value has not yet been reported, (ii) an improved accuracy measurement of the -factor, and (iii) validation of Ba+ as a trap diagnostic tool for characterizing rf-induced ac-magnetic fields. The ac-magnetic field assessment is relevant for subsequent Lu+ clock experiments in the same apparatus.
In this work, the clock frequency is measured with sub-Hertz level accuracy, which is accomplished by averaging over six Zeeman transitions to eliminate dominant linear Zeeman shifts and tensor shifts. From a combination of four transitions, the ratio of Zeeman splittings between the and levels is extracted. The Landé -factor, , is known to the level Marx et al. (1998), so this ratio provides an accurate determination of the -factor, . As ac-magnetic fields arising from rf-currents in the electrodes can compromise the accuracy of this determination, an Autler-Townes splitting on the clock transition is used to accurately characterize this systematic Gan et al. (2018).
The experiments are carried out using a four-rod linear Paul trap with axial end-caps described in previous work Arnold et al. (2018, 2019a). The rf potential at a frequency near is delivered via a quarter-wave helical resonator. Together with static potentials of 5 V on the end-caps and -0.5 V on two of the diagonally opposite rods, the measured trap frequencies for a single 138Ba+ ion are , with the lowest frequency along the trap axis, defined as . The quantization axis is defined by a magnetic field applied in the -plane at angle with respect to (Fig. 1e). For the absolute frequency and measurements, is set to 33(2)∘ and 0∘, respectively.
The level structure of 138Ba+ is shown in Fig. 1a along with the relevant transitions used in this work. Doppler cooling is provided by driving the 493- and 650-nm transitions, where of the fluorescence at 650 nm is detected on a single photon counting module (SPCM) for state determination Arnold et al. (2019b). The level is populated by driving the clock transition at 1762 nm and depopulated by driving the transition at 614 nm. Cooling and repumping light at 493, 614, and 650 nm are all collinear and propagate at 45 degrees to the -axis. For , the 493-nm cooling beam is -polarized, whereas the 614, and 650-nm beams are polarized perpendicular to the magnetic field (mT) to avoid dark states in the -levels. State preparation into the states of the levels is facilitated by two additional 493-nm beams that are polarized and .
Spectroscopy of the clock transition is implemented using an external-cavity-diode laser (ECDL), which is phase locked to an optical frequency comb (OFC). The short term (s) stability of the OFC is derived from a linewidth laser at 848 nm which is referenced to a 10 cm long ultra-low expansion (ULE) cavity with finesse of . For longer times (), the OFC is steered to an active hydrogen maser (HM) reference. The frequency of the maser is calibrated to the SI (International System of Units) second by continuous comparison to a GPS timebase end in combination with the circular-T reports from the International Bureau of Weights and Measures (BIPM) Dubé et al. (2017); Hachisu et al. (2017).
For the absolute frequency measurements, the 1762 nm laser is continuously on and intensity stabilized by an acousto-optic modulator. The transition of interest is driven by the lower sideband (MHz) of a wideband electro-optic modulator (EOM) which is frequency shifted near to resonance for clock interrogation. The clock laser propagates at an angle of with respect to (Fig. 1e) and is linearly polarized in the plane spanned by the propagation vector and the magnetic field. Control of the rf power driving the EOM enables equal -times for each transition while maintaining same total laser intensity at the ion.
A typical experiment consists of four steps: of Doppler cooling, optical pumping for to either , a 600 s clock interrogation pulse on a transition, and finally detection for . The initial Doppler cooling step includes the 614-nm beam to facilitate repumping from the upper clock state. Second-order integrating servos Peik et al. (2005) independently track the average and difference frequency Bernard et al. (1998) for three pairs of Zeeman transitions for Dubé et al. (2013). With a servo update period of s and probe duty cycle of 30, each Zeeman pair is servoed for approximately 1.5 minutes before cycling to the next. Coherence times are limited by the background magnetic field noise such that the resonant transfer probabilities for transitions are approximately for the 600 s probe time.
The absolute frequency of the transition is obtained from the average of all six transitions, which is free of linear Zeeman and tensor shifts Dubé et al. (2005). A total of ten measurements were taken over one month, with total measurement time of 70 h. The fractional instability of a typical measurement is shown Fig. 2a (orange points). The statistical uncertainty of individual measurements shown in Fig. 2b is taken from the quadrature sum (orange line) of the Ba+ servo instability (solid black line) and HM instability (black dashed line). The HM frequency is evaluated using GPS comparison data from a 20-day interval centered on the respective optical measurement, and with the assumption the HM has only a linear frequency drift over that time window. The total uncertainty in the HM calibration, including the link to the SI second via the Circular T, is evaluated to be SM . Given the substantial overlap of the 20-day averaging windows used, the uncertainty in the maser calibration is not averaged down but taken as the statistical uncertainty in the final value. The mean result of all optical frequency measurements is Hz, including correction for the systematic effects listed in Table 1.
The leading systematic shifts and uncertainties for the 138Ba+ clock transition are given in Table 1 and each briefly discussed in the following paragraphs. Averaging over all states eliminates tensor shifts which include the electric quadrupole shift, and tensor components of the quadratic Zeeman shift and ac-Stark shift from the 1762-nm laser. Other systematic effects which are considered, but omitted from Table 1 because they are well below the final uncertainty, include: shifts arising from excess micromotion (EMM), ac-Stark shifts due to the leakage of 493-nm or 615-nm laser light, second-order Doppler shifts from the thermal motion of the ion, and the ac-Stark shift due to off resonant quadrupole couplings of the clock laser. For completeness, a discussion of these shifts is given in the Supplemental Material.
As reported in the Ref. Chanu et al. (2019), the static and dynamic differential scalar polarizabilities are evaluated to be a.u. and a.u., where a.u. denotes atomic units, is the clock transition frequency, and we have taken the uncertainties as recommended in Ref. Chanu et al. (2019). The blackbody radiation (BBR) shift is evaluated for a temperature at ion of K, 5 degrees above the ambient temperature in the laboratory.
For the ac Stark shift due to the 1762-nm clock laser, the laser intensity is inferred from the observed Rabi coupling rates, accounting for the laser polarization, incidence angle relative to the magnetic field, , and the reduced electric-quadrupole matrix element a.u. Iskrenova-Tchoukova and Safronova (2008). The EOM modulation depth is set to maximize the first-order sideband when driving the weakest transitions, . The modulation depth is reduced accordingly to give equal coupling on the other transitions for constant intensity on ion.
The quadratic Zeeman shift arises from Zeeman coupling between and fine structure states. The magnetic dipole matrix element is calculated, in the LS-coupling regime, to be , which is consistent with other perturbative theory methods Safronova and Safronova (2011) to better than 1%. The quadratic Zeeman sensitivity for the average of all states is evaluated to be and all measurements were performed at a magnetic field near 0.225.
To determine the gravitational redshift we have taken a local geoid height of 7.9 m relative to the World Geodetic System (WGDS84) ellipsoid from the 2008 Earth Gravitation Model (EGM 2008) datum. The elevation of the ion in WGDS84 is determined from its relative position to the rooftop GPS receiver. From this, we estimate the local height above the geoid to be 17(3) m. Given the gravitational acceleration of 9.780 at equatorial latitude, the gravitational redshift is evaluated to be 0.32(6) Hz.
For determination of , four transitions are used: to , and (see Fig. 1b). The following differences in the experiments are noted: , , the clock probe times used were between 0.3-0.4 ms, the clock laser EOM is operated near the rf frequency MHz, and the 1762 nm laser intensity was not actively stabilized with the AOM which was instead used to switch the intensity during clock interrogation.
In a static magnetic field, , the Zeeman splittings for the and levels are given by and respectively. The ratio can be inferred from measured frequency differences between the four transitions and from which can be obtained using given in Marx et al. (1998). However, an rf-magnetic field, which arises from currents in the electrodes driven by the rf-trapping potentials, results in a measured ratio, , given by Gan et al. (2018)
[TABLE]
where is the amplitude of the rf-magnetic field perpendicular to the applied static field. For a given , the correction factor in square parentheses can, to a good approximation, be inferred from the measured values of , and using the measured to determine .
An accurate determination of can be obtained by setting , and driving the optical transition with a coupling strength . When , an Autler-Townes splitting on the optical transition is observed, as illustrated in Fig. 3(a), with the two peaks separated by . When , precession of the ground-state population is observed, as illustrated in Fig. 3(b), with the oscillation frequency given by . Both approaches give good agreement, with the data from Fig. 3 giving an inferred coupling of from the Autler-Townes splitting and from the Zeeman precession frequency. Although these are in agreement, an Autler-Townes splitting is a better method as an off-resonant Zeeman coupling appears as an imbalance in the two peaks and can be accounted for in data analysis.
We test the stability of by tracking the Autler-Townes splitting with a servo. The half-width half-maximum (HWHM) of the both lines in the Autler-Townes feature (such as shown in Fig. 3(a)) are sequentially interrogated on both transitions, . An outer servo loop adjusts the magnetic field to maintain the condition . Measured continuously for over 4 hours, the observed splitting is projection noise limited, as illustrated in Fig. 3(c), and shows a fractional stability of at one hour.
Measurements of were taken over a range of magnetic fields spanning , and two data sets taken approximately 1 month apart are shown in Fig. 4. For each set, solid circles are the measured values of with the magnetic field deduced from the measured ground-state splitting and the previously specified value of ; diamonds are corrected using values of and measured at the time the data was taken. Each point is a result of servoing on the four transitions for approximately servo updates with one servo update derived from measurements on either side of each of the transitions. The error bars for the uncorrected data are the statistical errors from the servo, and the corrected points include the error arising from the uncertainty in as specified in the caption.
Using a -minimization to determine the mean, the data in Fig. 4(a) gives a reduced of 1.95 indicating that the measurements are not limited by the statistical errors. At that time, it was noted that the rf-resonator was not optimally coupled, which resulted in a degraded stability of the rf-confinement and hence . This was fixed for the second data set, Fig. 4(b), which gives which gives a statistically acceptable reduced of 1.4. Nevertheless we take as the ratio result as the mean of the second data set with the full standard deviation as the uncertainty, , noting that this is also consistent with from the first dataset. The ratio combined with Marx et al. (1998) yields .
In summary, we have carried out precision spectroscopy of the clock transition in 138Ba+. The measurements have provided an absolute frequency determination of the clock transition with sub-Hertz level accuracy and a 30-fold improvement in the Landé -factor for the level. To our knowledge this is the first direct measurement of the optical transition frequency. A recently reported measurement of 146 114 384.0(1) MHz for the transition Dijck et al. (2015), together with the fine structure splitting of 24 012 048 319(1) kHz Whitford et al. (1994), is consistent with our result albeit limited by the 100 kHz uncertainty of Dijck et al. (2015). Our value for is in agreement with the value reported in Hoffman et al. (2013). The discrepancy with the result of Lewty et al. (2013) is potentially due to that quadrupole shifts, which were not considered in that anlysis. We have also demonstrated the influence that ac-magnetic fields arising from rf-currents in the electrodes can have on -factor measurements. Similar to the microwave demonstration reported in Gan et al. (2018), the observation of an Autler-Townes splitting on the clock transition has allowed an accurate characterization of the ac-magnetic field component orthogonal to the applied dc field. This will be an important diagnostic tool for characterizing the ac-magnetic field shift for the Lu+ clock transitions Gan et al. (2018).
Acknowledgements.
This work is supported by the National Research Foundation, Prime Ministers Office, Singapore and the Ministry of Education, Singapore under the Research Centres of Excellence programme. This work is also supported by A*STAR SERC 2015 Public Sector Research Funding (PSF) Grant (SERC Project No: 1521200080).
The reference list from the paper itself. Each links out to its DOI / PubMed record.
- 1Fortson (1993) N. Fortson, Physical Review Letters 70 , 2383 (1993).
- 2Sherman et al. (2005) J. A. Sherman, W. Trimble, S. Metz, W. Nagourney, and N. Fortson, in Digest of the LEOS Summer Topical Meetings, 2005. (IEEE, 2005) pp. 99–100.
- 3Dietrich et al. (2010) M. R. Dietrich, N. Kurz, T. Noel, G. Shu, and B. B. Blinov, Physical Review A 81 , 052328 (2010).
- 4Inlek et al. (2017) I. V. Inlek, C. Crocker, M. Lichtman, K. Sosnova, and C. Monroe, Physical Review Letters 118 , 250502 (2017).
- 5Hucul et al. (2017) D. Hucul, J. E. Christensen, E. R. Hudson, and W. C. Campbell, Physical Review Letters 119 , 100501 (2017).
- 6Iskrenova-Tchoukova and Safronova (2008) E. Iskrenova-Tchoukova and M. S. Safronova, Physical Review A 78 , 012508 (2008).
- 7Safronova (2010) U. I. Safronova, Physical Review A 81 , 052506 (2010).
- 8Marx et al. (1998) G. Marx, G. Tommaseo, and G. Werth, The European Physical Journal D - Atomic, Molecular, Optical and Plasma Physics 4 , 279 (1998).