Similarity indexing & GIS analysis of air pollution
Purusharth Saxena, Madhu Kashyap Jagdeesh

TL;DR
This paper introduces the Delhi Similarity Index (DSI), a new metric for comparing air pollution levels across cities using trace gases, and analyzes GIS data to assess pollution similarities and trends.
Contribution
The paper formulates the DSI metric and applies GIS analysis to evaluate and compare air pollution levels in Indian cities over several years.
Findings
Bengaluru's pollution levels are approaching Delhi's.
Jungfraujoch shows moderate similarity to Delhi.
DSI effectively quantifies pollution similarity.
Abstract
Pollution has become a major threat in almost all metropolitan cities around the world. Currently, atmospheric scientists are working on various models that could help us understand air pollution. In this paper, we have formulated a new metric tool called Delhi Similarity Index (DSI). The DSI is defined as the geometrical mean of the trace gases such as ozone, sulfur-dioxide and carbon-monoxide, which ranges from 0 (dissimilar to Delhi) to 0.9-1 (similar to Delhi). The limitation of the tool concerning the result of the nitrous-di-oxide data set is also analyzed. Also, the GIS projections of PM 2.5 role for Indian cities are graphically represented. The DSI results from 2011 to 2014 data show that Bengaluru is in the threshold of becoming as polluted like Delhi with values varying from 0.8 to 0.9 (i.e. 80-90%) and Jungfraujoch with a 0.65 to 0.7 (i.e. 65-70%).
Click any figure to enlarge with its caption.
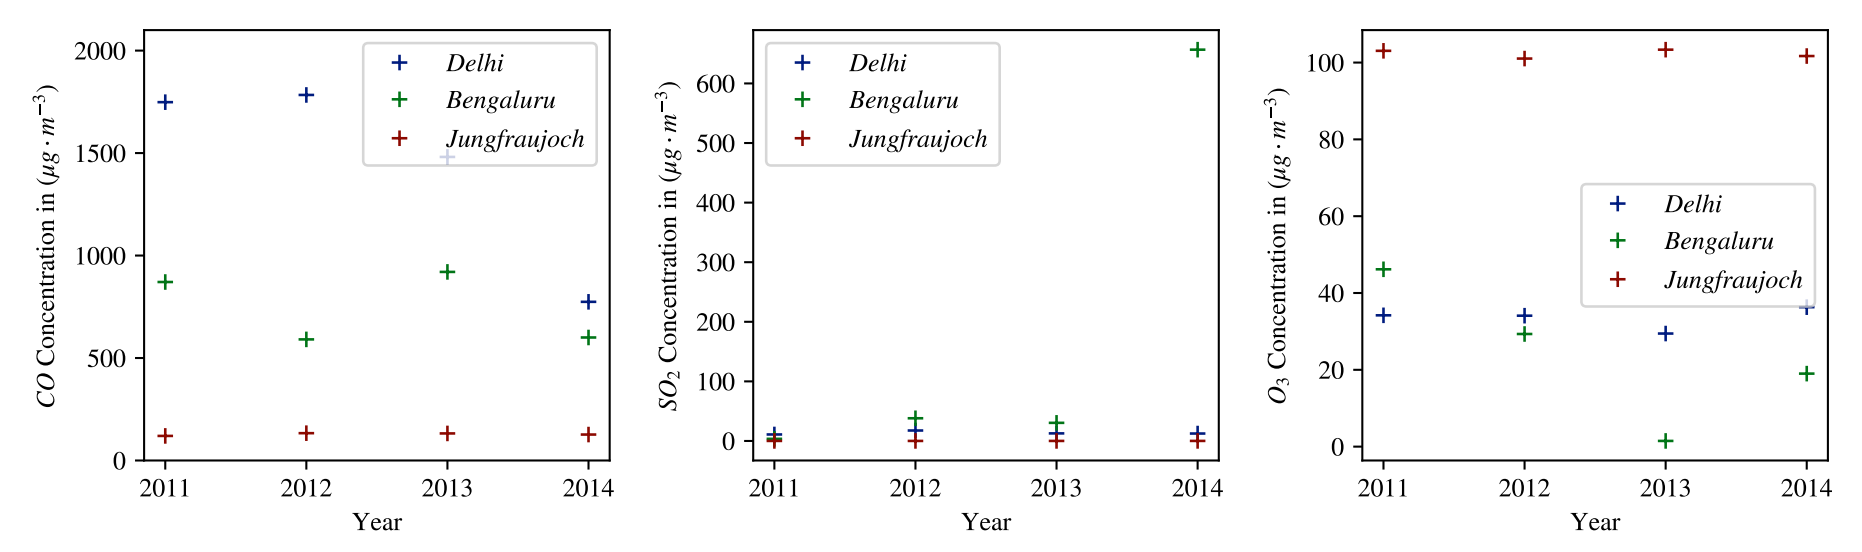 Figure 1
 Figure 10
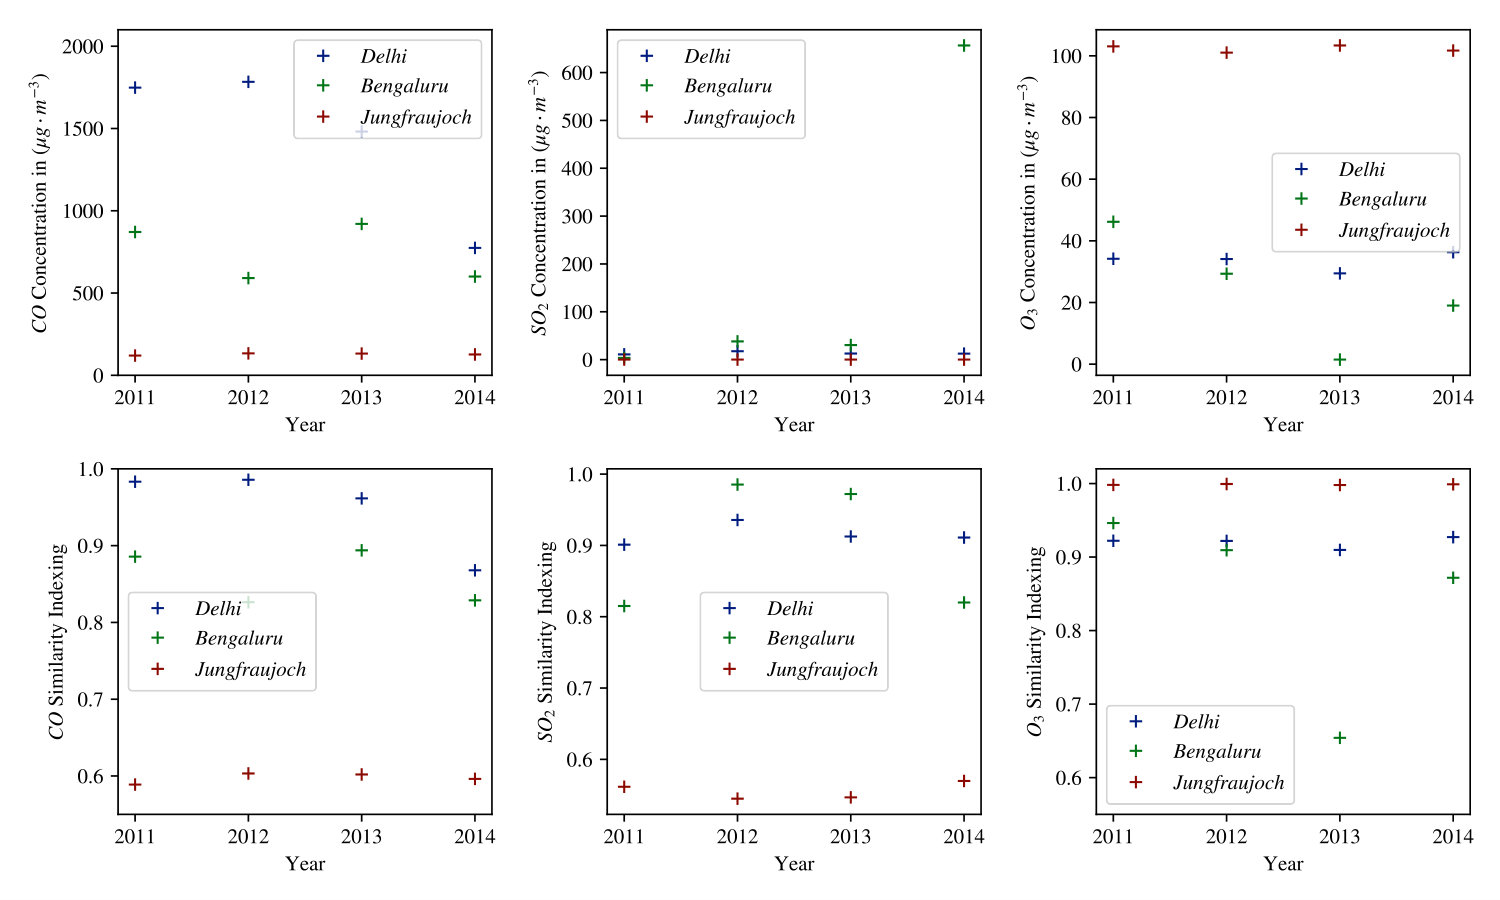 Figure 1
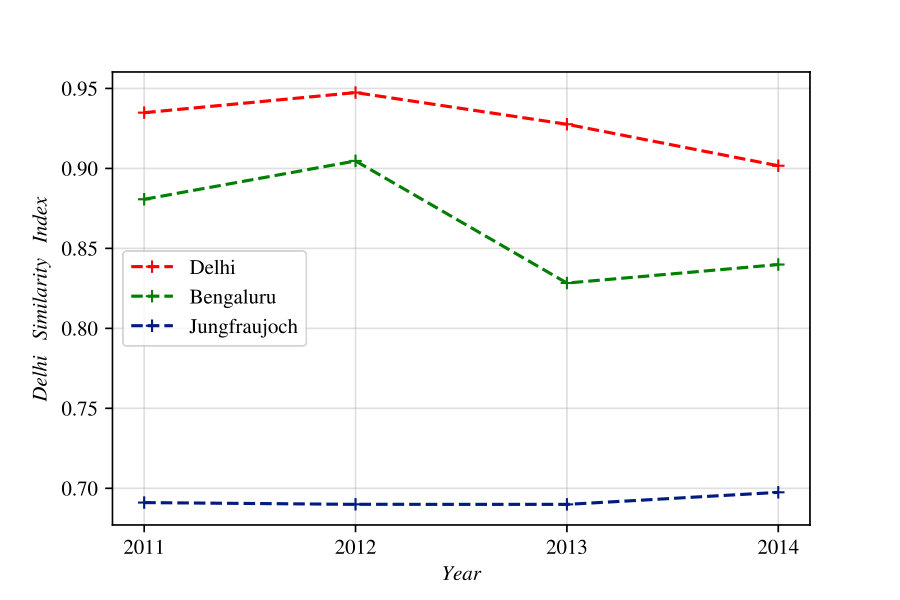 Figure 2
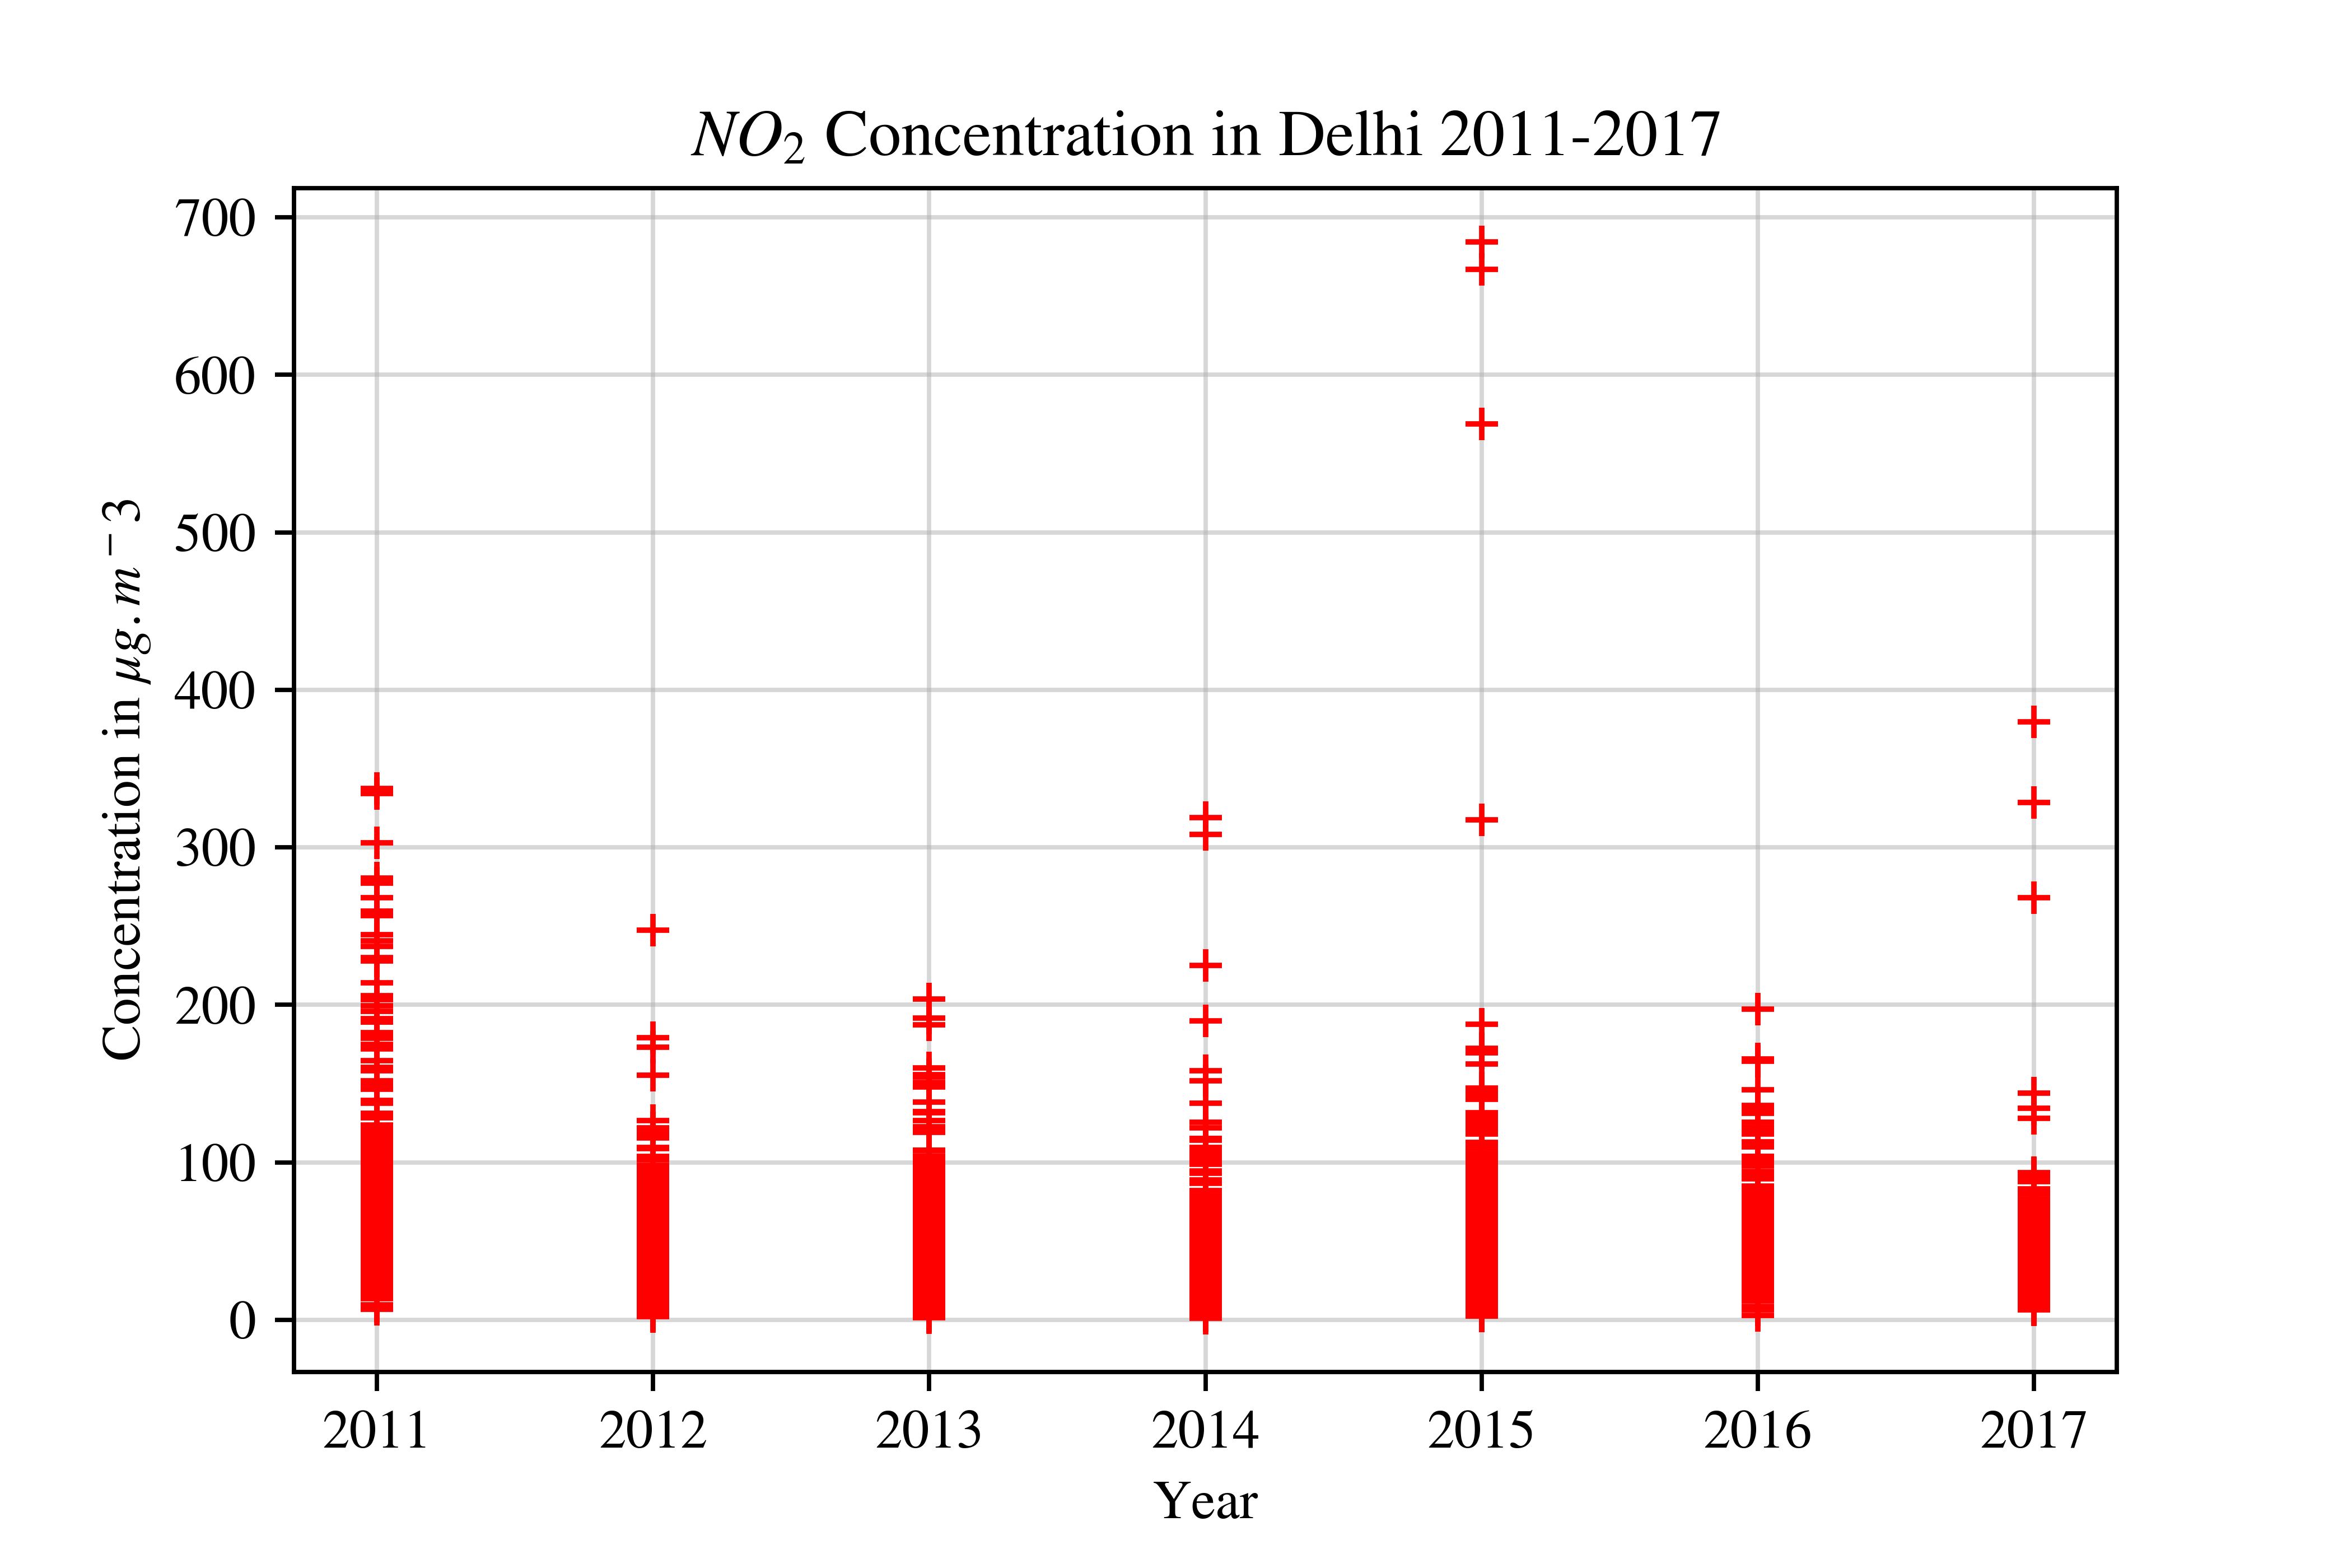 Figure 3
 Figure 4
 Figure 5
 Figure 6
 Figure 8
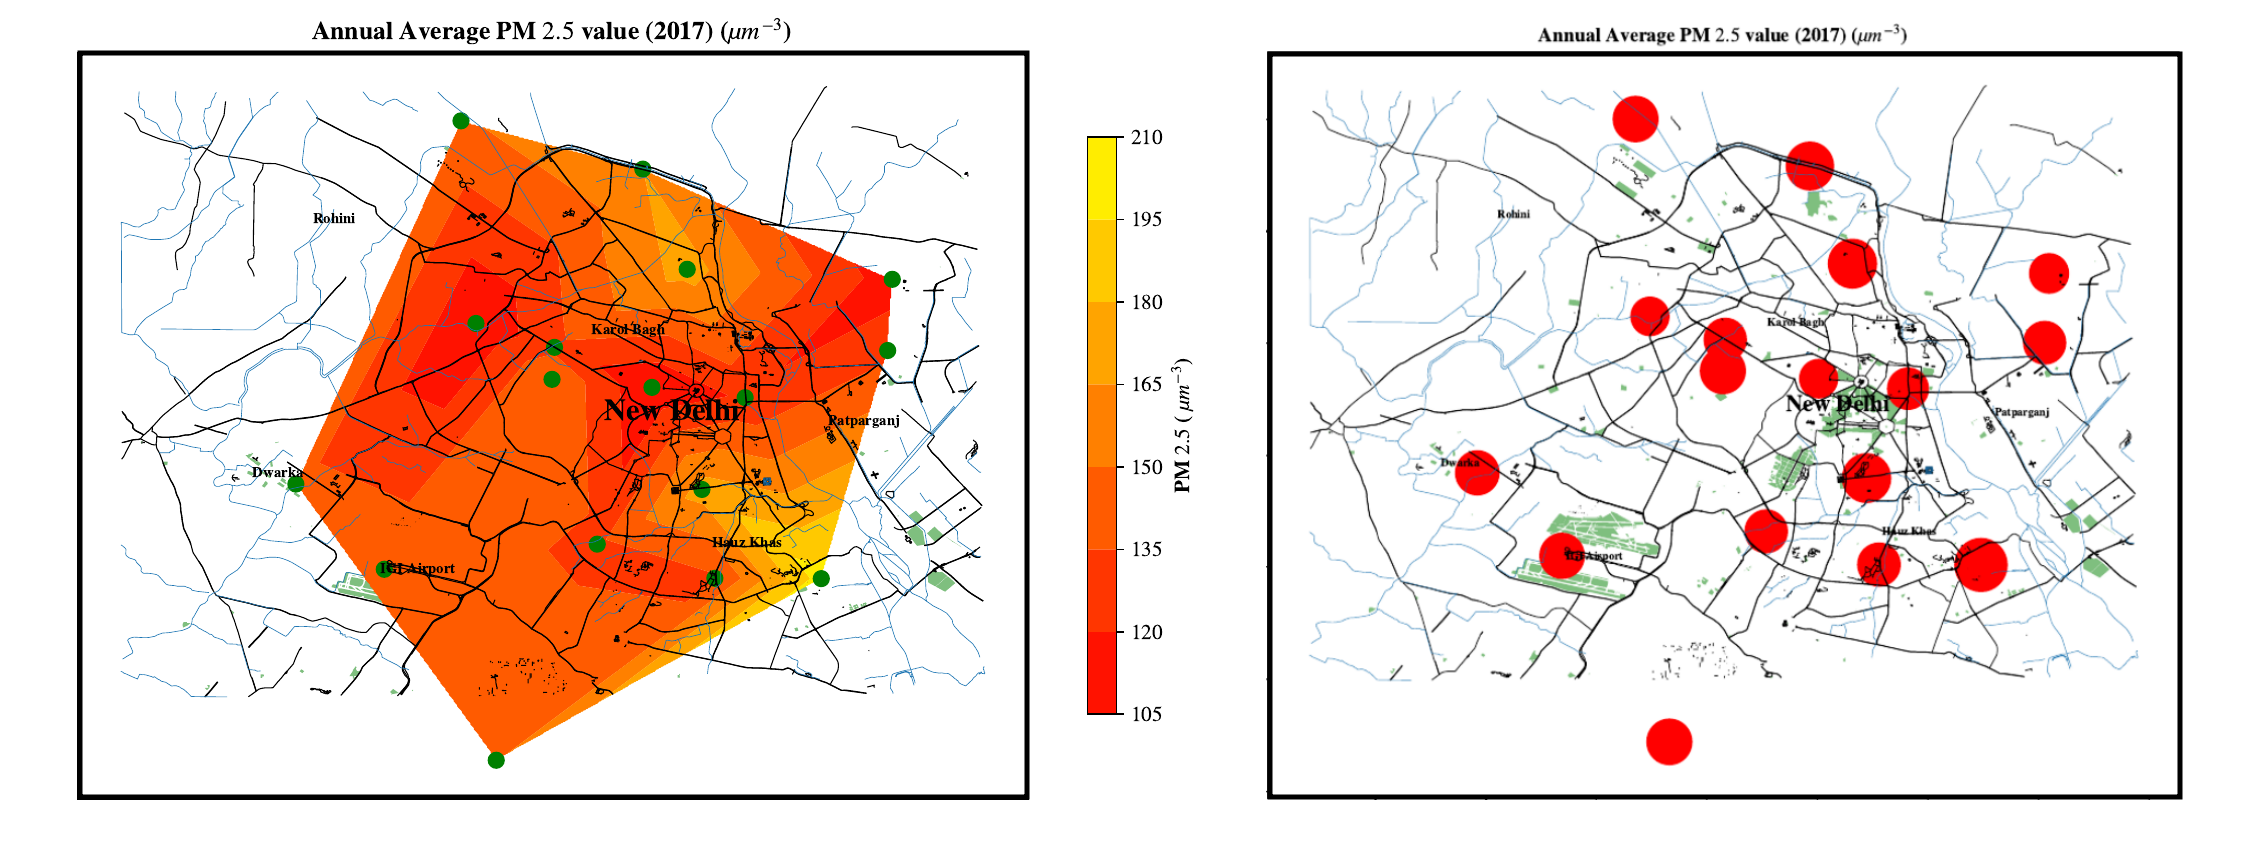 Figure 9
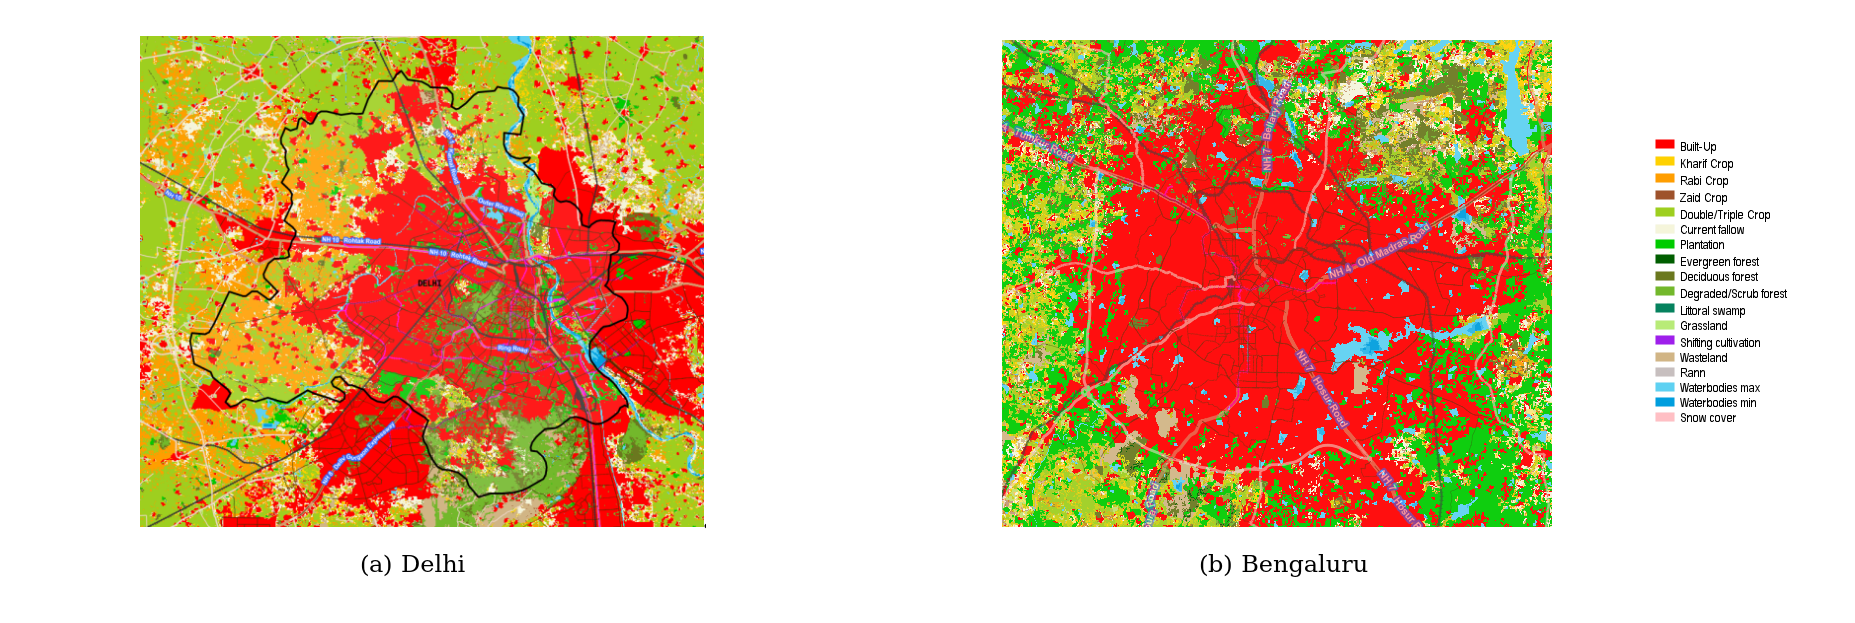 Figure 11
| Location | Gas | () | Weight Exponents |
|---|---|---|---|
| New Delhi | 100 | 0.12 | |
| New Delhi | 50 | 0.10 | |
| New Delhi | 2000 | 0.081 |
| Year | New Delhi | Bengaluru | Jungfraujoch | ||||||
|---|---|---|---|---|---|---|---|---|---|
| 2011 | 0.983 | 0.901 | 0.922 | 0.885 | 0.815 | 0.946 | 0.085 | 0.561 | 0.998 |
| 2012 | 0.985 | 0.935 | 0.921 | 0.826 | 0.985 | 0.909 | 0.063 | 0.544 | 0.999 |
| 2013 | 0.961 | 0.912 | 0.909 | 0.893 | 0.972 | 0.654 | 0.065 | 0.546 | 0.998 |
| 2014 | 0.867 | 0.911 | 0.927 | 0.828 | 0.819 | 0.871 | 0.098 | 0.569 | 0.998 |
| Year | Delhi | Bengaluru | Jungfraujoch |
|---|---|---|---|
| 2011 | 0.934 | 0.880 | 0.691 |
| 2012 | 0.947 | 0.904 | 0.689 |
| 2013 | 0.927 | 0.828 | 0.689 |
| 2014 | 0.901 | 0.839 | 0.697 |
Peer Reviews
No public reviews on file for this paper yet. If you reviewed it on a platform where reviews are public (OpenReview, ICLR, NeurIPS, ICML), you can paste yours below so the community can read it here.
Videos
No videos yet. Explain this paper in a talk, walkthrough, or lecture? Add one.
Taxonomy
TopicsImpact of Light on Environment and Health · Air Quality Monitoring and Forecasting · COVID-19 impact on air quality
\papertype
Original Article \paperfieldJournal Section
\abbrevsDSI, Delhi Similarity Index.
\contrib[\authfn1]Equally contributing authors.
\corraddressMadhu Kashyap Jagadeesh, Department of Physics, Jyoti Nivas College, Bengaluru, Karnataka, 560029, India \[email protected] \fundinginfoNone
Similarity indexing & GIS analysis of air pollution
Purusharth Saxena
Madhu Kashyap Jagadeesh
Abstract
Pollution has become a major threat in almost all metropolitan cities around the world. Currently atmospheric scientists are working on various models that could help us understand air pollution. In this paper we have formulated a new metric tool called Delhi Similarity Index (DSI). The DSI is defined as the geometrical mean of the trace gases such as: ozone, sulfur-dioxide and carbon-monoxide, which ranges from 0 (dissimilar to Delhi) to 0.9-1 (similar to Delhi). The limitation of the tool concerning the result of the nitrous-di-oxide data set is also analyzed. Also, the GIS projections of PM 2.5 role for Indian cities are graphically represented. The DSI results from 2011 to 2014 data show that Bengaluru is in the threshold of becoming as polluted like Delhi with values varying from 0.8 to 0.9 (i.e. 80-90%) and Jungfraujoch with a 0.65 to 0.7 (i.e. 65-70%).
keywords:
Delhi Similarity Index, air Pollution, Geographical Information System (GIS) and PM 2.5
1 Introduction
The pollution in metropolitan cities is leading towards numerous modeling and analysis studies. The research about air pollution, and controlling techniques are suggested to avoid the rise of pollution [[13] and [2]]. But New Delhi the capital city of India is infamous for its pollution, which has risen to such an extent that it is posing a non-negligible health hazard for the permanent residents of the city [[4], [5], [1], [4], [5] & [9]]. Despite constant research and concerns to government, the air quality in New Delhi is degrading and has reached a critical point [[9] and [1]]. According to the Air Quality Index (AQI), the urban areas are facing major threat, consequently the trend study and analysis of AQI is going on at various places (Ex: [10]). In this research we use the evolved similarity index formula of Bray-Crutis of 1957, which is applied in various studies such as ecology ([12]), marine ([14]), and astrophysics ([15] and [8]). A new indexing measure to check the similarity of air pollution in different cities (such as: Bengaluru, New Delhi and Jungfraujoch) with respect to the New Delhi air pollution is introduced, which is called Delhi Similarity Index (DSI). DSI is basically defined as the geometrical mean of the trace gases such as: ozone, sulfur-dioxide and carbon-monoxide, which ranges from 0 (dissimilar to Delhi) to 0.9-1 (similar to Delhi). For past several years, Delhi’s PM 2.5 (Particulate Matter microns) level has crossed the threshold of WHO standards atleast a few times in an year, as studied by [17]. Various studies have been performed over the atmospheric and surface pollution of Delhi: [6], [16]. Geographic Information System (GIS) has also been employed to study the spread and compare the pollution over time within a city. [11], [7]. Hence in this paper we have dedicated a section to understand PM 2.5 trends in New Delhi and Bengaluru along DSI analysis.
The paper structure is as follows: Section 2 contains the formulation of DSI, Section 3 is about data collection along with the geo-political description of stations, section 4 deals with the Results of DSI, section 5 has the PM 2.5 analysis of Bengaluru and New Delhi, and section 6 is concluded by the discussion and conclusion.
2 Formulation of Delhi Similarity Index (DSI)
The Bary-Curtis’ similarity index from 1957 is used in this formulation with the indices division of 0.2 intervals [3], the classifications are as follows: very low, low, moderate, high and very high similarity regions. Here, we define the threshold to very high similarity region with the threshold of . Defining the physical limits and of the permissible variation of a variable with respect to (i.e. ), we calculate the weight exponents for the lower and upper limits,
[TABLE]
The average weight is found by taking the geometric mean of and ,
[TABLE]
The Delhi Similarity Index is defined, as (for the entire abstract derivation refer [8]],
[TABLE]
where is the concentration of the trace gases under observation, and is the standard for the respective trace gases as advised by Central Pollution Control Board (CPCB), India .
The yearly Delhi Similarity Index is the geometric mean of the DSI value of the trace gases (3).
[TABLE]
Where, , , and are the Delhi Similarity Index values of ozone, sulfur-dioxide and carbon-monoxide, which ranges from 0 (dissimilar to Delhi) to 0.9-1 (similar to Delhi).
3 Data Collection and Site Description
3.1 New Delhi
The average altitude of Delhi is about 216m and the data for New Delhi is obtained from Central Pollution Control Board (CPCB) 111(http://www.cpcb.gov.in/CAAQM/frmUserAvgReportCriteria.aspx), and this AQI data station is located at Shadipur () India. New Delhi is one of the most populated metropolitan region in India. According to the 2011 census done by the Indian Government, the population density of Delhi is about 11,000 people per square kilometer, The last census was taken 8 years ago, and given the exponential rise in population being observed in Delhi, the United Nations estimates that Delhi will become the most populated city by 2028. The main reasons are the number of vehicles in Delhi has grown to a whooping 10 million (Gude et al. 2006). The geopolitical disadvantage of New Delhi is; it is surrounded by industrial & agricultural cities, which annually experiences a massive intake of trace gases as a direct effect of crop burning in neighbouring states.
3.2 Bengaluru
The altitude of Bengaluru is about 920 m and the data for Bengaluru is also obtained from CPCB website, the data station is located at BTM layout () which is a residential area in Bengaluru. Unlike New Delhi, Bengaluru experiences a mild temperature throughout the year with almost no extreme variations; the annual mean temperature is around 25∘ C, April and May being the hottest. Bengaluru is the target center of our study, which acts as the neutral point between New Delhi (major air pollution) and Jungfraujoch (minor air pollution).
3.3 Jungfraujoch
Jungfraujoch is a station in the European Alps of Switzerland, it is located almost at the center of Europe, at an altitude of around 3460 m. It is a significant contributor to atmospheric data due to lack of pollutants at a good elevation and the nearby industrial areas located at lower altitudes. Data for Jungfraujoch was collected from the World Data Center for Greenhouse Gases [WDCGG] 222(https://ds.data.jma.go.jp/) from the station monitored by Swiss Federal Laboratories for Materials Science and Technology (empa).
Daily data collected, for all the three cities, from 2011 to 2014, the annual average is taken separately for all the trace gases and tabulated (Table: 2).
4 Results
The calculated weight exponent parameters for New Delhi data are tabulated in Table 2. The weight exponents calculations are done using Eq 1, and the lower and upper limit of the trace gas data set is selected (here the minimum and maximum data recorded from 2011 - 2014).
Based on the exponents in Table 1, we calculate the Delhi similarity index for the the three trace gases using Equation 3
Table 3 shows the global Delhi Similarity Index estimated from the geometrical mean of , , and for the three cities across 2011-14 data.
As evident from Table 3, the DSI values for Delhi is maximum for all the years, whereas it is least for Jungfraujoch. The variation in Jungfraujoch is because of high content observed can be attributed to its high altitude. The increase in the DSI value for Bengaluru is because of the increase in concentration in 2013-14.
The concentration variations of trace gases from 2011 to 2014 data is graphically represented in figure 1. The large variations of data is observed in and , than . This could be because of large quantity of carbon emissions from vehicles, which in turn deplete the ozone layer.
The DSI results of Table3 is graphically obtained as figure 2.
From figure 2 an increase is seen in Jungfraujoch and Bengaluru DSI values for the year 2013-14, while a downward trend is observed in Delhi DSI value. Nevertheless, the index value of Delhi remains prominent.
4.1 data deviation
The boundary conditions of similarity index observed as a limit, that the data obtained from the CPCB database doesn’t work on specific forms of data sets. The data set of falls under the following condition:
Where is the maximum value of x, and is the reference value. The weight exponent calculated for this form of condition does not yield any result. Hence data is not applied in the similarity index tool, but the tool is valid for the above-mentioned trace gases except .
The Daily concentration for Delhi is given in Figure 3, a pattern is detected throughout 2011-17, with a high concentration of occurring during November each year, which in turn can be linked to the burning of crops in the nearby cities.
The 2015 data corresponds to extremely high values observed in first week of November in Delhi. Subsequently, the rest of the years follow the same pattern in November.
5 PM 2.5 GIS analysis for Bengaluru and New Delhi
Suspended particle matter in the air of size 2.5 is the basic full form of PM 2.5. The PM 2.5 data of the year 2017 from CPCB data is plotted using a Geographical Information system (GIS). The sites used for the analysis are Bengaluru and New Delhi, as data for Jungfraujoch, is not available. However, the ozone depletion is observed to be more significant in Jungfraujoch, than the PM 2.5 pollutant. GIS plots are used to study PM 2.5 effects and proliferation (as done in [7], [11]).
5.1 Bengaluru
Peenya, being an industrial district, harbours higher concentration of PM 2.5 when compared to residential areas (BTM, BWSSB). An increase in the relative content of PM 2.5 content in each district is observed in the month of April-May (Peak Summer months in Bengaluru). While a dip is observed in the month of June-July (onset of monsoon in Bengaluru).
The GIS plot (interpolation and scatter) for PM 2.5 content in Bengaluru, agrees with the above mentioned trends, like Peenya has higher concentration. The 3 stations are marked in green dots and the concentration intensity scale is shown in the right side of the GIS interpolation plot.
5.2 New Delhi
For the New Delhi PM 2.5 sample of 2017, the available data is taken from nine CPCB stations, (namely: ITO, Mandir Marg, Punjabi Marg, Dwarka, DTU, IHBAS, RK Puram, Shadipur, Sirifort) and the corresponding results are obtained as shown below.
The maximum PM 2.5 content is observed in the first week of November, which can be attributed to the burning of the crops in the neighbouring cities. The same pattern is observed in all the stations throughout the year. The PM 2.5 concentration is so high, that temperature does not seem to be the major factor in militating or mitigating the PM 2.5 content, as such seasonal variation was observed in Bengaluru (Figure 4).
The GIS plot (interpolation and scatter plot) for New Delhi is given below in figure 7.
The green dots in figure 7 indication CPCB stations and the variations of PM 2.5 intensity is high in almost all chosen areas. The Bhuvan satellite vegetation images gives the size of built-up area (in red) of New Delhi and Bengaluru.
Even though the built up area of Bengaluru seems to be larger, the air pollution constraints seems to be follow the similar trend. The green and the blue, indicating the need of clean air and water has to be protected and improved.
6 Discussion and Conclusion
As shown in Table 2, different cities have different pollution levels for different gases, which is a result of human intervention, geographic position - altitude, and proximity from the coastline of the city. Therefore, a direct comparison of the concentration of trace gases is an inefficient measure of the level of pollution in a city. In other words, DSI is an index that can be used to compare the atmospheric deterioration (due to trace/greenhouse gases) for two or more cities. A succinct mathematical model, called Delhi Similarity Index (DSI), gives a reference value for comparison, interpolation and extrapolation. The cities that are chosen for the model are New Delhi, Bengaluru and Jungfraujoch. Wherein New Delhi is in severe pollution state, Jungfraujoch is in an ideal location in the Bernese Alps, and Bengaluru is taken as a neutral point between New Delhi and Jungfraujoch. Figure 1 and Figure 2 shows the variation of Concentration of the respective gases, and the overall DSI comparison of the three cities, respectively (from 2011-2014). As seen from Figure 2, the year 2012 was worst, in terms of pollution, for the Indian cities of Bengaluru and New Delhi; after which both the cities started improving. The summary for all the 3 cities as given in the Table 3. In turn implies that in 2011, the trace gases concentration Jungfraujoch was 69.1% of New Delhi’s on the same year, while that of Bengaluru’s was 88% of New Delhi’s in the same year. Same can be stated about 2012, where a spike in New Delhi and Bengaluru DSI values are observed. similarly, the maximum value for Jungfraujoch was observed in 2014 (as seen in Figure 2). Although Jungfraujoch’s Carbon mono-oxide and Sulfur Dioxide content is of significantly lower amount when compared to New Delhi and Bengaluru, but the indexing gives 69% similarity to New Delhi because of soaring surface ozone concentration in Jungfraujoch. The variations the level of PM 2.5 due to seasonal changes (in Bengaluru) is an intriguing anomaly which requires further investigation, moreover New Delhi does not show such variation. Future work can be done with many more cities across a wide spectrum (coastal area, islands, tundra & equatorial region, etc), with more trace / greenhouse gases data, with similarity index technique. A comprehensive comparison can then be made for the chosen cities.
Acknowledgments
We thank CPCB for there online database for data on Indian cities and the World Data Centre for Greenhouse Gases (WDCGG) database for Switzerland data. Also we would like to thank NRSC of ISRO for Bhuvan satellite data on vegetation.
The reference list from the paper itself. Each links out to its DOI / PubMed record.
- 1Agarwal et al. [2002] Agarwal, K., Mughal, M., Upadhyay, P., Berry, J., Mawer, E. and Puliyel, J. (2002) The impact of atmospheric pollution on vitamin d status of infants and toddlers in delhi, india. Archives of disease in childhood , 87 , 111–113.
- 2Beelen et al. [2013] Beelen, R., Hoek, G., Vienneau, D., Eeftens, M., Dimakopoulou, K., Pedeli, X., Tsai, M.-Y., Künzli, N., Schikowski, T., Marcon, A. et al. (2013) Development of no 2 and nox land use regression models for estimating air pollution exposure in 36 study areas in europe–the escape project. Atmospheric Environment , 72 , 10–23.
- 3Bloom [1981] Bloom, S. A. (1981) Similarity indices in community studies: potential pitfalls. Mar. Ecol. Prog. Ser , 5 , 125–128.
- 4Chhabra et al. [2001] Chhabra, S. K., Chhabra, P., Rajpal, S. and Gupta, R. K. (2001) Ambient air pollution and chronic respiratory morbidity in delhi. Archives of Environmental Health: An International Journal , 56 , 58–64.
- 5Cropper et al. [1997] Cropper, M., Simon, N. B., Alberini, A. and Sharma, P. (1997) The health effects of air pollution in delhi, india. World Bank Policy Research .
- 6Ghude et al. [2008] Ghude, S. D., Jain, S., Arya, B., Beig, G., Ahammed, Y., Kumar, A. and Tyagi, B. (2008) Ozone in ambient air at a tropical megacity, delhi: characteristics, trends and cumulative ozone exposure indices. Journal of Atmospheric Chemistry , 60 , 237–252.
- 7Jerrett et al. [2001] Jerrett, M., Burnett, R. T., Kanaroglou, P., Eyles, J., Finkelstein, N., Giovis, C. and Brook, J. R. (2001) A gis–environmental justice analysis of particulate air pollution in hamilton, canada. Environment and Planning A , 33 , 955–973.
- 8Kashyap et al. [2017] Kashyap, J. M., Gudennavar, S. B., Doshi, U. and Safonova, M. (2017) Indexing of exoplanets in search for potential habitability: application to mars-like worlds. Astrophysics and Space Science , 362 , 146.