Flow dynamics and wall-pressure signature in high-Reynolds number overexpanded nozzle with free shock separation
E. Martelli, L. Saccoccio, P.P. Ciottoli, C.E. Tinney and, W.J. Baars, M. Bernardini

TL;DR
This study uses high-fidelity simulations to analyze unsteady shock oscillations and wall-pressure signatures in a high-Reynolds number overexpanded nozzle, revealing key frequencies and mechanisms behind shock-induced unsteadiness.
Contribution
It provides detailed spectral analysis of wall-pressure fluctuations and identifies the physical mechanisms driving shock oscillations and side loads in overexpanded nozzles.
Findings
Presence of low-frequency shock breathing mode
High-frequency turbulence-related pressure peaks
Intermediate frequency peak linked to side loads
Abstract
A delayed detached eddy simulation (DDES) of an overexpanded nozzle flow with shock-induced separation is carried out at a Reynolds number equal to 1.7 10^7. The flow unsteadiness, characterised by self-sustained shock oscillations, induces local unsteady loads on the nozzle wall as well as global off-axis forces. A clear physical understanding of the driving factors of the unsteadiness is still lacking. Under the current conditions, the nozzle operates in a highly-overexpanded regime and comprises a conical separation shock within the nozzle contour, merging into a Mach disk in the nozzle centre. Our current study focuses on the unsteady pressure signature on the nozzle wall, through the use of Fourier-based spectral analysis performed in time and in the azimuthal wavenumber space. The numerical data well agrees with the experimental measurements in terms of mean and fluctuating wall…
Click any figure to enlarge with its caption.
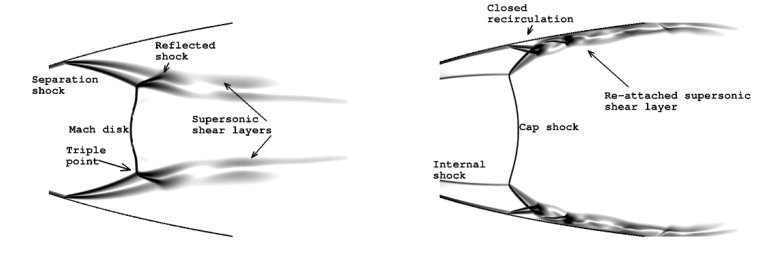 Figure 1
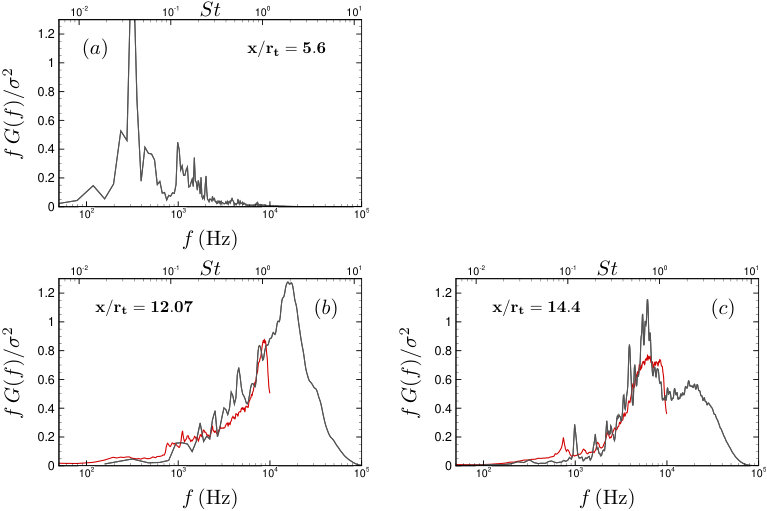 Figure 10
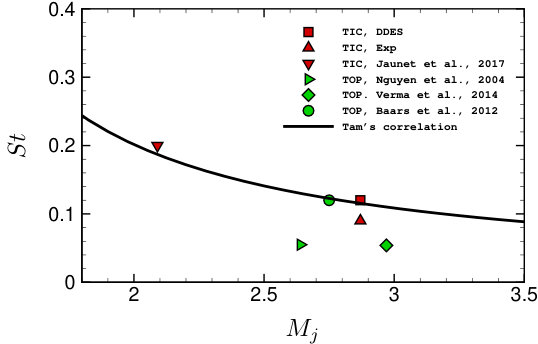 Figure 11
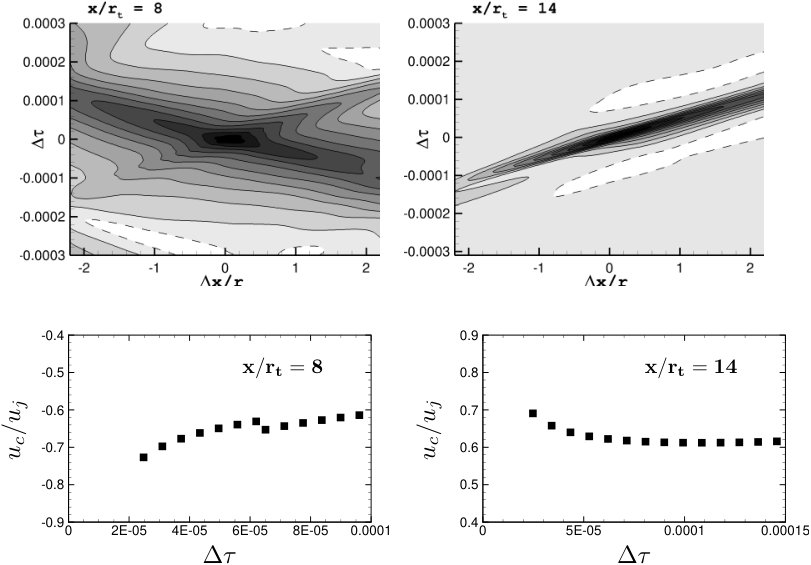 Figure 12
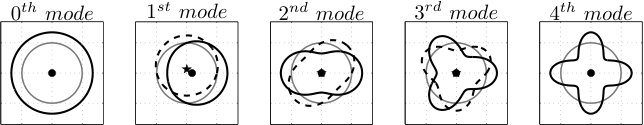 Figure 13
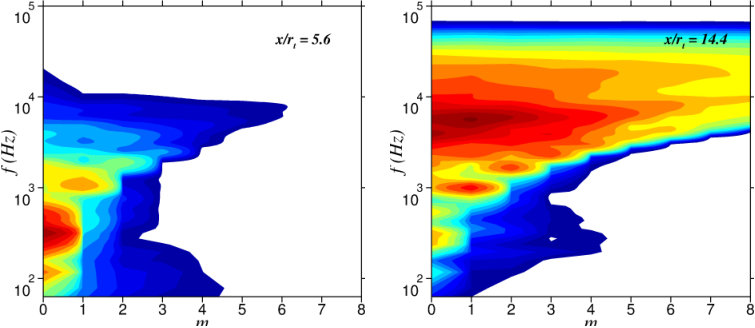 Figure 14
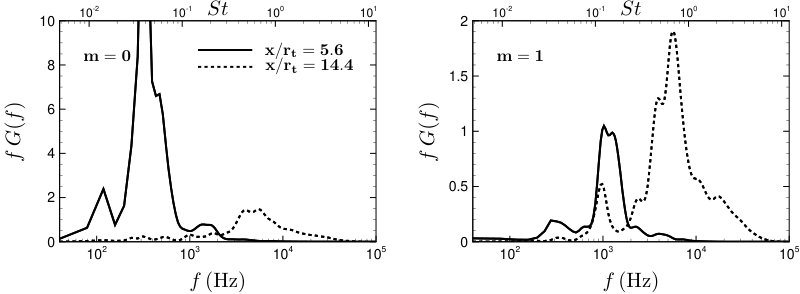 Figure 15
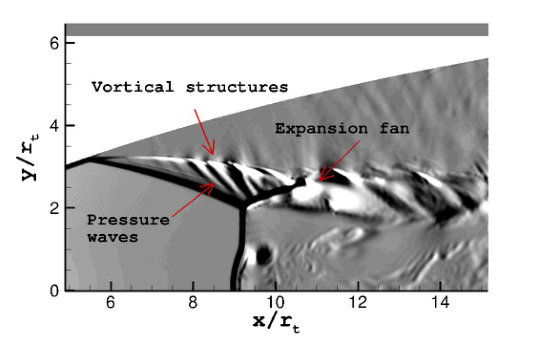 Figure 16
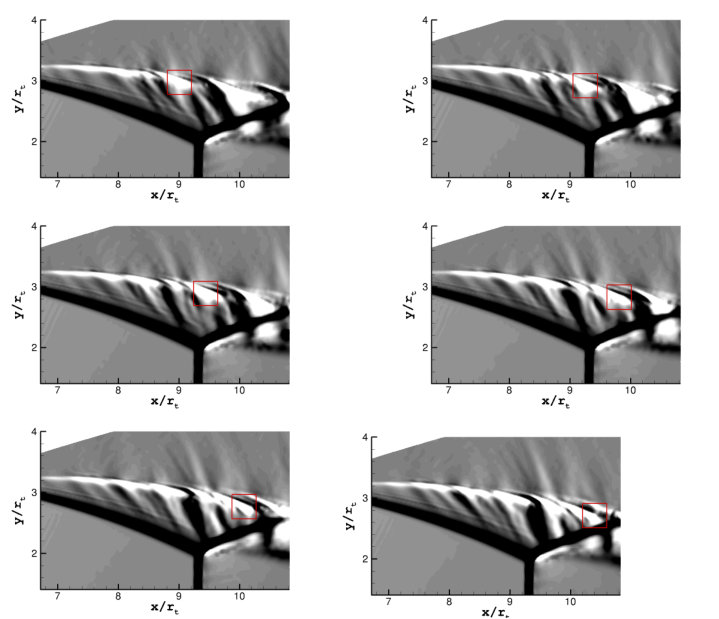 Figure 17
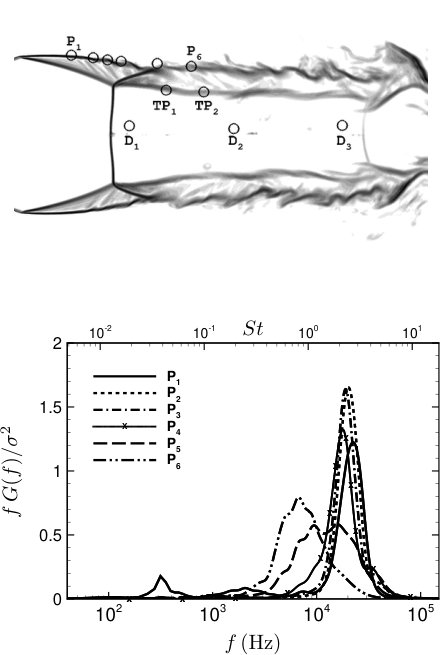 Figure 18
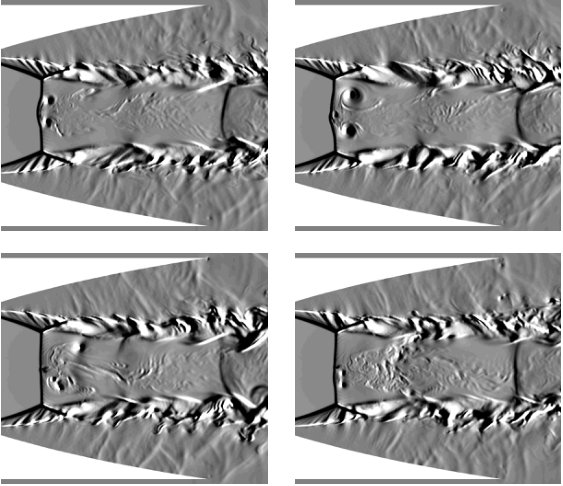 Figure 19
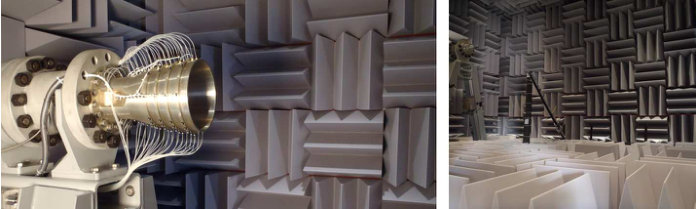 Figure 2
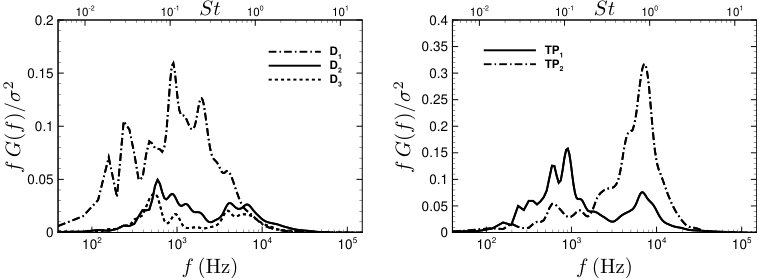 Figure 20
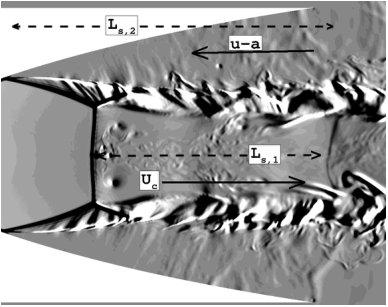 Figure 21
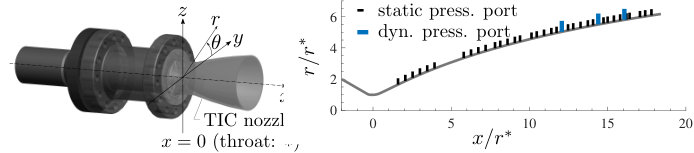 Figure 3
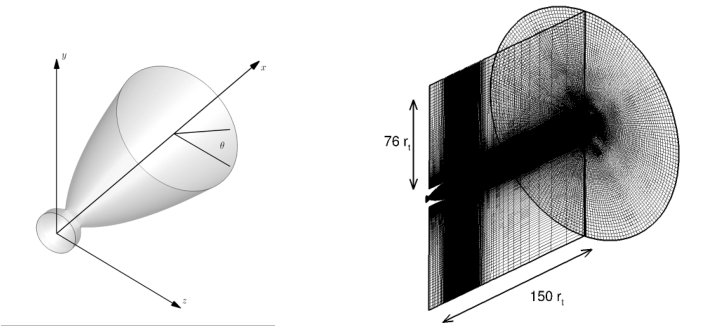 Figure 4
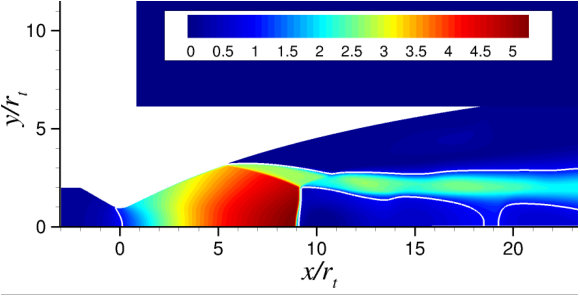 Figure 5
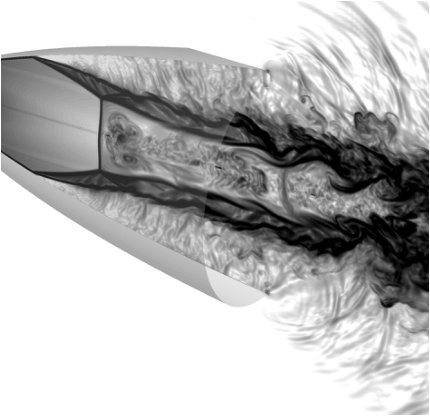 Figure 6
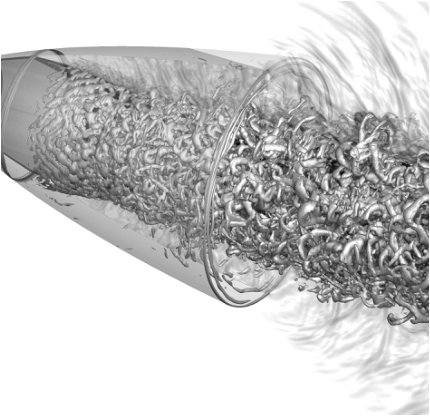 Figure 7
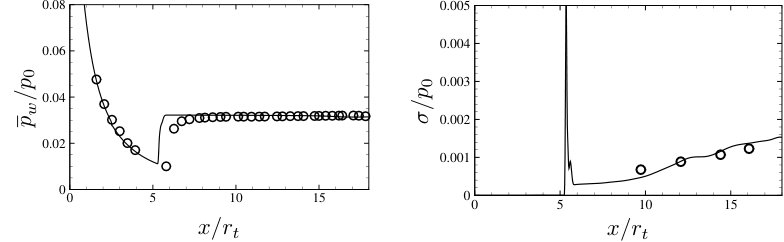 Figure 8
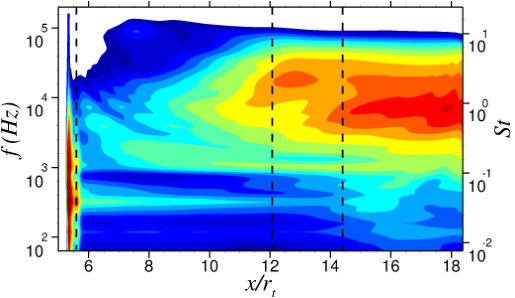 Figure 9
Peer Reviews
No public reviews on file for this paper yet. If you reviewed it on a platform where reviews are public (OpenReview, ICLR, NeurIPS, ICML), you can paste yours below so the community can read it here.
Videos
No videos yet. Explain this paper in a talk, walkthrough, or lecture? Add one.
Flow dynamics and wall-pressure signature in high-Reynolds number overexpanded nozzle with free shock separation
E. \nsMartelli1
\nsL. \nsSaccoccio2
\nsP.P. \nsCiottoli2
\nsC.E. \nsTinney3 \nsW.J. \nsBaars4 and \nsM. \nsBernardini2
1Dipartimento di Ingegneria, Università degli Studi della Campania ”L. Vanvitelli”, Caserta, 81100, Italy
2Dipartimento di Ingegneria Meccanica e Aerospaziale, Sapienza Università di RomaRoma, 00184, Italy
3Department of Mechanical Engineering, University of Texas at Austin, Austin, TX 78713, USA
4School of Engineering, RMIT University, Melbourne, Victoria 3010, Australia
Abstract
A delayed detached eddy simulation (DDES) of an overexpanded nozzle flow with shock-induced separation is carried out at a Reynolds number, based on the nozzle throat diameter and the stagnation chamber properties, equal to . The flow unsteadiness, characterised by self-sustained shock oscillations, induces local unsteady loads on the nozzle wall as well as global off-axis forces. Despite several studies in the last decades, a clear physical understanding of the driving factors of the unsteadiness is still lacking. The geometry under investigation is a sub-scale truncated ideal contour (TIC) nozzle, which has been experimentally tested at the University of Texas at Austin. Under the current conditions, the nozzle operates in a highly-overexpanded regime (relevant to the nozzle ignition) and comprises a conical separation shock within the nozzle contour, merging into a Mach disk in the nozzle centre. Our current study focuses on the unsteady pressure signature on the nozzle wall, through the use of Fourier-based spectral analysis performed in time and in the azimuthal wavenumber space. The numerical data from the detached eddy simulation well agrees with the experimental measurements in terms of mean and fluctuating wall pressure statistics. The frequency spectra are characterised by the presence of a large bump in the low frequency range associated to a breathing motion of the shock system and a broad and high amplitude peak at high frequencies generated by the turbulent activity of the detached shear layer. Moreover, a distinct peak at an intermediate frequency (of the order 1000 Hz) is observed to persist in the wall-pressure spectra along the nozzle wall. The analysis of the pressure signals in the azimuthal wavenumber space indicates that this peak is clearly associated to the first (non-symmetrical) pressure mode () and it is thus connected to the generation of side loads. Furthermore, it is found that the unsteady Mach disk is characterised by an intense vortex shedding activity and the interaction of these vortices with the second shock cell is a key factor in the sustainment of an aeroacoustic feedback loop within the nozzle.
1 Introduction
The performance of first-stage liquid rocket engines is highly dependent on the fluid dynamic behaviour of the expansion nozzle and for optimisation purposes, large values of the ratio between the exit and throat areas are desirable. The maximum limit to this ratio is imposed by the need to avoid internal flow separation, since at sea level the flow is highly overexpanded. However, during the start-up phase the chamber pressure is below the design pressure and the flow separates from the nozzle wall. This condition is characterised by complex physical features, including the formation of a shock-wave system that adapts the exhaust flow to the higher ambient pressure, shock-wave/boundary-layer interactions, and a turbulent recirculating zone with a pulsating pressure field. As a global effect, the nozzle experiences non-axial forces, known as side-loads, which can be of sufficient strength to cause structural damage to the engine (Nave & Coffey, 1973). Several investigations (Chen et al., 1994; Nasuti & Onofri, 1998; Hagemann et al., 2002; Ostlund, 2002) demonstrated the existence of two kinds of flow separation regimes: the free shock separation (FSS) and the restricted shock separation (RSS). A brief and complete literature review can be found in Hadjadj & Onofri (2009). The occurrence of a specific pattern (FSS or RSS) is mainly determined by two parameters, the geometry and the nozzle pressure ratio (NPR), i.e. the ratio between the chamber and the ambient pressure. Truncated ideal contour (TIC) and conical nozzles display only the FSS type, which is shown in figure 1 (left panel). The adverse pressure gradient causes the separation of the flow at a certain axial location and the consequent formation of compression waves which coalesce in a conical shock (separation shock). This shock reflects on the nozzle axis of symmetry through a Mach disk and a second oblique leg (reflected shock). These three shocks meet at the so-called triple point (TP). This type of interaction is named free since the separated shear layer never reattaches to the nozzle wall. Thrust-optimised contour (TOC) and thrust-optimised parabolic (TOP) nozzles display both FSS and RSS depending on the nozzle pressure ratio. Figure 1 (right panel) shows the restricted shock separation, which is characterised by a cap-shock pattern (Nave & Coffey, 1973) and the re-attachment of the separated shear layer to the wall with a huge recirculation bubble (not shown in the figure) on the nozzle centreline (Nasuti & Onofri, 1998).
Since the early investigations reported in literature, it was argued that lateral forces are mainly due to oscillations of the internal shock system inside the nozzle. In TOP and TOC nozzles, it has been observed that the side-load history displays an important peak when the flow transitions from FSS to RSS (Frey & Hagemann, 2000; Ostlund, 2002). The first research efforts were directed towards the development of analytical and empirical methods to predict the occurrence of side-loads and quantify their magnitude. With this perspective, Schmucker (1984) developed a model based on the idea of a tilted separation line, while Dumnov (1996) considered oscillations of the separation line excited by random pressure pulsations in the separated flow region. These methods rely on many approximations and are primarily tailored to design purposes.
Only recently, research has been directed towards a more physical understanding of the origin of aerodynamic loads and the consequent generation of lateral forces. Our present work focuses on the FSS pattern, as it is common to all kind of nozzles and is characterised by an intense side-load activity (Ruf et al., 2010). Baars et al. (2012) and Baars & Tinney (2013) have carried out an experimental campaign to analyse the unsteadiness of the wall pressure in a cold-gas, sub-scale parabolic nozzle in both FSS and RSS configurations. They found that the power spectral density of the wall pressure fluctuations in FSS state is characterised by low and high-frequency broad peaks, associated to the shock-wave/boundary-layer interaction and to the development of the turbulent shear layer. Furthermore, the authors were able to isolate the effect of the anti-symmetric azimuthal mode, the only one linked to the side-load generation. More recently, Jaunet et al. (2017) have observed experimentally the evolution of the FSS pattern and the associated azimuthal Fourier modes by varying the NPR in a sub-scale TIC nozzle. As a major result, they showed that the low-frequency mode is mostly axi-symmetric and confined in the nozzle, while the developing turbulent shear layer leaves a high-frequency signature in the pressure and velocity fields, both inside and outside the nozzle. In addition, they also found highly organised pressure structures at an intermediate frequency range, mainly associated with the anti-symmetric pressure mode. They argued that these structures may be attributed to a screech-like mechanism (Raman, 1999) rather than to a transonic resonance (Wong, 2005).
All the experimental work done so far seems to confirm that the various frequency modes identified are general features of the free shock separation pattern. However, the experiments on axi-symmetric nozzles suffer from the lack of flow measurements inside the nozzle itself, due to the challenging flow conditions and absence of optical access. Therefore, numerical simulations represent an important complementary tool to gain a more complete insight into the flow physics of separated rocket nozzle flows, and provide the possibility of addressing important open questions: i) which kind of dynamics and frequency content characterise the vortices in the initial part of the supersonic shear layer? ii) If a screech-like mechanism is present due to the interaction of the turbulent shear layer and the shock cell inside the jet, which role do the Mach disk and the subsonic flow region behind it play in the feedback loop?
Unsteady Reynolds averaged Navier-Stokes (URANS) equations have been used in the past to evaluate the level of the side-loads in sub-scale models and rather good results were obtained by Deck & Guillen (2002) and Deck & Nguyen (2004). Nevertheless, modelling the global effect of the turbulent scales as done in the URANS approach could hide the important flow processes leading to the formation of the aerodynamic unsteady loads. On the other hand, performing a wall-resolved large eddy simulation (LES) of this kind of flows, characterised by Reynolds numbers of the order of , requires impractically high computational expenses. A valid alternative is then represented by the use of the detached eddy simulation (Spalart et al., 1997) (DES), a hybrid RANS/LES method that allows to simulate high-Reynolds number flows involving massive flow separation. In fact, in this approach, attached boundary layers are treated in RANS mode, lowering the computational requirements, while the most energetic turbulent scales of separated shear layers and turbulent recirculating zones are directly described by the LES mode of the method. Nevertheless, very few DES simulations of separated nozzle flows can be found in literature. Deck (2009) and Shams et al. (2013) presented a delayed detached eddy simulation (DDES) of the end-effect regime in an axi-symmetric nozzle flow characterised by a RSS pattern. While the main flow properties were rather well reproduced by the simulations, the computed main frequency resulted to be higher than in the experiment. As far as FSS is concerned, to the authors knowledge, the only DES available has been reported by Larusson et al. (2016), who exclusively focused on the prediction of the side-load magnitude.
In this study, we present the results of a detached eddy simulation of a TIC nozzle with flow separation. The geometry has been tested at the University of Texas at Austin, where measurements of the unsteady wall-pressure signals were recorded. The analysis is first focused on the behaviour of the wall-pressure signature and on the physical mechanisms leading to the generation of the aerodynamic loads. The numerical results are then used to investigate and characterise those parts of the flow not accessible in the experiments, as the Mach disk region and the initial part of the annular supersonic shear layer.
The paper is organised as follows. First, the experimental apparatus and instrumentation are described in section 2. Then, the delayed detached eddy simulation approach, the numerical solver and the computational setup are presented in section 3. After providing an overview of the flowfield organisation in section 4, the main features of the wall pressure signature are analysed in section 5 by means of spectral analysis (through a wavenumber-frequency decomposition) and the evaluation of space-time correlations. In section 6 the attention is then focused on the dynamics of the annular supersonic shear layer and of the Mach disk region, and a discussion is presented about the possible existence of an aeroacoustic feedback loop within the nozzle. Conclusions are finally given in section 7.
2 Main features of the experimental campaign
2.1 Facility and nozzle test article
The rocket-exhaust nozzle under investigation was experimentally tested at The University of Texas at Austin. A short description of the facility is here provided (further details can be found elsewhere, Baars & Tinney, 2013; Baars et al., 2014). An anechoic chamber with interior dimensions of approximately 5.74 m in length (parallel to the nozzle’s centreline), 4.52 m in width and 3.66 m in height forms the outer perimeter of the test space. The chamber’s wall-design yields a fully-anechoic environment for frequencies larger than 100 Hz, and allows for the aeroacoustic investigations of rocket-nozzle flows (e.g. Donald et al., 2014). A rig situated within the centre of the chamber provides the air supply to the nozzle via an instrumented, blown-down compressed air system. The nozzle exhausts through a 1.8 m2 acoustically-treated duct, while on the upstream side a 1.5 m2 inlet provides an ambient air supply to the chamber.
The reduced-scale nozzle under investigation is a TIC nozzle, designed by the Nozzle Test Facility team at NASA Marshall Space Flight Center. The length of the diverging nozzle contour is 79% of that of a 15*∘* conical nozzle with the same area ratio; this is a standard truncation length for ideal contour nozzles (Rao, 1958). Basic geometric properties of the nozzle are a throat radius of mm, an exit radius of mm and a throat-to-exit length of mm. The exit-to-throat area-ratio is and governs a design exit Mach number of at a nozzle pressure ratio (NPR) of 970. Photos of the nozzle and the test environment are shown in Figure 2.
2.2 Operating conditions and instrumentation
For this current study, a constant NPR of nominally 30.35 was maintained for approximately 10 seconds. Data of static and dynamic wall pressure sensors were acquired and form the validation data for the DDES of the flow. Static wall pressures were measured using two Scanivalve DSA3218 gas pressure scanners, to which a total of 34 static pressure ports were connected. These ports were oriented along the axial direction of the nozzle contour, between and 17.80. Via this set-up, it is ensured that axial static wall-pressure profiles provide the location of the separation shock foot. For the fluctuating wall pressure, a total of nine time traces are utilized. These time histories were acquired using Kulite XT-140 dynamic pressure transducers with a dynamic range of 100 psia ( % full-scale output), installed in such a way that their protective B-type screens, with a 2.62 mm outside diameter, were flush with the interior surface. These screens limit the effective frequency response up to 20 kHz. All channels were sampled simultaneously at a rate of kHz using the appropriate signal conditioning on a National Instruments PXI based system. Transducers were installed at three axial stations in the nozzle: , 14.40 and 16.07, with three transducers per axial location at different azimuth angles. Finally, Figure 3 displays a schematic of the nozzle, the nozzle contour and indicates the locations of the pressure ports.
3 Computational strategy
3.1 Physical model
We solve the three-dimensional Navier-Stokes equations for a compressible, viscous, heat-conducting gas
[TABLE]
where is the density, is the velocity component in the -th coordinate direction (), is the total energy per unit mass, is the thermodynamic pressure. The total stress tensor is the sum of the viscous and the Reynolds stress tensor,
[TABLE]
where the Boussinesq hypothesis is applied through the introduction of the eddy viscosity , is the strain-rate tensor and the kinematic viscosity, depending on temperature through Sutherland’s law. Similarly, the total heat flux is the sum of a molecular and a turbulent contribution
[TABLE]
where and are the molecular and turbulent Prandtl numbers, assumed to be 0.72 and 0.9, respectively.
3.2 Turbulence modelling
Because of the high-Reynolds number of the flow investigated in this work, the adopted numerical methodology is the delayed detached eddy simulation (Spalart et al., 2006), which belongs to the family of the hybrid RANS/LES methods. Our implementation is based on the Spalart-Allmaras (SA) turbulence model, which solves a transport equation for a pseudo eddy viscosity
[TABLE]
where is the model length scale, is a near-wall damping function, a modified vorticity magnitude, and model constants. The eddy viscosity in Eq. 2 is related to through , where is a correction function designed to guarantee the correct boundary-layer behaviour in the near-wall region. In DDES the destruction term in Eq. 4 is designed in such a way that the model reduces to pure RANS in attached boundary layers and to a LES sub-grid scale model in flow regions detached from walls. This goal is accomplished by defining the length-scale as
[TABLE]
where is the distance from the nearest wall, is the subgrid length-scale that controls the wavelengths resolved in LES mode and is a calibration constant equal to 0.20. The function , designed to be [math] in boundary layers and in LES regions, is defined as
[TABLE]
where is the velocity gradient and the von Karman constant. The introduction of distinguishes DDES from the original DES approach (Spalart et al., 1997) (denoted as DES97), guaranteeing that boundary layers are treated in RANS mode also in the presence of particularly fine grids, for which the spacing in the wall-parallel directions does not exceed the boundary layer thickness. This precaution is needed to prevent the phenomenon of modeled stress depletion, consisting in the excessive reduction of the eddy viscosity in the region of switch (grey area) between RANS and LES, which in turn can lead to grid-induced separation.
Differently from the original DDES formulation, the sub-grid length scale in this work is defined according to Deck (2012), and it depends on the flow itself, through as
[TABLE]
where , and . The main idea of this formulation is to take advantage of the function to switch between , needed to shield the boundary layer, and , needed to ensure a rapid destruction of modelled viscosity to unlock the Kelvin-Helmholtz instability and accelerate the passage to resolved turbulence in the separated shear layer. The problem of modeled stress depletion, the need of avoiding the delay in the onset of shear instabilities and, more in general, the management of the hybridization strategy of RANS and LES are well-known challenges, whose solutions are still today the subject of modelling efforts (Haering et al., 2019).
3.3 Flow solver description
The simulations have been carried out by means of an in-house compressible flow solver, which solves the compressible Navier-Stokes equations on structured grids. In the flow regions away from the shock, the spatial discretization consists of a centred, second-order, finite volume scheme (Pirozzoli, 2011). The approach is based on an energy consistent formulation that makes the numerical method extremely robust without the addition of numerical dissipation (Pirozzoli, 2011). This feature is particularly useful in the flow regions treated in LES mode, where in addition to the molecular, the only relevant viscosity should be that provided by the turbulence model. Near discontinuities, identified by the Ducros shock sensor (Ducros et al., 1999), the scheme switches to third-order Weno reconstructions for cell-faces flow variables. The gradients normal to the cell faces needed for the viscous fluxes, are evaluated through second-order central-difference approximations, obtaining compact stencils and avoiding numerical odd-even decoupling phenomena. A low-storage, third-order Runge-Kutta algorithm (Bernardini & Pirozzoli, 2009) is used for time advancement of the semi-discretized ODEs’ system. The code is written in Fortran 90, it uses domain decomposition and it fully exploits the message passing interface (MPI) paradigm for the parallelism. The accuracy and reliability of the flow solver have been assessed in a series of recent studies dedicated to DDES of shock waves boundary layer interactions (Martelli et al., 2017, 2019; Memmolo et al., 2018).
3.4 Test case description and computational setup
The parameters of the simulation were selected to reproduce the operating conditions described in 2.2, characterised by total pressure MPa and ambient pressure MPa, resulting in a nozzle pressure ratio NPR = 30.35. The total temperature and the static ambient temperature have been set equal to 300 K. The nozzle Reynolds number, evaluated assuming the throat radius as reference length and density , speed of sound and molecular viscosity taken at the stagnation-chamber condition is
[TABLE]
The three-dimensional computational domain has been designed to include the nozzle and an extended portion of the external ambient, as shown by the schematic in figure 4. Starting from the throat station, the outflow boundary extends up to 150 throat radii in the longitudinal direction, while in the radial direction the external boundary is placed at 76 from the symmetry axis. As far as the boundary conditions are concerned, total pressure, total temperature and flow direction are imposed at the nozzle inflow. An assigned downstream pressure equal to is prescribed on the outside boundaries, except for the outflow boundary on the right of the computational domain, where non-reflecting boundary conditions are imposed. The nozzle walls are treated by prescribing the no-slip adiabatic condition.
To select the mesh resolution, a preliminary sensitivity study was performed by means of steady-state axi-symmetric RANS simulations. The final grid includes approximately 85 million cells, with 192 cells in the azimuthal direction (see figure 4). The RANS solution was used to initialise the three-dimensional DDES computation. To promote the development of turbulent structures and the passage from modelled to resolved turbulence, random perturbations were added at the initial time of the 3D simulation to the streamwise velocity field, with a maximum magnitude of of the inflow velocity.
The computation was run with a time step s and a relatively long time span was simulated s, which guarantees coverage of frequencies down to at least Hz. A total of 500 full three-dimensional fields have been collected at time intervals of s for post-processing purposes. Furthermore, samples of the pressure field at the wall and in an azimuthal plane have been recorded at shorter time intervals of s to guarantee sufficient resolution for the frequency analysis. Running with 2304 processors of the Tier-0 system Marconi (Cineca supercomputing facility), the cost of the simulation was approximately 3.17 Mio CPU hours.
4 Flowfield organisation
The salient features of the free shock separation pattern are illustrated in figure 5, where contours of the mean Mach number field obtained by averaging in the azimuthal direction and time are reported in the x-r plane. Due to the flow overexpansion a shock system appears inside the nozzle to adapt the exhaust pressure to the ambient pressure. The consequent strong adverse pressure gradient induces the flow separation and the formation of a shear layer that does not reattach to the wall. The wall region is dominated by an important subsonic recirculating flow. The shock system comprises a conical shock, which is reflected as a Mach disk on the nozzle axis. The reflection is completed by a second conical shock, which deflects the inclined supersonic annular jet in a direction nearly parallel to the nozzle axis. Behind the Mach disk the flow is subsonic at the beginning, then it expands and, through a fluid-dynamic throat, again accelerates up to a supersonic velocity, requiring the occurrence of a new shock to adapt the jet pressure to the ambient level. It is worth to point out that the flow pattern resembles that of a classical overexpanded jet but, differently from aeronautical applications, the jet starts well inside the nozzle due to flow separation and it is then a wall-confined jet.
The unsteady features of the flow are highlighted by showing contours of the density-gradient magnitude in figure 6 and an iso-surface of the Q-criterion (Hunt et al., 1988) in figure 7. The latter is a well-known qualitative method used to identify tube-like vortical structures and in this analysis it has been modified to account for the effect of compressibility (Pirozzoli et al., 2008). Let be the gradient velocity tensor and its traceless part, turbulent structures are extracted by visualising regions with a positive iso-value of the second invariant of , defined as , since in these regions rotation exceeds the strain. Various features are clearly visible in the visualisation of figures 6 and 7, including the generation of turbulence in the annular supersonic shear layer, the sudden break-up of the jet downstream and the radiation of intense waves in the density field, known as Mach waves. These Mach waves are observed in the shadowgraphy images of Canchero et al. (2016) and corroborate the findings shown here. Finer turbulent scales can be seen downstream the Mach disk, associated with the bending of the shock (see the discussion in section 6).
The isosurface of the Q-criterion also shows that the initial part of the shear layer is not dominated by the Kelvin-Helmotz instability with its coherent azimuthal rollers, as usually observed in incompressible mixing layers. In the present case, oblique modes are observed to dominate the initial part of the shear-layer, leading to small-scale three-dimensional structures. This change is due to the high value of the local convective Mach number () at the beginning of the shear layer, in agreement with the findings of Sandham & Reynolds (1991), who demonstrated that when , the oblique modes dominate the instability process in planar compressible shear layers. Similar structures were observed by Simon et al. (2007) in the supersonic annular shear layer past an axi-symmetric trailing edge, characterised by a convective Mach number greater than one.
5 Analysis of the wall-pressure signature
Characteristics of the wall pressure are described in this section. First, in 6.1, it is evaluated how the spectral content of the wall-pressure fluctuations vary throughout the axial direction of the nozzle. In 6.2 our view of the physics is enhanced by further considering azimuthal decompositions of the fluctuating wall-pressure field.
5.1 Evolution along the longitudinal axis
The distribution of the mean wall pressure (), averaged in time and in the azimuthal direction, is shown in figure 8a compared with the experimental data obtained from the static sensors. The wall pressure decreases until the incipient separation point, then the oblique shock causes an abrupt increase up to a plateau value close to the ambient pressure level. The numerical data show a very good agreement with the experiments, and a small difference is only observed in the average position of the separation point, that can be attributed to the unavoidable delay in the transition from the RANS to the LES mode (Shur et al., 2015). We point out that the remarkable agreement between DDES and the experiment in the prediction of the plateau pressure value is a strong evidence that the LES mode is fully active in the subsonic recirculation zone and that the simulation correctly captures the exchange of momentum between the main jet and the separated flow, dominated by the high convective Mach number of the shear layer (Pantano & Sarkar, 2002).
The standard deviation of the wall pressure signals () is shown in figure 8b, together with the corresponding experimental values obtained from the dynamic sensors. The behaviour of along the x-axis is typical of shock-wave/turbulent boundary layer interactions (Dolling & Or, 1985), characterised by a dominant sharp peak at the separation-shock location, followed by a lower level downstream, where the turbulent shear layer develops. The experimental data points are located well downstream of the shock-separation region and match well with the numerical data, except at the first experimental point, probably due to the delay in the formation of the turbulent shear layer in the numerical simulation.
The premultiplied wall-pressure spectra are reported in figure 9 as a function of both the longitudinal coordinate and frequency . This representation as a two-dimensional map provides a complete picture of the spatial distribution of the energy along the nozzle wall and of the contribution of the different frequencies to the total energy of the signal. The power spectral densities (PSD) have been estimated based on the Welch method, i.e., subdividing the overall pressure record into 12 segments with 50% overlapping, which are individually Fourier-transformed. The frequency spectra are then obtained by averaging the periodograms of the various segments, thus minimizing the variance of the PSD estimator. Finally, for visualisation purposes, the Konno-Ohmachi smoothing (Konno & Ohmachi, 1998) has been applied, whose filter function guarantees a constant bandwidth on a logarithmic scale. The spectral map shows that there are two regions with high fluctuation energy, according to the distribution of the standard deviation. The first zone is located in correspondence of the separation point (), where the signature of the shock motion is visible, characterised by a broad peak in the low-frequency range and a narrow footprint in the spatial direction. The second region characterised by high levels of pressure fluctuations is located in the high-frequency range (around Hz) and is associated with the development of the separated shear layer, whose convected vortical structures radiates pressure disturbances which increase in intensity downstream. It is worth to point out that, overall, the distribution of the pressure fluctuation energy shown in figure 9 is qualitatively similar to that previously observed in canonical shock wave boundary layer interactions (Dupont et al., 2006), despite the significant differences in the geometrical configuration and shock topology (open separation bubble) of the present flow case.
To better visualise the frequency content of the wall-pressure fluctuations, figure 10 shows the premultiplied spectra at three representative axial stations corresponding to the vertical lines in figure 9. Note that, for the purpose of comparison, the curves are normalized by the integral of the spectra over the range of frequencies that are being resolved by the experiment. The first station is selected immediately downstream of the separation point (), whereas the other two correspond to positions where experimental data from dynamic probes are available ( and ). At , the spectrum corresponding to the shock motion shows the presence of a high-amplitude, broad bump, between 100 Hz and 2000 Hz approximately, with a maximum at and a secondary peak located at . According to Baars et al. (2015) the low-frequency peak can be attributed to an acoustic resonance, see for example Wong (2005) and references therein, occurring between the exit plane and the shock system, described by the one-quarter standing wave model in a open-ended pipe. The fundamental frequency predicted by the model is given by
[TABLE]
where is the ambient speed of sound, is the Mach number in the separated region at the nozzle exit and is the distance between the averaged separation position and the nozzle lip. Using the data extracted from DDES, m/s and , we obtain an acoustic frequency , that well compares with the peak in the spectrum at 316 Hz. Moving downstream a different picture emerges, characterised by a shift of the spectra towards the high-frequency range (around ), caused by the three-dimensional turbulent structures of the developing shear layer. As expected, the peak frequency is observed to shift at lower values moving in the streamwise direction, as a consequence of the growing turbulent eddies. Interestingly, a peak located at intermediate frequencies ( for DDES, for the experiment) is visible in the spectra downstream of the shock location, whose nature will be investigated in the following. The scenario described above is depicted by both the numerical and experimental spectra, which are found to display a very good agreement except very close to the maximum frequency resolved by the measurements, where the rapid roll-off of the spectra is most likely due to filtering effects of pressure sensors. It is worth to highlight that the main features of the power spectral densities here described can also be found in previous experimental studies performed for various TOP nozzles at NPR’s corresponding to the FSS pattern (Nguyen et al., 2003; Baars et al., 2012; Verma & Haidn, 2014) and a different TIC nozzle Jaunet et al. (2017). To better characterise the intermediate peak it is useful to introduce a Strouhal number, defined as (Tam et al., 1986; Canchero et al., 2016):
[TABLE]
where is the fully expanded jet velocity
[TABLE]
is the stagnation temperature, the specific heat ratio, the air constant, is the fully adapted Mach number, which is a function of the nozzle pressure ratio through the isentropic relation
[TABLE]
The length-scale is computed as a function of , the design Mach number and the nozzle exit diameter through the mass flux conservation
[TABLE]
The non-dimensional frequencies of the intermediate peak from the different experimental flow cases cited above have been reported in figure 11 as a function of . A decreasing trend of with the fully adapted Mach number seems to emerge from the data. This behaviour was also identified by Jaunet et al. (2017), who proposed that this peak could be attributed to a sort of screech (Raman, 1999), an aeroacoustic feedback mechanism involving downstream propagating disturbances in the shear layer, the interaction with the shock cells and upstream propagating acoustic waves. According to expression proposed by Tam et al. (1986) the screech frequency can be evaluated as
[TABLE]
where is the ambient temperature. This correlation, plotted in figure 11, shows that the characteristic screech frequency decreases with increasing (or equivalently with increasing nozzle pressure ratio), mainly due to the shortening of the shock cells. Despite a certain level of dispersion, the proximity of the experimental data and of the DDES prediction to the empirical correlation suggests that the intermediate peak could be attributed to a screech phenomenon.
Additional insights into the propagation of pressure disturbances, in terms of direction and velocity, can be gained by inspection of the space-time correlation coefficient, defined as
[TABLE]
where
[TABLE]
is the space-time correlation function, and are the spatial separations in the streamwise and azimuthal directions, is the time delay, and the overbar denotes averages taken with respect to the azimuthal direction (exploiting homogeneity) and time. Figure 12 reports contours of the space-time correlation coefficient taken at two stations along the nozzle wall, and . In both cases the shape of the contours reflects the convective nature of the pressure field, but while at the latter station () the pressure signal is mainly characterised by a coherent downstream propagation of pressure-carrying eddies, at the first location () it is also well visible the presence of upstream-propagating disturbances, coming from the interaction of the vortex structures with the reflected shock and with the second Mach disk, located near the nozzle exit section.
From the maps of the space-time correlation coefficient it is possible to evaluate the convection velocities of the pressure-carrying eddies. Following Bernardini & Pirozzoli (2011), the convection speed corresponding to a given time delay is defined as the ratio taken at the spatial separation value where a local maximum of is attained. The resulting convection speeds are displayed in figure 12 (bottom panels), as a function of the time separation . The convection velocities, in both directions, are observed to slightly decrease (in magnitude) with , indicating that large-scale disturbances move slower than the small eddies. We point out that the convection speed of pressure disturbances is in the range between and , in agreement with the empirical value quoted by Tam et al. (1986).
5.2 Azimuthal decomposition of the pressure field
To gain insights into the origin of the aerodynamic loads and characterise how the energy is distributed among the different modes it is useful to carry out a Fourier-azimuthal decomposition of the unsteady wall pressure signature. To that purpose we consider the azimuthal wavenumber-frequency spectrum, defined as
[TABLE]
where is the mode number in the azimuthal direction. We remind that, by symmetry considerations, only the antisymmetric mode can provide a contribution to the aerodynamics side loads, as illustrated by figure 13, where a schematic of the first four azimuthal pressure modes is reported. The wavenumber-frequency spectrum is reported in figure 14 for two representative stations, corresponding to a location close to the separation shock () and in the recirculation bubble (). In addition, to better quantify the evolution of the modes along the nozzle wall, single cuts are taken from the wavenumber-frequency maps for the first two azimuthal modes and are reported in figure 15. The figures reveal that the shock motion has a clear organisation in the azimuthal direction, with the dominant peak at Hz () exclusively associated with the axi-symmetric (breathing) mode , and the secondary peak at Hz () linked to the first () Fourier mode. Essentially, the emerging picture is that of a shock characterised by a low-frequency piston-like motion, with the excitation of non symmetrical modes at intermediate frequency. Moving at the downstream station () the contribution of the breathing mode at low frequencies is strongly reduced, whereas the two peaks located at Hz (), still persist. As previously observed in the spectra of figure 9, at this station most of the energy is contained in the high-frequency range, and it is spread in a wide range of azimuthal modes, reflecting the turbulent character of the wall-pressure fluctuations in the recirculation region.
6 Annular supersonic shear layer and Mach disk region
6.1 Coherent structures dynamics and spectral analysis
Instantaneous flowfields are used in this section to assess the existence and evolution of coherent vortices along the detached shear layer.
Figure 16 shows the streamwise derivative of the density in the first part of the separated shear layer. The black areas indicate compression (or shock) regions, while the white areas indicate expansion zones. It is apparent from the figure the formation of coherent vortices at the beginning of the shear layer, highlighted by the presence of pressure waves radiating in the lower side (where the flow is supersonic) that interacts with both the separation and the reflected shock. The reflection of the latter shock as an expansion fan when it interacts with the upper boundary of the annular shear layer is also well visible in the figure.
The evolution of vortical structures in the shear-layer is tracked in figure 17, where a sequence of snapshots of the streamwise component of the density gradient is reported. The eddies appear to be characterized by an elliptical shape and to be convected without significant changes of their shape, and without merging, until they interact with the reflected shock. It is worth to point out that our findings are very similar to those reported by Simon et al. (2007) for the analysis of the vortex dynamics in the compressible shear layer past an axi-symmetric trailing edge: in that case some merging between vortices was visible, but without the well-known rotational pairing which contributes to the growth rate of subsonic shear layers.
To complete the description of the separated shear layer, figure 18 shows the results of a spectral analysis of the pressure fluctuations, conducted considering six probes, denoted as . The first four probes are located before the interaction of the reflected shock with the shear layer, whereas the last two pressure sensors are placed downstream of this interaction. The signal from sensor is characterised by a first small peak centred around 316 Hz (), that is connected to the shock movement. The second high-frequency and high-energy broad peak is centred around 20 kHz () and it is the signature of the instability process of the shear layer. Moving downstream, the high-frequency component spreads to lower frequencies and the peaks of the spectra broaden, reflecting the growth of the turbulent structures in the developing shear layer. The contribution of the low-frequency peak rapidly disappears downstream, compared to the high-energy content of the pressure fluctuations given by the turbulent structures.
The region downstream of the Mach disk is characterised by an intense vortex shedding activity and consequent production of vorticity, well highlighted by the sequence of snapshots of reported in figure 19. In the first frame, the Mach disk is bent upstream and two counter-rotating vortices are emitted. The bending of the Mach disk is caused by two factors as discussed in Nasuti & Onofri (2009). First of all, the Mach number field upstream of the shock region is not uniform also in the radial direction, as clearly shown in figure 5. This means that, to adapt to the value of the static pressure in the subsonic flow (which is nearly uniform in a time and space average) the shock has to change its curvature in the radial direction in order to change its intensity. Secondly, the flow unsteadiness causes a continuous variation of the static pressure behind the shock, inducing the oscillation of the Mach disk and the variation of its curvature. The variation of the shock intensity in the radial direction causes an entropy gradient downstream and, as described by the Crocco’s theorem (Crocco, 1937), vorticity is produced. These structures are then convected downstream and impinge on the annular supersonic shear layer and on the second shock cell, in a non-symmetric way. The last picture (at s) shows the formation of two new counter-rotating vortices, but this time they are located below the centre line of the nozzle, indicating again the non-symmetric behaviour of this shedding phenomenon.
An inspection of the flow field along the simulation time also reveals that this activity is not continuous but rather intermittent, as clearly highlighted by the accompanying movie available online.
To further investigate the flow dynamics, several pressure probes have been placed downstream of the Mach disk (near the nozzle axis) and in the inner shear layer which originates from the triple point of the separation shock reflection, as shown by figure 18.
Figure 20 (left panel) shows the premultiplied spectra downstream of the Mach disk. The signal from the first probe () is characterised by a very broad bump, with the highest peak at 905 Hz (). This fluctuation energy is originated by the shock unsteadiness and its amplitude decreases moving downstream, as shown by the spectra at and . The internal vortices shed by the Mach disk irradiate pressure waves as they are convected, stretched and broken in smaller scales. This turbulence noise explain the broad shape of the spectra. The peak at 905 Hz () dominates also the initial part of the inner shear layer, as shown by the spectrum from the probe in the right panel of figure 20. This frequency is very close, and most likely correlated, to the intermediate peak frequency (1000 Hz, ) found in the wall pressure signature and attributed to the first Fourier azimuthal mode (see the discussion in Sec. 5). Again, moving from to , the amplitude of this peak decreases while the contribution from the developing turbulent shear layer becomes more and more important and it is characterised by a broad peak around 7000 Hz ().
6.2 Discussion of the feedback mechanism
It has been shown that the peak at Hz () agrees with the correlation proposed by Tam and that it is associated with the first Fourier azimuthal mode (). A similar agreement was also displayed by the experimental data of Jaunet et al. (2017). Those authors did not find any trace of the screech tone in the external ambient and speculated the existence of screech-like mechanism inside the nozzle, sustained by the presence of the internal subsonic flow region downstream of the Mach disk, which may provide a support for possibly upstream propagating waves. The numerical findings of the present DDES seem to provide support to the existence of an internal feedback loop. Following the model proposed by Powell (1953), which states that the screech temporal period can be considered as the sum of the time taken by the flow disturbances to propagate downstream one shock cell and the time needed by the acoustic waves outside the jet to propagate back over the same distance towards the nozzle lip, we propose a path for the feedback loop as shown in figure 21.
The vortical structures coming from the Mach disk and the triple point have to cover the distance 0.194 m before interacting with the second shock, whose perturbation causes the emission of acoustic waves. Since the flow upstream of the second shock is supersonic, the acoustic disturbances can travel upstream, with velocity , only through the turbulent recirculating zone external to the annular supersonic shear layer and adjacent to the nozzle wall. This path involves the length 0.26 m between the second shock and the separation line. When these acoustic waves reach the separation line, the whole shock system is perturbed and new instability waves are emitted from the detached shear layer and from the Mach disk. Therefore, as a first approximation, the total period of the loop, , can be modelled taking into account the distance for the convective downstream movement and the distance for the acoustic upstream movement:
[TABLE]
giving a screech frequency :
[TABLE]
Considering, approximately, a speed of sound in the subsonic separated region m/s, a longitudinal velocity m/s and a convective velocity , we found Hz (), a value reasonably close to the numerical prediction extracted from the spectra (Hz, ).
7 Conclusions
We have performed a delayed detached eddy simulation of an overexpanded separated flow in a TIC nozzle featuring a free shock separation (FSS), with the aim of characterising the unsteady pressure loads caused by the self-sustained shock motion and identifying the driving physical mechanisms. The DDES approach revealed itself to be a very powerful tool to investigate the flow dynamics at conditions (Reynolds number , NPR = 30.35) for which the shock system causes the flow separation well inside the nozzle, in a region that is not easily accessible to experimental instruments. The simulation results were validated against a comparison with measurements performed at the University of Texas at Austin, and a very good agreement was obtained in the distribution of mean and fluctuating wall-pressure statistics.
Fourier analysis in time and in the azimuthal direction has been carried out to describe the wall-pressure signature. We found that the spectrum at the separation point is characterised by a peak at Hz () and azimuthal mode , implying a low-frequency breathing (piston-like) motion of the shock system. This symmetric mode is most likely driven by an acoustic resonance, since its main frequency is well predicted by the one-quarter standing wave model. A secondary peak at intermediate frequencies ( Hz, ) was also observed, associated in the wavenumber space with the first azimuthal mode (), which is identified as the cause of the aerodynamic side loads. This non-symmetric pressure mode is also found to persist at the same frequency in the spectrum of the wall-pressure fluctuations in the turbulent recirculation zone. The characteristic frequency ( Hz) of this phenomenon reasonably agrees with the empirical correlation proposed by Tam et al. (1986) for the screech, suggesting the presence of a feedback loop similar to that observed for overexpanded external jets. Motivated by this observation a feedback-loop model has been proposed to identify the driving physical mechanisms in nozzle flows characterized by the free-shock separation pattern. The loop starts with the turbulent structures of the detached shear layer and with the intermittent vortex shedding activity of the Mach disk, occurring at a frequency comparable with the peak frequency of the wall pressure at the first azimuthal mode. These vortices propagate in the streamwise direction and interact with the second shock cell, irradiating acoustic waves able to travel upstream in the outer subsonic region. Finally, these perturbations excite new instabilities of the shear layer and of the shock system, closing the loop. These results thus provide support to the speculation recently made by Jaunet et al. (2017) on the importance of the internal subsonic region in the feedback loop and, most importantly, underline the key role of the strong vortex shedding activity of the Mach disk.
Acknowledgements.
M. Bernardini was supported by the Scientific Independence of Young Researchers program 2014 (Active Control of Shock-Wave/ Boundary-Layer Interactions project, grant RBSI14TKWU), which is funded by the Ministero Istruzione Università e Ricerca. The simulations have been performed thanks to computational resources provided by the Cineca Italian Computing Center under the Italian Super Computing Resource Allocation initiative (ISCRA B/DDES-TIC/HP10BZR88R).
The reference list from the paper itself. Each links out to its DOI / PubMed record.
- 1Baars et al. (2015) Baars, W.J., Ruf, J.H. & Tinney, C.E. 2015 Non-stationary shock motion unsteadiness in an axisymmetric geometry with pressure gradient. Exp. Fluids 56 (5), 92.
- 2Baars & Tinney (2013) Baars, W.J. & Tinney, C.E. 2013 Transient wall pressures in an overexpanded and large area ratio nozzle. Exp. Fluids 54 , 1468.
- 3Baars et al. (2014) Baars, W.J., Tinney, C.E., Wochner, M.S. & Hamilton, M.F. 2014 On cumulative nonlinear acoustic waveform distortions from high-speed jets. J. Fluid Mech. 749 , 331–366.
- 4Baars et al. (2012) Baars, W.J., Tinney, C. E., Ruf, J. H., Brown, A. M. & Mc Daniels, D. M. 2012 Wall pressure unsteadiness and side loads in overexpanded rocket nozzles. AIAA J 50 (1), 61–73, doi: 10.2514/1.J 051075.
- 5Bernardini & Pirozzoli (2009) Bernardini, M & Pirozzoli, S 2009 A general strategy for the optimization of Runge–Kutta schemes for wave propagation phenomena. J. Comput. Phys. 228 , 4182–4199.
- 6Bernardini & Pirozzoli (2011) Bernardini, M. & Pirozzoli, S. 2011 Wall pressure fluctuations beneath supersonic turbulent boundary layers. Physics of Fluids 23 (8), 085102.
- 7Canchero et al. (2016) Canchero, A., Tinney, C.E., Murray, N. & Ruf, J.H. 2016 Flow and acoustics of clustered rockets during startup. AIAA J. 54 , 1660–1669.
- 8Chen et al. (1994) Chen, C. L., Chakravarthy, S. R. & Hung, C. M. 1994 Numerical investigation of separated nozzle flows. AIAA J 32 (9), 1836–1843, doi: 10.2514/3.12181.