TL;DR
This paper introduces two automatic strategies to adjust the difficulty of C-tests by manipulating gap size and distribution, aiding personalized language learning and assessment.
Contribution
It presents novel methods for automatically controlling C-test difficulty through gap manipulation based on difficulty predictions.
Findings
Both strategies effectively achieve target difficulty levels.
The approaches are validated through corpus experiments and user study.
Strategies adapt well to different learner needs.
Abstract
We propose two novel manipulation strategies for increasing and decreasing the difficulty of C-tests automatically. This is a crucial step towards generating learner-adaptive exercises for self-directed language learning and preparing language assessment tests. To reach the desired difficulty level, we manipulate the size and the distribution of gaps based on absolute and relative gap difficulty predictions. We evaluate our approach in corpus-based experiments and in a user study with 60 participants. We find that both strategies are able to generate C-tests with the desired difficulty level.
Click any figure to enlarge with its caption.
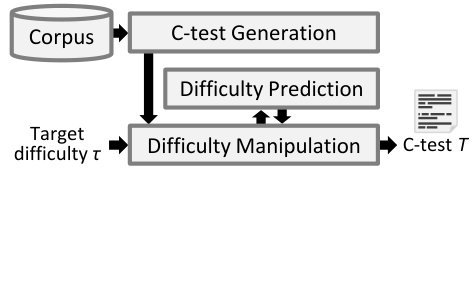 Figure 1
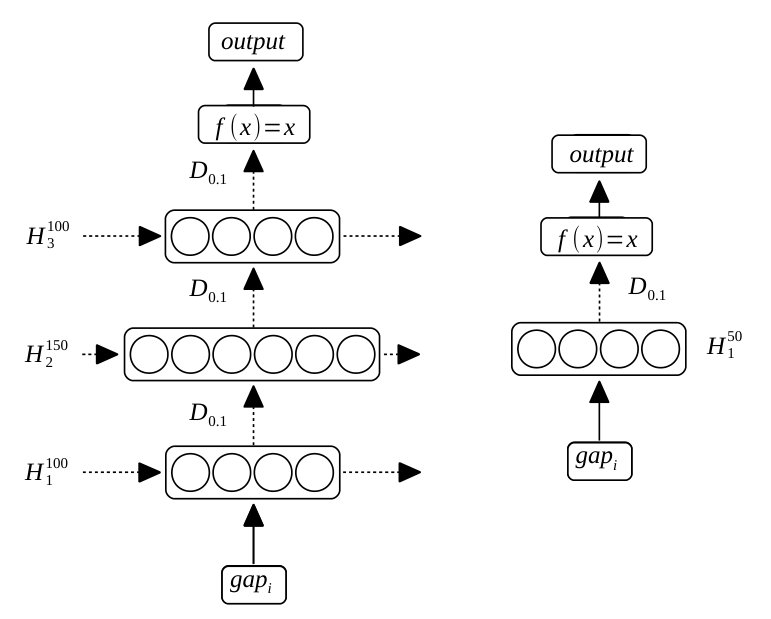 Figure 2
 Figure 3
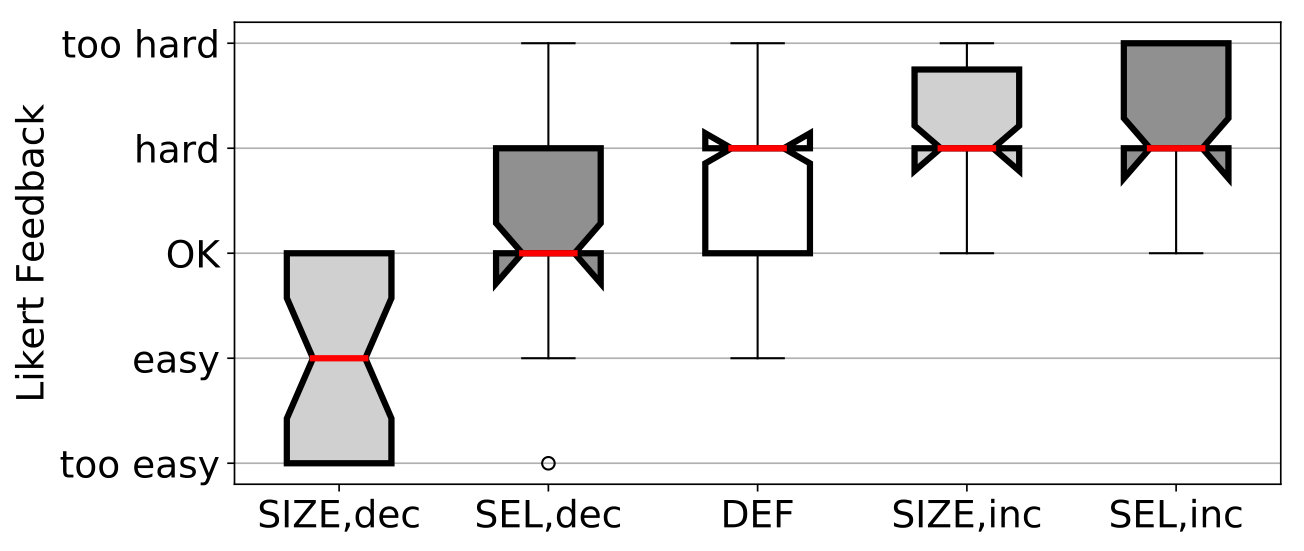 Figure 4
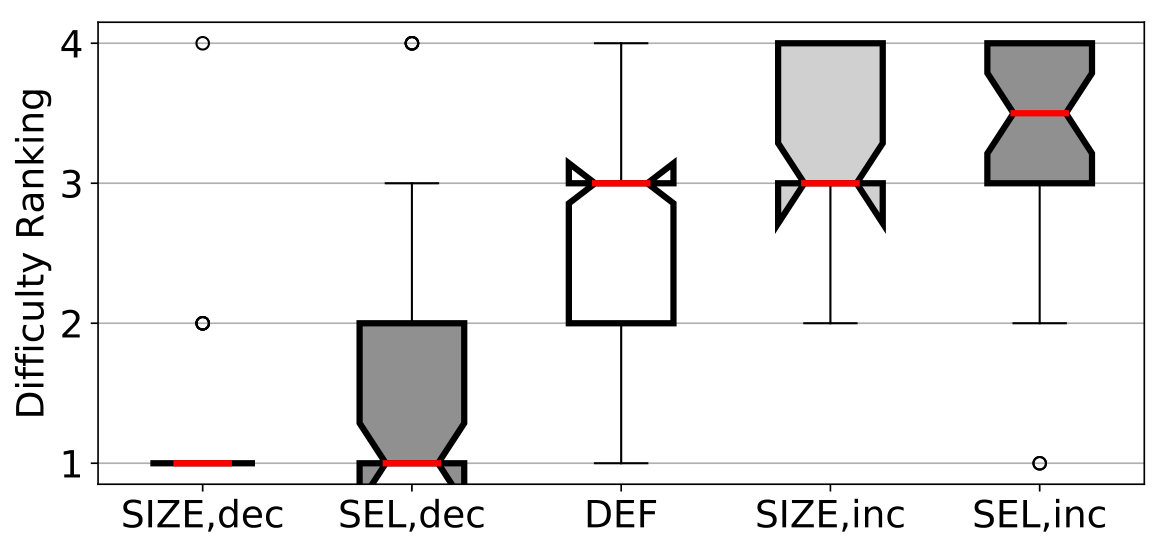 Figure 5
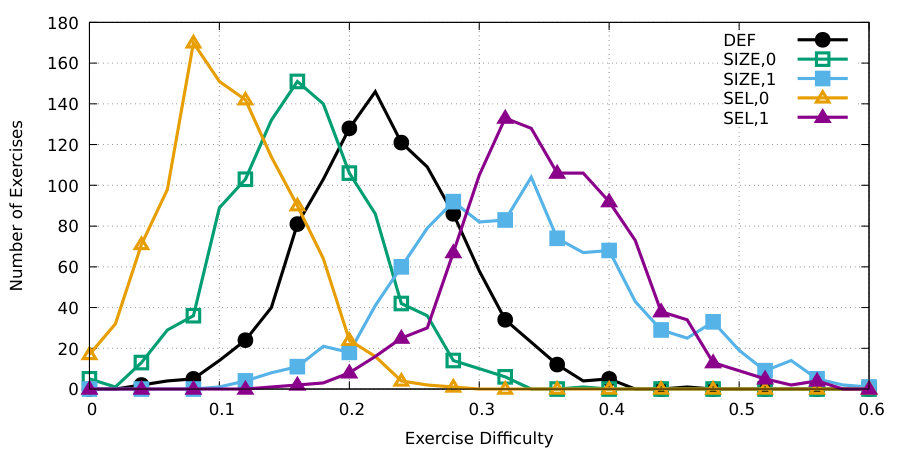 Figure 6
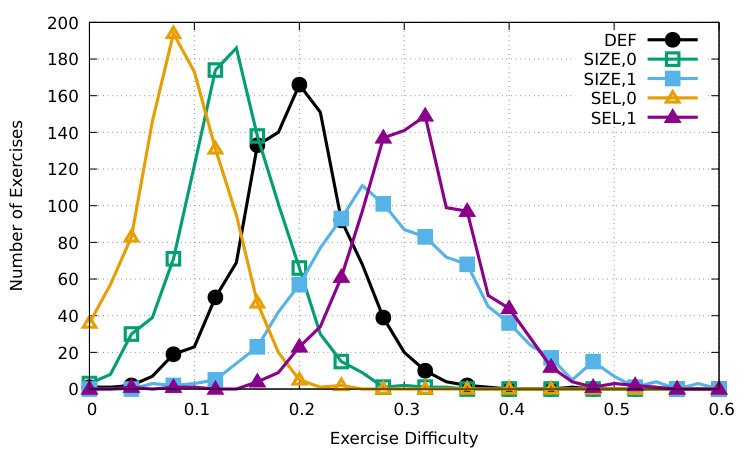 Figure 7
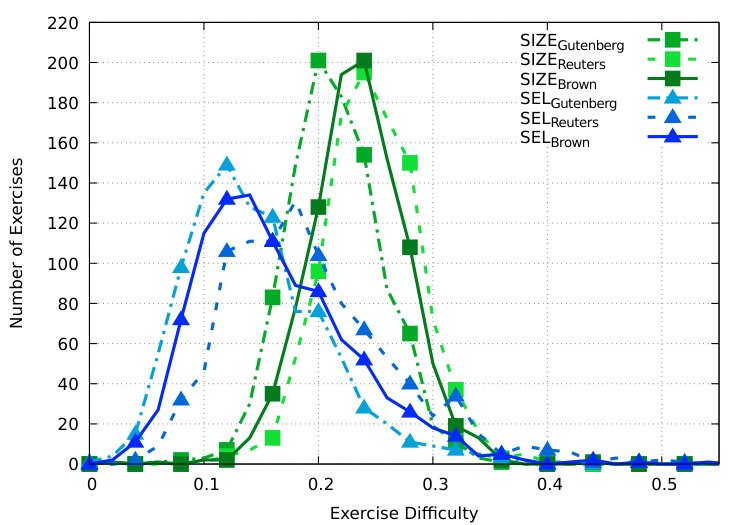 Figure 8
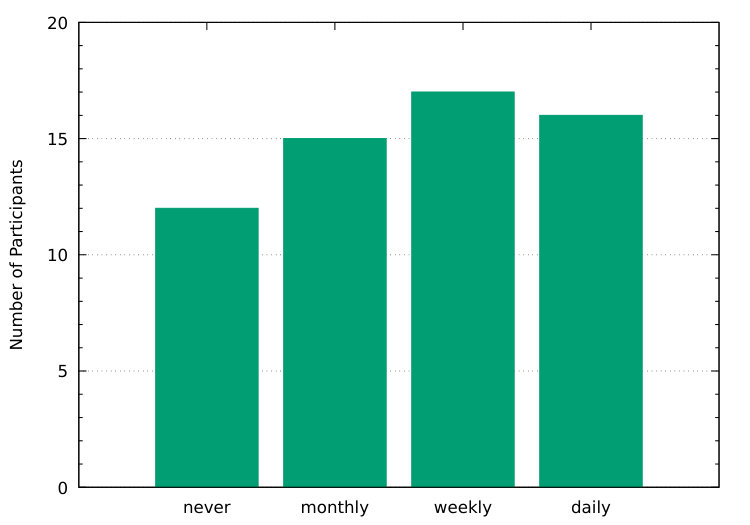 Figure 9
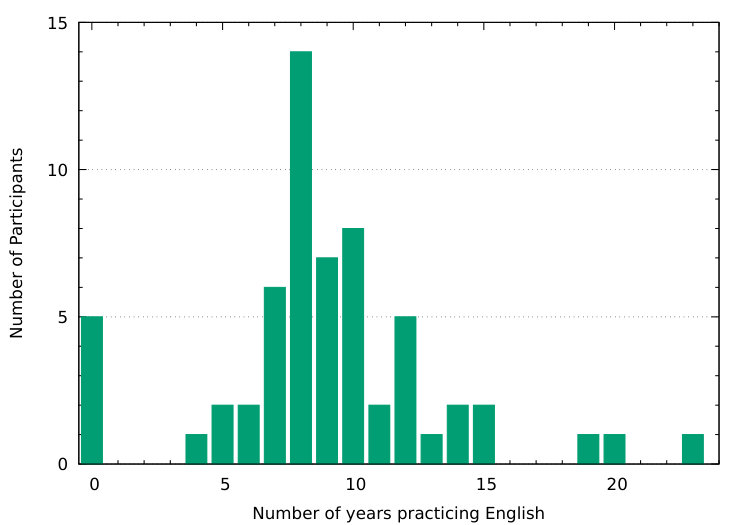 Figure 10
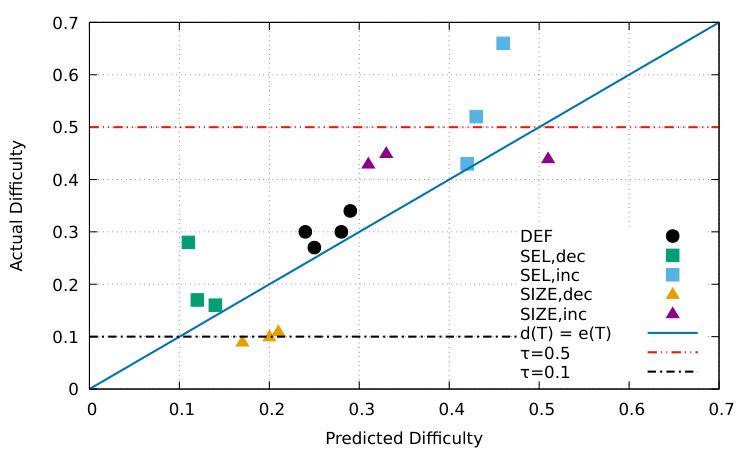 Figure 11
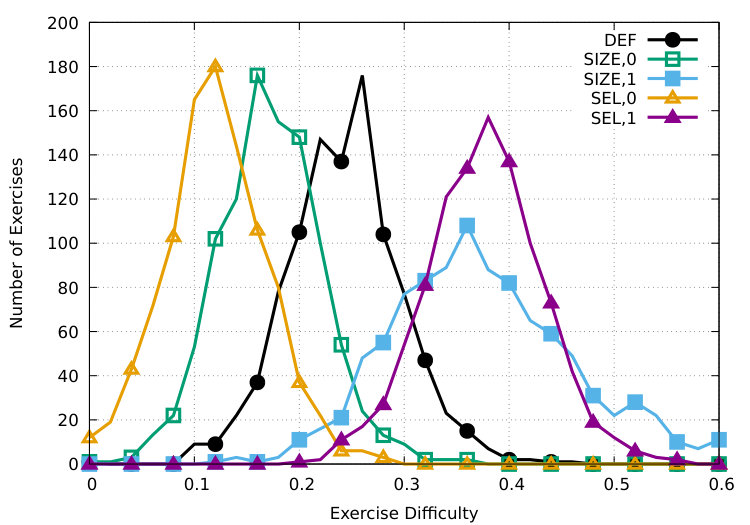 Figure 12
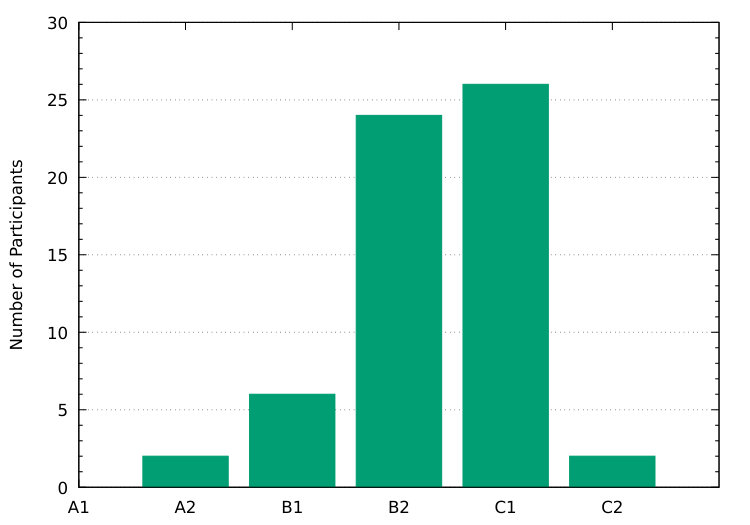 Figure 13
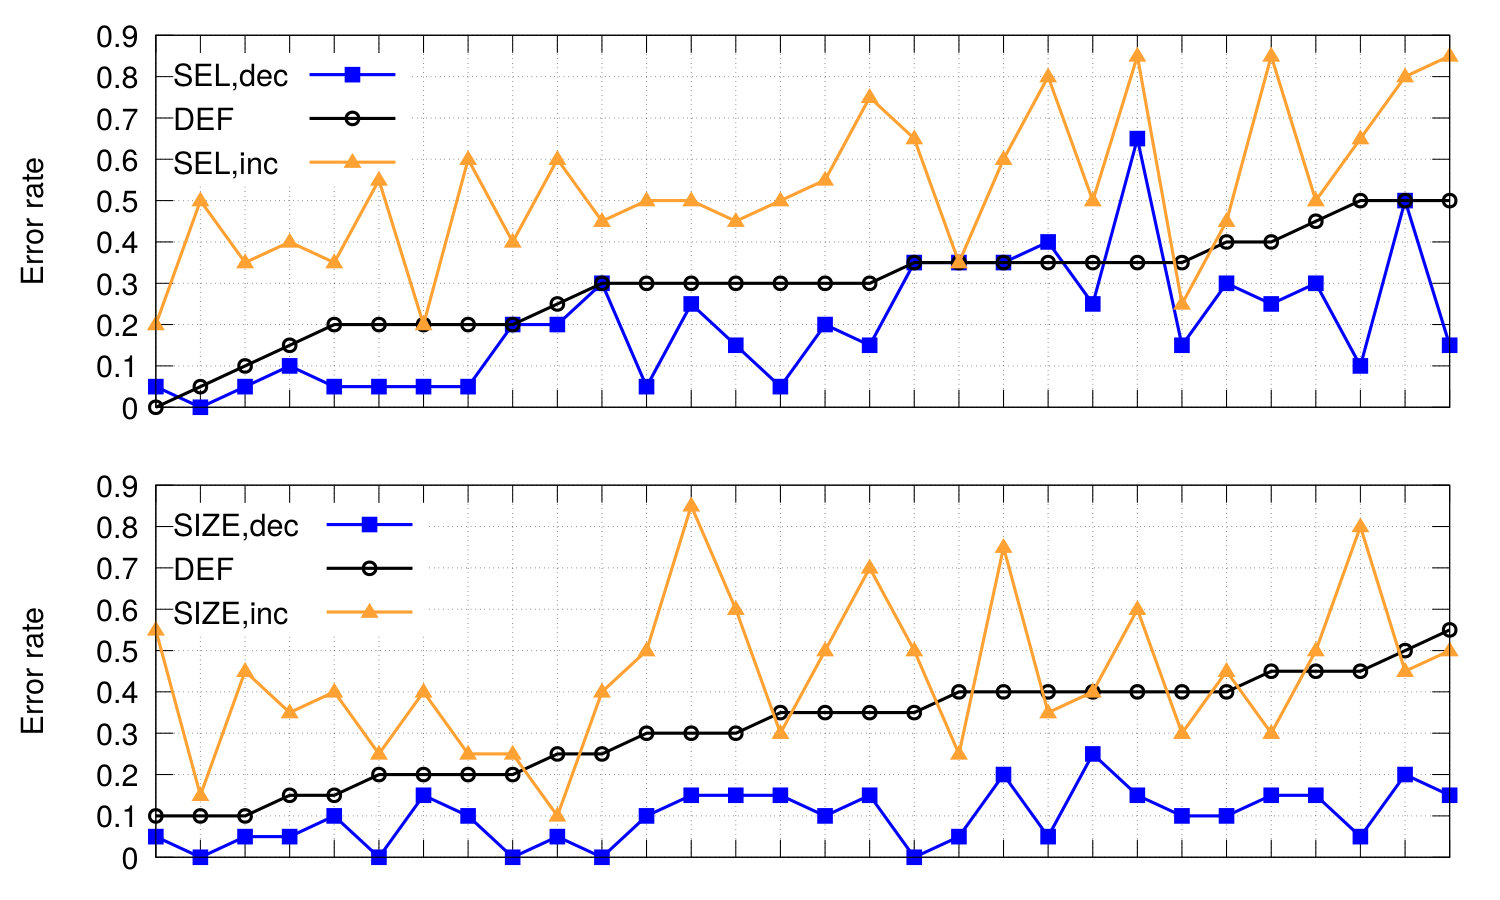 Figure 14
| Original data | New data | |||||
|---|---|---|---|---|---|---|
| Model | rmse | rmse | ||||
| SVM (original) | .50 | .23 | .44 | – | – | – |
| SVM (reproduced) | .49 | .24 | .47 | .50 | .21 | .39 |
| MLP | .42 | .25 | .31 | .41 | .22 | .25 |
| BiLSTM | .49 | .24 | .35 | .39 | .24 | .27 |
| Strategy | Brown | Reuters | Gutenberg |
|---|---|---|---|
| .11 | .12 | .10 | |
| .13 | .15 | .12 |
| easy (dec) | default | hard (inc) | |||
|---|---|---|---|---|---|
| – | – | .30 | – | – | |
| .17∗ | .11∗ | .34 | .66∗ | .44∗ | |
| .16∗ | .10∗ | .27 | .52∗ | .43∗ | |
| .28∗ | .09∗ | .30 | .43∗ | .45∗ | |
| Average | .20∗ | .10∗ | .30 | .53∗ | .44∗ |
| .10 | .50 | – | .10 | .50 | |
|---|---|---|---|---|---|
| rmse | .10 | .13 | .04 | .09 | .11 |
| rmse | .12 | .10 | – | .01 | .06 |
| Feature | rmse | rmse | ||
|---|---|---|---|---|
| PS | .088 | .521 | .213 | .271 |
| + WL | .072 | .712 | .183 | .570 |
| + GL | .066 | .771 | .162 | .687 |
| + CH | .069 | .735 | .157 | .707 |
| + RG | .069 | .736 | .157 | .707 |
| + LD | .061 | .805 | .131 | .806 |
| Readability index | ||||
| Flesch reading ease | 56.1 | 24.8 | 32 | 55.6 |
| Gunning Fog | 9.1 | 17.7 | 18.1 | 13.1 |
| Flesch-Kincaid grade level | 8.2 | 17.3 | 15.2 | 9.6 |
| Coleman-Liau index | 12 | 12 | 12 | 11 |
| SMOG index | 8.1 | 15.5 | 13.5 | 10.1 |
| Automated readability index | 7.9 | 17.4 | 15.5 | 9.7 |
| Linsear Write formula | 6.5 | 22.3 | 18.4 | 11.2 |
Peer Reviews
No public reviews on file for this paper yet. If you reviewed it on a platform where reviews are public (OpenReview, ICLR, NeurIPS, ICML), you can paste yours below so the community can read it here.
Code & Models
Videos
No videos yet. Explain this paper in a talk, walkthrough, or lecture? Add one.
Manipulating the Difficulty of C-Tests
Ji-Ung Lee
Erik Schwan
Christian M. Meyer
Ubiquitous Knowledge Processing (UKP) Lab and Research Training Group AIPHES
Computer Science Department, Technische Universität Darmstadt, Germany
https://www.ukp.tu-darmstadt.de
Abstract
We propose two novel manipulation strategies for increasing and decreasing the difficulty of C-tests automatically. This is a crucial step towards generating learner-adaptive exercises for self-directed language learning and preparing language assessment tests. To reach the desired difficulty level, we manipulate the size and the distribution of gaps based on absolute and relative gap difficulty predictions. We evaluate our approach in corpus-based experiments and in a user study with 60 participants. We find that both strategies are able to generate C-tests with the desired difficulty level.
1 Introduction
Learning languages is of utmost importance in an international society and formulated as a major political goal by institutions such as the European Council, who called for action to “teaching at least two foreign languages” (EC, 2002, p. 20). But also beyond Europe, there is a huge demand for language learning worldwide due to increasing globalization, digital communication, and migration.
Among multiple different learning activities required for effective language learning, we study one particular type of exercise in this paper: C-tests are a special type of cloze test in which the second half of every second word in a given text is replaced by a gap Klein-Braley and Raatz (1982). Figure 1 (a) shows an example. To provide context, the first and last sentences of the text do not contain any gaps. C-tests rely on the reduced redundancy principle Spolsky (1969) arguing that a language typically employs more linguistic information than theoretically necessary to communicate unambiguously. Proficient speakers intuitively understand an utterance even if the level of redundancy is reduced (e.g., when replacing a word’s suffix with a gap), whereas learners typically rely on the redundant signal to extrapolate the meaning of an utterance.
Besides general vocabulary knowledge, C-tests require orthographic, morphologic, syntactic, and semantic competencies Chapelle (1994) to correctly fill in all gaps, which make them a frequently used tool for language assessment (e.g., placement tests). Given that C-tests can be easily generated automatically by introducing gaps into an arbitrary text and that there is usually only a single correct answer per gap given its context, C-tests are also relevant for self-directed language learning and massive open online courses (MOOC), where large-scale personalized exercise generation is necessary.
A crucial question for such tasks is predicting and manipulating the difficulty of a C-test. For language assessment, it is important to generate C-tests with a certain target difficulty to allow for comparison across multiple assessments. For self-directed language learning and MOOCs, it is important to adapt the difficulty to the learner’s current skill level, as an exercise should be neither too easy nor too hard so as to maximize the learning effect and avoid boredom and frustration Vygotsky (1978). Automatic difficulty prediction of C-tests is hard, even for humans, which is why there have been many attempts to theoretically explain C-test difficulty (e.g., Sigott, 1995) and to model features used in machine learning systems for automatic difficulty prediction (e.g., Beinborn et al., 2014).
While state-of-the-art systems produce good prediction results compared to humans Beinborn (2016), there is yet no work on automatically manipulating the difficulty of C-tests. Instead, C-tests are generated according to a fixed scheme and manually post-edited by teachers, who might use the predictions as guidance. But this procedure is extremely time-consuming for language assessment and no option for large-scale self-directed learning.
In this paper, we propose and evaluate two strategies for automatically changing the gaps of a C-test in order to reach a given target difficulty. Our first strategy varies the distribution of the gaps in the underlying text and our second strategy learns to decide to increase or decrease a gap in order to make the test easier or more difficult. Our approach breaks away from the previously fixed C-test creation scheme and explores new ways of motivating learners by using texts they are interested in and generating tests from them at the appropriate level of difficulty. We evaluate our strategies both automatically and in a user study with 60 participants.
2 Related Work
In language learning research, there is vast literature on cloze tests. For example, Taylor (1953) studies the relation of cloze tests and readability. In contrast to C-tests (Klein-Braley and Raatz, 1982), cloze tests remove whole words to produce a gap leading to more ambiguous solutions.
Chapelle and Abraham (1990) contrast four types of cloze tests, including fixed-ratio cloze tests replacing every th word with a gap, rational cloze tests that allow selecting the words to replace according to the language trait that should be assessed, multiple-choice tests, and C-tests. Similar to our work, they conduct a user study and measure the difficulty posed by the four test types. They find that cloze tests replacing entire words with a gap are more difficult than C-tests or multiple-choice tests. In our work, we go beyond this by not only varying between gaps spanning the entire word (cloze test) or half of the word (C-test), but also changing the size of the C-test gaps. Laufer and Nation (1999) propose using C-tests to assess vocabulary knowledge. To this end, they manually construct C-tests with only a single gap, but use larger gaps than half of the word’s letters. Our work is different to these previous works, since we test varying positions and sizes for C-test gaps and, more importantly, we aim at manipulating the difficulty of a C-test automatically by learning to predict the difficulty of the gaps and how their manipulation affects the difficulty.
Previous work on automatically controlling and manipulating test difficulty has largely focused on multiple-choice tests by generating appropriate distractors (i.e., incorrect solutions). Wojatzki et al. (2016) avoid ambiguity of their generated distractors, Hill and Simha (2016) fit them to the context, and Perez and Cuadros (2017) consider multiple languages. Further work by Zesch and Melamud (2014), Beinborn (2016), and Lee and Luo (2016) employ word difficulty, lexical substitution, and the learner’s answer history to control distractor difficulty.
For C-tests, Kamimoto (1993) and Sigott (2006) study features of hand-crafted tests that influence the difficulty, and Beinborn et al. (2014) and Beinborn (2016) propose an automatic approach to estimate C-test difficulty, which we use as a starting point for our work.
Another related field of research in computer-assisted language learning is readability assessment and, subsequently, text simplification. There exists ample research on predicting the reading difficulty for various learner groups Hancke et al. (2012); Collins-Thompson (2014); Pilán et al. (2014). A specific line of research focuses on reducing the reading difficulty by text simplification Chandrasekar et al. (1996). By reducing complex texts or sentences to simpler ones, more texts are made accessible for less proficient learners. This is done either on a word level by substituting difficult words with easier ones (e.g., Kilgarriff et al., 2014) or on a sentence level Vajjala and Meurers (2014). More recent work also explores sequence-to-sequence neural network architectures for this task Nisioi et al. (2017). Although the reading difficulty of a text partly contributes to the overall exercise difficulty of C-tests, there are many other factors with a substantial influence Sigott (1995). In particular, we can generate many different C-tests from the same text and thus reading difficulty and text simplification alone are not sufficient to determine and manipulate the difficulty of C-tests.
3 Task Overview
We define a C-test as a tuple of left and right context and (typically one sentence) enframing words where is the number of gaps in the gap set . In each gap , the last characters of word are replaced by a blank for the learners to fill in. Klein-Braley and Raatz (1982) propose the default gap generation scheme with in order to trim the (larger) second half of every second word. Single-letter words, numerals, and punctuation are not counted as words and thus never contain gaps. Figure 1 (a) shows an example C-test generated with the scheme.
A major limitation of is that the difficulty of a C-test is solely determined by the input text. Most texts, however, yield a medium difficulty (cf. section 6) and thus do not allow any adaptation to beginners or advanced learners unless they are manually postprocessed. In this paper, we therefore propose two strategies to manipulate the gap set in order to achieve a given target difficulty ranging from small values for beginners to high values for advanced learners. To estimate the difficulty of a C-test , we aggregate the predicted difficulty scores of each gap. In section 4, we reproduce the system by Beinborn (2016) modeling as the estimated mean error rates per gap across multiple learners, and we conduct additional validation experiments on a newly acquired dataset.
The core of our work is the manipulation of the gap set in order to minimize the difference between the predicted test difficulty and the requested target difficulty . To this end, we employ our difficulty prediction system for validation and propose a new regression setup that predicts the relative change of when manipulating the size of a gap.
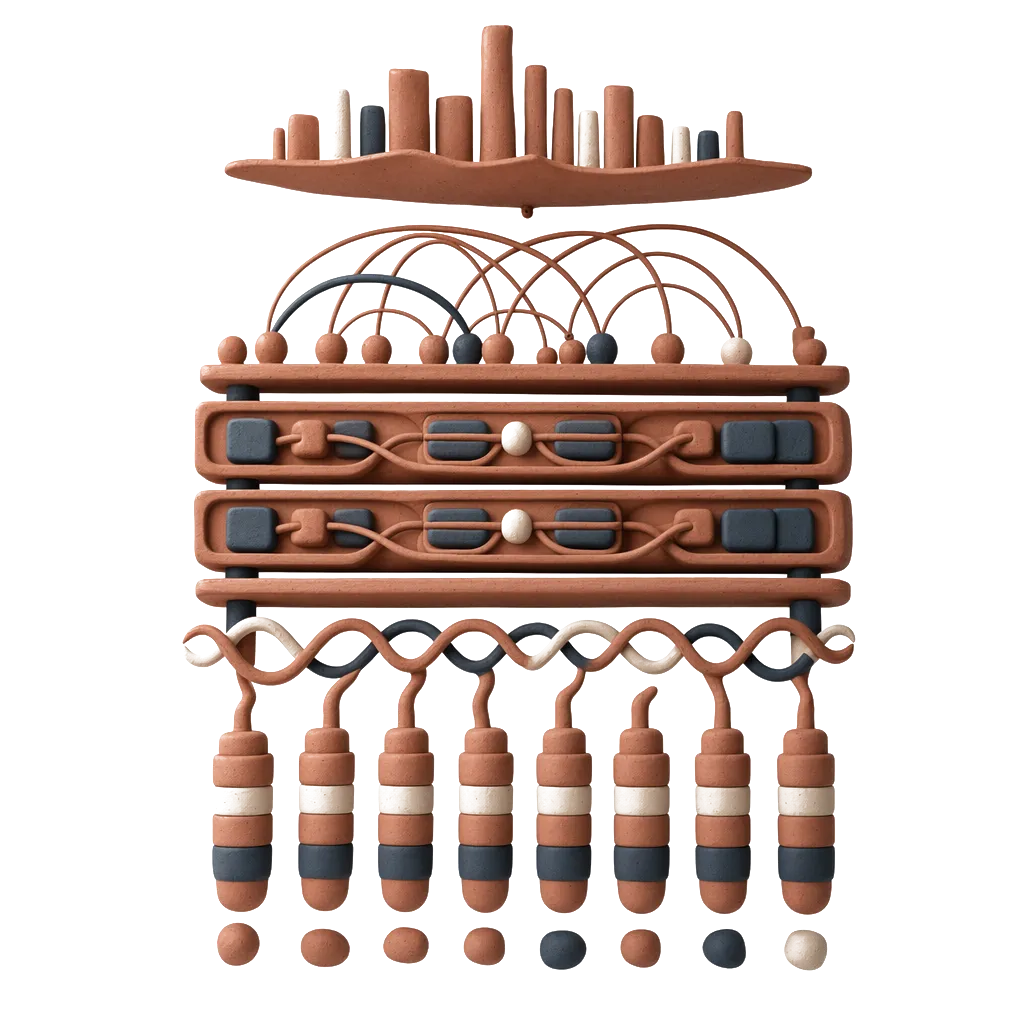
Figure 2 shows our system architecture: Based on a text corpus, we generate C-tests for arbitrary texts (e.g., according to the learner’s interests). Then, we manipulate the difficulty of the generated text by employing the difficulty prediction system in order to reach the given target difficulty for a learner (i.e., the estimated learner proficiency) to provide neither too easy nor too hard tests.
4 C-Test Difficulty Prediction
Beinborn et al. (2014) and Beinborn (2016) report state-of-the-art results for the C-test difficulty prediction task. However, there is yet no open-source implementation of their code and there is little knowledge about the performance of newer approaches. Therefore, we (1) conduct a reproduction study of Beinborn’s (2016) system, (2) evaluate newer neural network architectures, and (3) validate the results on a newly acquired dataset.
Reproduction study.
We obtain the original software and data from Beinborn (2016). This system predicts the difficulty for each gap within a C-test using a support vector machine (SVM; Vapnik, 1998) with 59 hand-crafted features. The proposed features are motivated by four factors which are deemed important for assessing the gap difficulty: item dependency, candidate ambiguity, word difficulty, and text difficulty. We use the same data (819 filled C-tests), metrics, and setup as Beinborn (2016). That is, we perform leave-one-out cross validation (LOOCV) and measure the Pearson correlation , the rooted mean squared error rmse, and the quadratic weighted kappa as reported in the original work.
The left hand side of table 1 shows the results of our reproduced SVM compared to the original SVM results reported by Beinborn (2016). Even though we reuse the same code as in their original work, we observe small differences between our reproduction and the previously reported scores.
We were able to trace these differences back to libraries and resources which have been updated and thus changed over time. One example is Ubuntu’s system dictionary, the American English dictionary words (wamerican), on which the original system relies. We experiment with different versions of the dictionary between Ubuntu 14.04 (wamerican v.7.1.1) and 18.04 (wamerican v.2018.04.16-1) and observe differences of one or two percentage points. As a best practice, we suggest to fix the versions of all resources and avoid any system dependencies.
Neural architectures.
We compare the system with deep learning methods based on multi-layer perceptrons (MLP) and bi-directional long short-term memory (BiLSTM) architectures, which are able to capture non-linear feature dependencies.111Network parameters and a description of the tuning process are provided in this paper’s appendix. To cope for the non-deterministic behavior of the neural networks, we repeat all experiments ten times with different random weight initializations and report the averaged results Reimers and Gurevych (2017). While the MLP is trained similar as our reproduced SVM, the BiLSTM receives all gaps of a C-test as sequential input. We hypothesize that this sequence regression setup is better suited to capture gaps interdependencies. As can be seen from the table, the results of the neural architectures are, however, consistently worse than the SVM results. We analyze the rmse on the train and development sets and observe a low bias, but a high variance. Thus, we conclude that although neural architectures are able to perform well for this task, they lack a sufficient amount of data to generalize.
Experiments on new data.
To validate the results and assess the robustness of the difficulty prediction system, we have acquired a new C-test dataset from our university’s language center. 803 participants of placement tests for English courses solved five C-tests (from a pool of 53 different C-tests) with 20 gaps each. Similar to the data used by Beinborn (2016), we use the error rates for each gap as the the methods should predict.
The right-hand side of table 1 shows the performance of our SVM and the two neural methods. The results indicate that the SVM setup is well-suited for the difficulty prediction task and that it successfully generalizes to new data.
Final model.
We train our final SVM model on all available data (i.e., the original and the new data) and publish our source code and the trained model on GitHub.222https://github.com/UKPLab/acl2019-ctest-difficulty-manipulation (licensed under the Apache License 2.0). Similar to Beinborn (2016), we cannot openly publish our dataset due to copyright.
5 C-Test Difficulty Manipulation
Given a C-test and a target difficulty , the goal of our manipulation strategies is to find a gap set such that approximates . A naïve way to achieve this goal would be to generate C-tests for all texts in a large corpus with the scheme and use the one with minimal . However, most corpora tend to yield texts of a limited difficulty range that only suit a specific learner profile (cf. section 6). Another drawback of the naïve strategy is that it is difficult to control for the topic of the underlying text and in the worst case, the necessity to search through a whole corpus for selecting a fitting C-test.
In contrast to the naïve strategy, our proposed manipulation strategies are designed to be used in real time and manipulate any given C-test within 15 seconds at an acceptable quality.333On an Intel-i5 with 4 CPUs and 16 GB RAM. Both strategies operate on a given text (e.g., on a topic a learner is interested in) and manipulate its gap set in order to come close to the learner’s current language skill. The first strategy varies the position of the gaps and the second strategy learns to increase or decrease the size of the gaps.
5.1 Gap Selection Strategy
The default C-test generation scheme creates a gap in every second word , . The core idea of our first manipulation strategy is to distribute the gaps differently among the all words in order to create gaps for easier or harder words than in the default generation scheme. Therefore, we use the difficulty prediction system to predict for any possible gap (i.e., assuming a gap in all words rather than in every second word). Then, we alternate between adding gaps to the resulting that are easier and harder than the preferred target difficulty , starting with those having a minimal difference .
Algorithm 1 shows this procedure in pseudocode and figure 1 shows a C-test whose difficulty has been increased with this strategy. Note that it has selected gaps at corresponding rather than with, and soothsayers rather than the. Our proposed algorithm is optimized for runtime. An exhaustive search would require testing combinations if the number of gaps is constant. For , this yields 137 billion combinations. While more advanced optimization methods might find better gap selections, we show in section 6 that our strategy achieves good results.
5.2 Gap Size Strategy
Our second manipulation strategy changes the size of the gaps based on a pre-defined gap set. Increasing a gap by one or more characters, yielding increases its difficulty (i.e., ), while smaller gaps make the gap easier. We identify a major challenge in estimating the effect of increasing or decreasing the gap size on the gap difficulty. Although could be estimated using the full difficulty prediction system, the search space is even larger than for the gap selection strategy, since each of the gaps has possible gap sizes to test. For and an average word length of six, this amounts to one trillion possible combinations.
We therefore propose a new approach to predict the relative difficulty change of a gap when increasing the gap size by one letter , and correspondingly when decreasing the gap size by one letter , . The notion of relative difficulty change enables gap size manipulation in real time, since we do not have to invoke the full difficulty prediction system for all combinations. Instead, we can incrementally predict the effect of changing a single gap.
To predict and , we train two SVMs on all gap size combinations of 120 random texts from the Brown corpus Francis (1965) using the following features: predicted absolute gap difficulty, word length, new gap size, modified character, a binary indicator if the gap is at a th sound, and logarithmic difference of alternative solutions capturing the degree of ambiguity with varying gap size.
With a final set of only six features, our new models are able to approximate the relative difficulty change very well deviating from the original system’s prediction only by rmse for and rmse for . The predictions of both models highly correlate with the predictions achieving a Pearson’s of over . Besides achieving a much faster average runtime of 0.056 seconds for the relative model vs. 11 seconds for the full prediction of a single change, we can invoke the relative model iteratively to estimate for multiple changes of the gap size more efficiently.
The final manipulation strategy then requires just a single call of the full prediction system. If , we incrementally increase the gap sizes to make more difficult and, vice-versa, decrease the gap sizes if . In each iteration, we modify the gap with the highest relative difficulty change in order to approach the given target difficulty as quickly as possible. Algorithm 2 shows pseudocode for creating with increased difficulty (i.e., ) based on the default gap scheme . The procedure for works analogously, but using and decreasing the gap size. Figure 1 (c) shows a much easier version of the example C-test, in which a learner often only has to complete the last one or two letters.
6 Evaluation of the Manipulation System
To evaluate our C-test manipulation strategies, we first test their ability to cover a higher range of target difficulties than the default generation scheme and then measure how well they meet the desired target difficulty for texts from different domains. We conduct our experiments on 1,000 randomly chosen paragraphs for each of the Gutenberg Lahiri (2014), Reuters Lewis et al. (2004), and Brown Francis (1965) corpora. We conduct our experiments on English, but our strategies can be adapted to many related languages.
Difficulty range.
The black -marked line of figure 3 shows the distribution of based on our difficulty prediction system when creating a C-test with the default generation scheme for all our samples of the Brown corpus. The vast majority of C-tests range between 0.15 and 0.30 with a predominant peak at 0.22.
To assess the maximal difficulty range our strategies can achieve, we generate C-tests with maximal () and minimal target difficulty () for both strategies , which are also shown in figure 3 as . Both strategies are able to clearly increase and decrease the test difficulty in the correct direction and they succeed in substantially increasing the total difficulty range beyond . While is able to reach lower difficulty ranges, it has bigger issues with generating very difficult tests. This is due to its limitation to the fixed gap sizes, whereas can in some cases create large gaps that are ambiguous or even unsolvable. Since is, however, limited to the 20 predefined gaps, it shows a higher variance. Especially short gaps such as is and it cannot be made more difficult. Combining the two strategies is thus a logical next step for future work, building upon our findings for both strategies. We make similar observations on the Reuters and Gutenberg corpora and provide the respective figures in the appendix.
Manipulation quality.
We finally evaluate how well each strategy reaches a given target difficulty. That is, we sample a random corpus text and , create the C-test using strategy , predict the test difficulty and measure its difference to using rmse. Table 2 shows the results for our three corpora. Throughout all three corpora, both manipulation strategies perform well. consistently outperforms , which matches our observations from the previous experiment. Mind that these results depend on the quality of the automatic difficulty predictions, which is why we conduct a user-based evaluation in the next section.
7 User-based Evaluation
Hypothesis.
To evaluate the effectiveness of our manipulation strategies in a real setting, we conduct a user study and analyze the difficulty of the manipulated and unmanipulated C-tests. We investigate the following hypothesis: When increasing a test’s difficulty using strategy , the participants will make more errors and judge the test harder than a default C-test and, vice versa, when decreasing a test’s difficulty using , the participants will make less errors and judge the test easier.
Experimental design.
We select four different English texts from the Brown corpus and shorten them to about 100 words with keeping their paragraph structure intact. None of the four texts is particularly easy to read with an average grade level above 12 and a Flesh reading ease score ranging between 25 (very difficult) to 56 (fairly difficult). In the supplementary material, we provide results of an automated readability analysis using standard metrics. From the four texts, we then generate the C-tests , using the default generation scheme . All tests contain exactly gaps and their predicted difficulties are in a mid range between 0.24 and 0.28. remains unchanged in all test conditions and is used to allow the participants to familiarize with the task. For the remaining three texts, we generate an easier variant with target difficulty and a harder variant with for both strategies .
From these tests, we create 12 sequences of four C-tests that we give to the participants. Each participant receives first to familiarize with the task. Then, they receive one easy , one default , and one hard C-test for the same strategy based on the texts in random order without duplicates (e.g., the sequence ). Having finished a C-test, we ask them to judge the difficulty of this test on a five-point Likert scale ranging from too easy to too hard. After solving the last test, we additionally collect a ranking of all four tests by their difficulty.
Data collection.
We collect the data from our participants with a self-implemented web interface for solving C-tests. We create randomized credentials linked to a unique ID for each participant and obfuscate their order, such that we can distinguish them but cannot trace back their identity and thus avoid collecting any personal information. Additionally, we ask each participant for their consent on publishing the collected data. For experiments with a similar setup and task, we obtained the approval of the university’s ethics commission. After login, the participants receive instructions and provide a self-assessment of their English proficiency and their time spent on language learning. The participants then solve the four successive C-tests without knowing the test difficulty or the manipulation strategy applied. They are instructed to spend a maximum of five minutes per C-test to avoid time-based effects and to prevent them from consulting external resources, which would bias the results.
Participants.
A total of 60 participants completed the study. We uniformly distributed the 12 test sequences (six per strategy), such that we have 30 easy, 30 default, and 30 hard C-test results for each manipulation strategy. No participant is native in English, 17 are taking language courses, and 57 have higher education or are currently university students. The frequency of their use of English varies, as we found a similar number of participants using English daily, weekly, monthly, and (almost) never in practice. An analysis of the questionnaire is provided in the paper’s appendix.
Hypothesis testing.
We evaluate our hypothesis along three dimensions: (1) the actual error rate of the participants, (2) the perceived difficulty after each individual C-test (Likert feedback), and (3) the participants’ final difficulty ranking. While the latter forces the participants to provide an explicit ranking, the former allows them to rate C-tests equally difficult. We conduct significance testing at the Bonferroni-corrected for each dimension using one-tailed -tests for the continuous error rates and one-tailed Mann–Whitney tests for the ordinal-scaled perceived difficulties and rankings. Figure 4 shows notched boxplots of our results.
To test our hypothesis, we first formulate a null hypothesis that (a) the mean error rate, (b) the median perceived difficulty (Likert feedback), and (c) the median rank of the manipulated tests equal the default tests. While the participants have an average error rate of 0.3 on default C-tests, the tests are significantly easier with an average error rate of 0.15 (, ) and the tests are significantly harder with an average error rate of 0.49 (, ), so we can safely reject the null hypothesis for error rates.
Table 3 shows the error rates per C-test and strategy. Both and are overall able to significantly () increase and decrease the test’s difficulty over , and with the exception of , the effect is also statistically significant for all individual text and strategy pairs. Figure 5 shows the 30 participants per strategy on the -axis and their error rates in their second to fourth C-test on the -axis. C-tests, for which we increased the difficulty (), yield more errors than C-tests with decreased difficulty () in all cases. The easier tests also yield less errors than the test with the default scheme in most cases. While hard tests often have a much higher error rate than , we find some exceptions, in which the participant’s error rate is close or even below the error rate.
Regarding the perceived difficulty, we find that the participants judge the manipulated C-tests with lower as easier on both the Likert scale (, ) and in the rankings (, ) based on the Mann-Whitney- test. The same is true for C-tests that have been manipulated to a higher difficulty level, which the participant judge harder (, ) and rank higher (, ). We therefore reject the null hypotheses for the Likert feedback and the rankings and conclude that both strategies can effectively manipulate a C-test’s difficulty.
Manipulation quality.
We further investigate if the strategies yield different difficulty levels. Therefore, we use two-tailed significance testing between and for all three dimensions. We find that yields significantly easier C-tests than in terms of error rates () and Likert feedback (), and observe for the rankings. For increasing the difficulty, we, however, do not find significant differences between the two strategies. Since both strategies successfully modify the difficulty individually, this motivates research on combined strategies in the future.
We furthermore investigate how well our strategies perform in creating C-tests with the given target difficulty . Table 4 shows the rmse for and as well as for and for both strategies. As expected, our difficulty prediction system works best for C-tests generated with as they use the same scheme as C-tests in the training data. Though slightly worse than for , we still find very low rmse scores for manipulated C-tests. This is especially good when considering that the system’s performance on our newly acquired dataset yields and rmse of (cf. section 6). Computing the rmse with respect to our chosen target difficulties yields equally good results for and exceptionally good results for . Figure 6 displays in comparison to for each individual text and strategy. With the exception of and , all predictions are close to the optimum (i.e., the diagonal) and also close to the desired target difficulty .
In a more detailed analysis, we find two main sources of problems demanding further investigation: First, the difficulty prediction quality when deviating from and second, the increasing ambiguity in harder C-tests. However, it underestimates the for (the same text used in figure 1), for which we found an actual error rate of . This is due to chains of four successive gaps, such as:
[TABLE]
As the prediction system has been trained only on -generated C-tests, it underestimates for cases with limited context. It will be interesting for future work to focus on modeling gap interdependencies in C-tests deviating from .
Another issue we observe is that the gap size strategy might increase the ambiguity of the C-test. In the standard scheme, there is in most cases only a single correct answer per gap. In , however, the strategy increased the gap of the word professional to its maximal length yielding p____________. One participant answered popularising for this gap, which also fits the given context. We carefully checked our datasetfor other ambiguity, but only found one additional case: In , instead of the word close, 13 participants out of 30 used clear as a modifier of correspondence, which both produce meaningful contexts. Given that this case is already ambiguous in the scheme yielding the gap cl___, we conclude that the issue is not severe, but that the difficulty prediction system should be improved to better capture ambiguous cases; for example, by introducing collocational features weighted by their distribution within a corpus into and .
8 Conclusion
In this work, we proposed two novel strategies for automatically manipulating the difficulty of C-test exercises. Our first strategy selects which words should be turned into a gap, and the second strategy learns to increase or decrease the size of the gaps. Both strategies automatically predict the difficulty of a test to make informed decisions. To this end, we reproduced previous results, compared them to neural architectures, and tested them on a newly acquired dataset. We evaluate our difficulty manipulation pipeline in a corpus-based study and with real users. We show that both strategies can effectively manipulate the C-test difficulty, as both the participants’ error rates and their perceived difficulty yield statistically significant effects. Both strategies reach close to the desired difficulty level.
Our error analysis points out important directions for future work on detecting ambiguous gaps and modeling gap interdependencies for C-tests deviating from the default generation scheme. An important observation is that manipulating the gaps’ size and position does not only influence the C-test difficulty, but also addresses different competencies (e.g., requires more vocabulary knowledge or more grammatical knowledge). Future manipulation strategies that take the competencies into account have the potential to train particular skills and to better control the competencies required for a placement test. Another strand of research will be combining both strategies and deploying the manipulation strategies in a large scale testing platform that allows the system to adapt to an individual learner over time. A core advantage of our manipulation strategies is that we can work with any given text and thus provide C-tests that do not only have the desired difficulty, but also integrate the learner’s interest or the current topic of a language course.
Acknowledgments
This work has been supported by the Hessian research excellence program “Landes-Offensive zur Entwicklung Wissenschaftlich-ökonomischer Exzellenz” (LOEWE) as part of the a! – automated language instruction project under grant No. 521/17-03 and by the German Research Foundation as part of the Research Training Group “Adaptive Preparation of Information from Heterogeneous Sources” (AIPHES) under grant No. GRK 1994/1. We thank the anonymous reviewers for their detailed and helpful comments. We furthermore thank the language center of the Technische Universität Darmstadt for their cooperation and Dr. Lisa Beinborn for providing us with the code for our reproduction study.
Appendix A C-Test Difficulty Manipulation
Feature description for and .
We provide an extended feature description for the subset of features used for our relative difficulty prediction models and . Features marked with * are also used by the absolute difficulty prediction model proposed by Beinborn (2016). For a gap in word , we define:
- •
the predicted absolute gap difficulty for the initial C-test created with obtained from our reproduced difficulty prediction system, see line 3 of algorithm 2 (PS),
- •
the word length (WL*),
- •
the new gap size after modification (GL*),
- •
the modified character when increasing or decreasing the gap (CH),
- •
a binary indicator if the gap is after a th sound (RG*), and
- •
the logarithmic difference of alternative solutions (LD*) capturing the change in the degree of ambiguity when increasing or decreasing .
Feature ablation test.
We conduct feature ablation tests to evaluate the impact of each feature on our relative difficulty prediction models and . Both models were evaluated on all gap size combinations for 120 random texts from the Brown corpus Francis (1965) with a three-fold cross-validation. Table 5 shows the performance increase for each model after including each feature. rmse shows the deviation and the correlation of our relative difficulty prediction compared to the absolute difficulty prediction. Although the increase in performance with RG is not substantial, we decided to include it as a meaningful feature which measures the impact for increasing or decreasing the gap size in words starting with th.
Appendix B Neural Network Parameters
Although obtaining state-of-the-art results in many tasks, the deep neural networks we evaluated during our preliminary experiments did perform worse than the SVM. We performed parameter tuning with 100 randomly initialized configurations for both, MLP and BiLSTM. We tune the following parameters:
- •
Number of hidden layers
- •
Number of hidden units
- •
Dropout rate
We use Adam with Nesterov Momentum Dozat (2016) as our optimizer and keep the batch size at for both models. All models are trained for epochs with an early stopping after epochs with no improvement of the loss. Figure 7 shows the resulting architectures of both models after tuning. Since our goal is to output regression values, we use a linear activation function in the output layer.
In preliminary experiments, we also tuned and evaluated BiLSTMs including soft attention, however, they performed even worse than the models without any attention. Analyzing the results of the best performing attention based model showed that it had a strong bias towards predicting the mean value of the whole training set. Furthermore, similar to the other neural models, it showed a low error on the training set (low bias) and a rather high error on the development set (high variance), indicating a lack of training data.
Appendix C Evaluation of the Manipulation System
Results for additional corpora.
Figure 10 and figure 10 show our results on the Gutenberg Lahiri (2014) and the Reuters Lewis et al. (2004) corpora. As already discussed in the main paper, we observe very similar distributions for , , and across both corpora matching our descriptions for the Brown Francis (1965) corpus.
We further compute for and for each text within a corpus and thus, measure the difficulty range both strategies are able to cover for a single text. As figure 10 shows, achieves a larger difficulty range, whereas considerably more C-tests achieve higher difficulty levels when generated with . We again observe very similar distributions throughout the three corpora.
Appendix D User-based Evaluation
Questionnaire.
At the begin of our study, our participants answered a questionnaire for a self-assessment of their English proficiency described in figure 11. We partitioned our questionnaire into three sections asking about 1) our participants’ English proficiency (Q1, Q2), 2) their learning habits and goals (Q4), and 3) other languages they have been learning (Q3, Q5, Q6).
Answers.
As described in the main paper, 17 participants are taking in language courses (Q3). Overall, 41 participants have tried to learn a second language (Q6). The exact answers can be found in the data we provide. Note, that not all participants provided the language which they attempted to learn since this was not mandatory. Figure 14–14 shows our participants’ answers to Q1, Q2, and Q4. As can be seen, none of our participants consider themselves at the Beginner (A1) level. Furthermore, most of them are rather confident in their English proficiency and provide an estimate of either Upper Intermediate (B2) or Advanced (C1).
C-tests.
Figure 15 shows the four texts to taken from the Brown corpus and the C-tests with the default gap scheme we created from them for our user study. We have shortened each text to approximately 100 words and generated gaps. In figure 16, we provide the results of our manipulation strategies and with decreased () and increased () difficulty. Note that, we only show sentences that contain gaps; the beginning and end of each text is the same as in figure 15.
Table 6 reports readability scores for multiple common automated readability formulas. A Flesch reading ease score between 50–59 indicates fairly difficult, 30–49 difficult, and 0–29 very difficult. A Gunning Fog score of 9.1 indicates fairly easy to read and scores above 12 indicates hard to read. The remaining readability scores corresponding to grade levels.
The reference list from the paper itself. Each links out to its DOI / PubMed record.
- 1Beinborn et al. (2014) Lisa Beinborn, Torsten Zesch, and Iryna Gurevych. 2014. Predicting the Difficulty of Language Proficiency Tests . Transactions of the Association for Computational Linguistics , 2:517–529.
- 2Beinborn (2016) Lisa Marina Beinborn. 2016. Predicting and manipulating the difficulty of text-completion exercises for language learning . Ph.D. thesis, Technische Universität Darmstadt.
- 3Chandrasekar et al. (1996) Raman Chandrasekar, Christine Doran, and Bangalore Srinivas. 1996. Motivations and methods for text simplification . In Proceedings of the 16th International Conference on Computational Linguistics (COLING): Volume 2 , pages 1041–1044, Copenhagen, Denmark.
- 4Chapelle (1994) C. A. Chapelle. 1994. Are C-tests valid measures for L 2 vocabulary research? Second Language Research , 10(2):157–187. · doi ↗
- 5Chapelle and Abraham (1990) Carol A. Chapelle and Roberta G. Abraham. 1990. Cloze method: what difference does it make? Language Testing , 7(2):121–146. · doi ↗
- 6Collins-Thompson (2014) Kevyn Collins-Thompson. 2014. Computational assessment of text readability: A survey of current and future research . International Journal of Applied Linguistics – Special Issue on Recent Advances in Automatic Readability Assessment and Text Simplification , 165(2):97–135. · doi ↗
- 7Dozat (2016) Timothy Dozat. 2016. Incorporating nesterov momentum into adam . In ICLR Workshop .
- 8EC (2002) EC. 2002. Presidency Conclusions. Barcelona European Council 15 and 16 March 2002 . Report SN 100/1/02 REV 1, Council of the European Union.