A nuclear molecular outflow in the Seyfert galaxy NGC3227
A. Alonso-Herrero, S. Garcia-Burillo, M. Pereira-Santaella, R. I., Davies, F. Combes, M. Vestergaard, S. I. Raimundo, A. Bunker, T. Diaz-Santos,, P. Gandhi, I. Garcia-Bernete, E. K. S. Hicks, S. F. H\"onig, L. K. Hunt, M., Imanishi, T. Izumi, N. A. Levenson, W. Maciejewski

TL;DR
This study uses high-resolution ALMA observations to analyze the molecular gas dynamics in NGC3227, revealing a nuclear outflow likely driven by the AGN wind and complex gas structures extending over tens of parsecs.
Contribution
First detailed ALMA analysis of molecular outflows and nuclear gas structures in NGC3227, challenging the classical torus model and highlighting AGN-driven feedback.
Findings
Detection of a nuclear molecular outflow with velocities up to 200 km/s.
Molecular outflow rates of 5 and 0.6 solar masses per year on opposite sides.
Nuclear gas structures extend over tens of parsecs, connected to circumnuclear rings.
Abstract
We present ALMA observations of the CO(2-1) and CO(3-2) molecular gas transitions and associated (sub)-mm continua of the nearby Seyfert 1.5 galaxy NGC3227 with angular resolutions 0.085-0.21" (7-15pc). On large scales the cold molecular gas shows circular motions as well as streaming motions on scales of a few hundred parsecs associated with a large scale bar. We fitted the nuclear ALMA 1.3mm emission with an unresolved component and an extended component. The 850m emission shows at least two extended components, one along the major axis of the nuclear disk and the other along the axis of the ionization cone. The molecular gas in the central region (1" ~73pc) shows several CO clumps with complex kinematics which appears to be dominated by non-circular motions. While we cannot demonstrate conclusively the presence of a warped nuclear disk, we also detected non-circular motions…
Click any figure to enlarge with its caption.
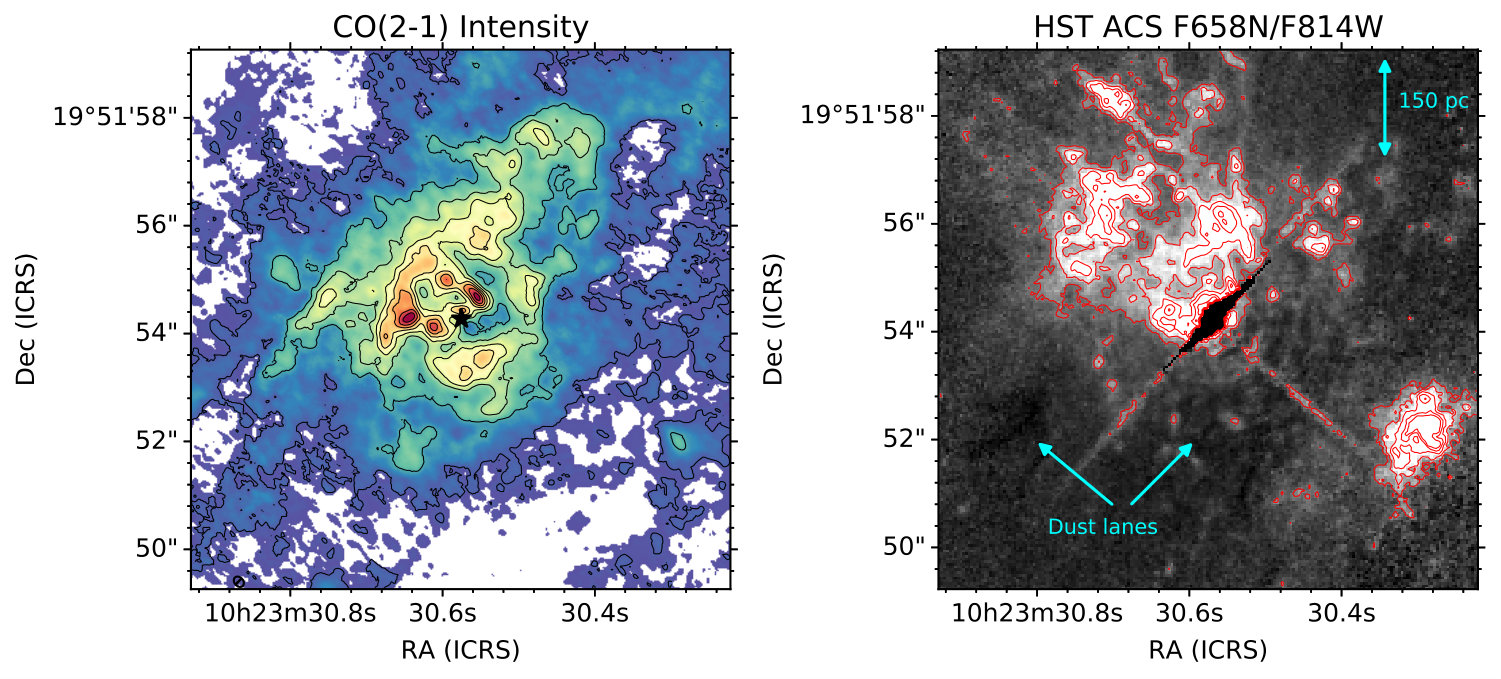 Figure 1
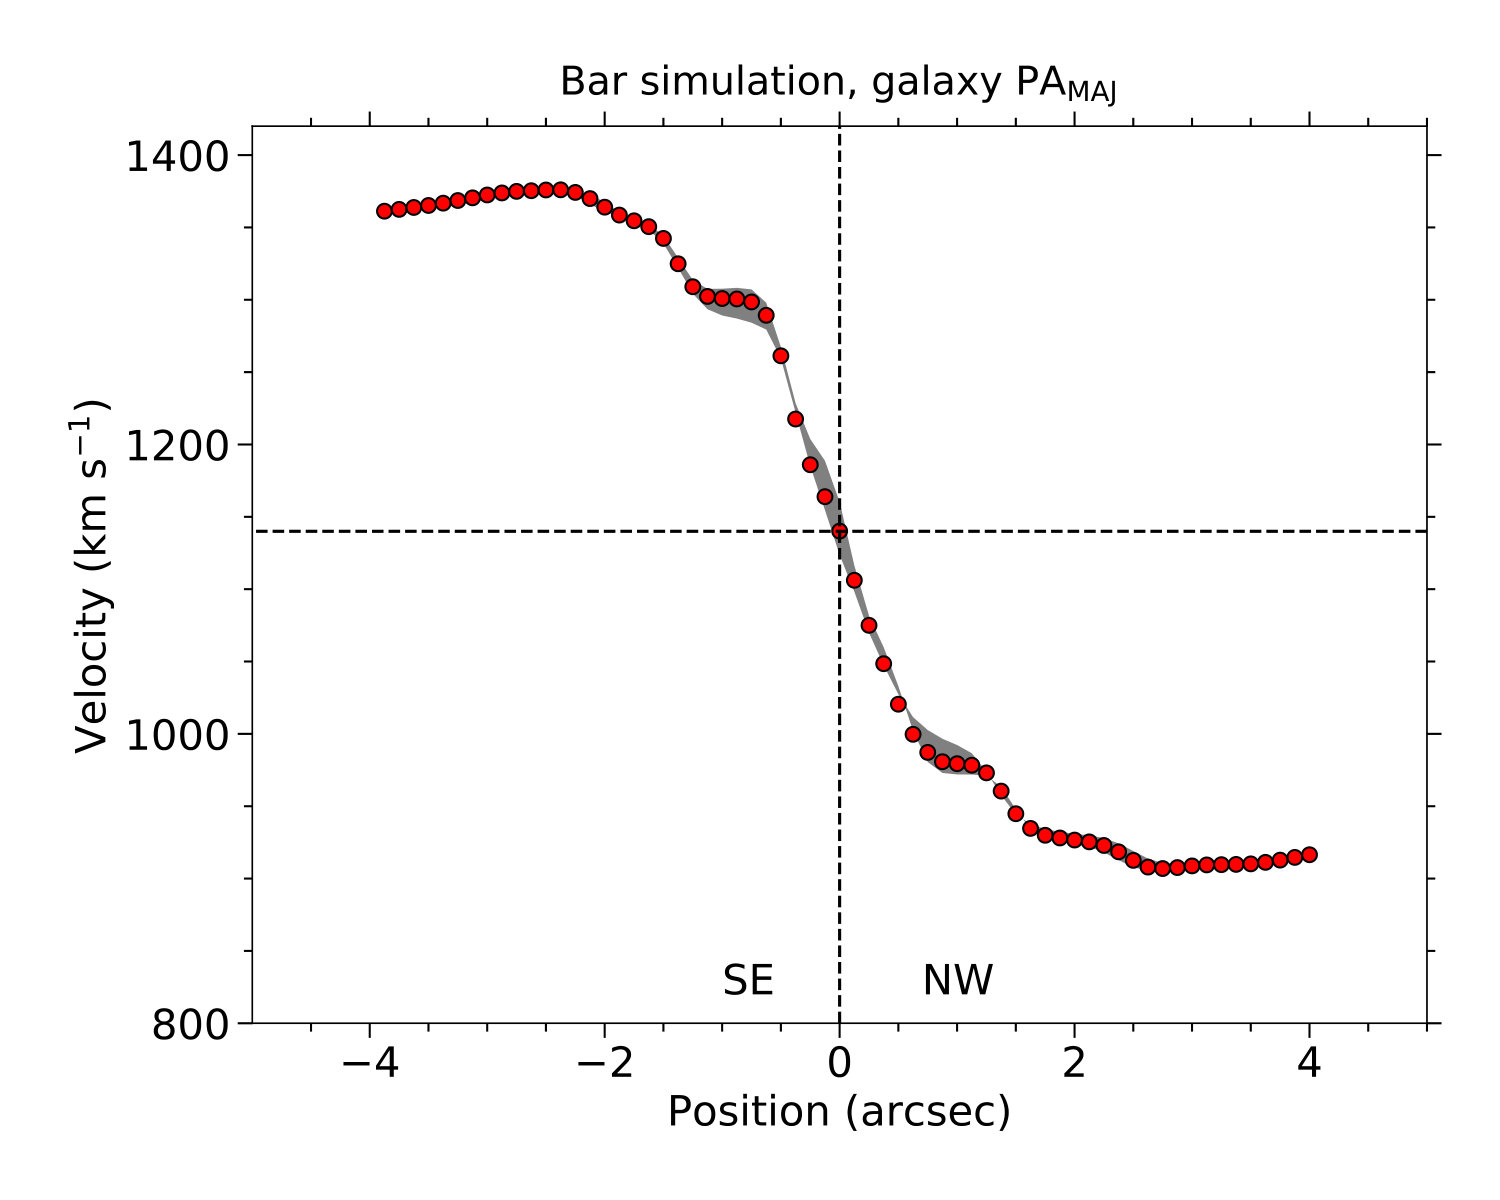 Figure 10
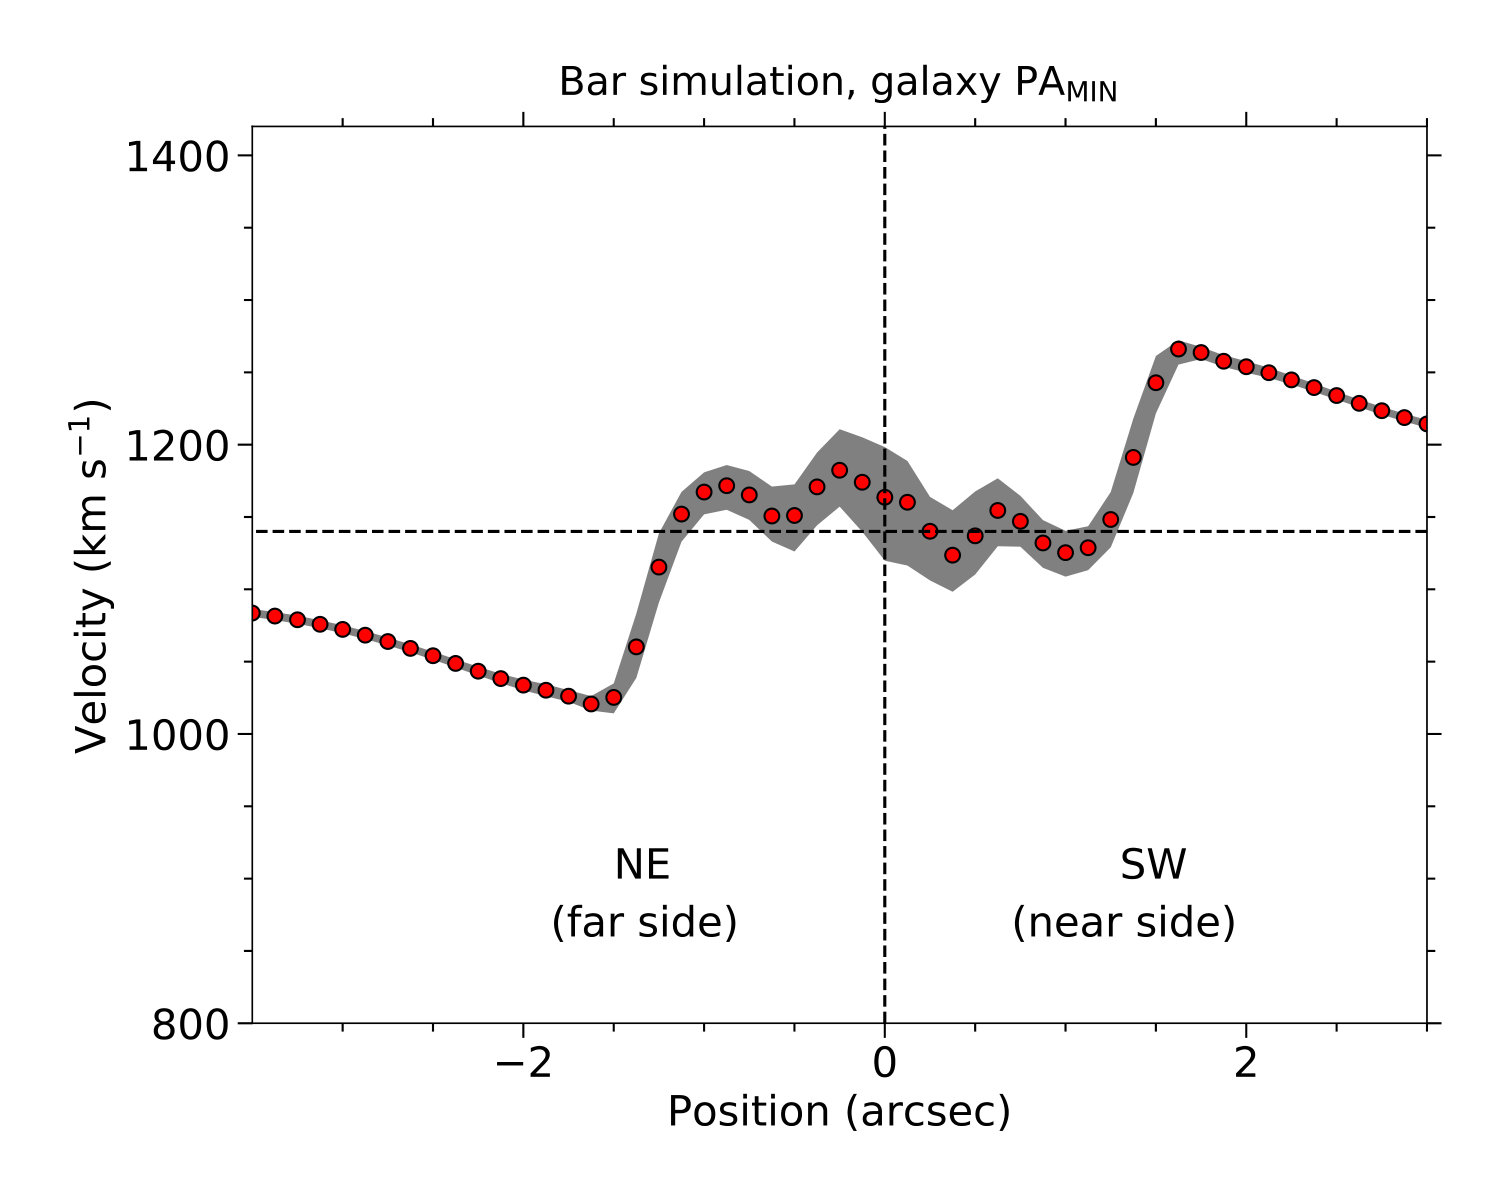 Figure 10
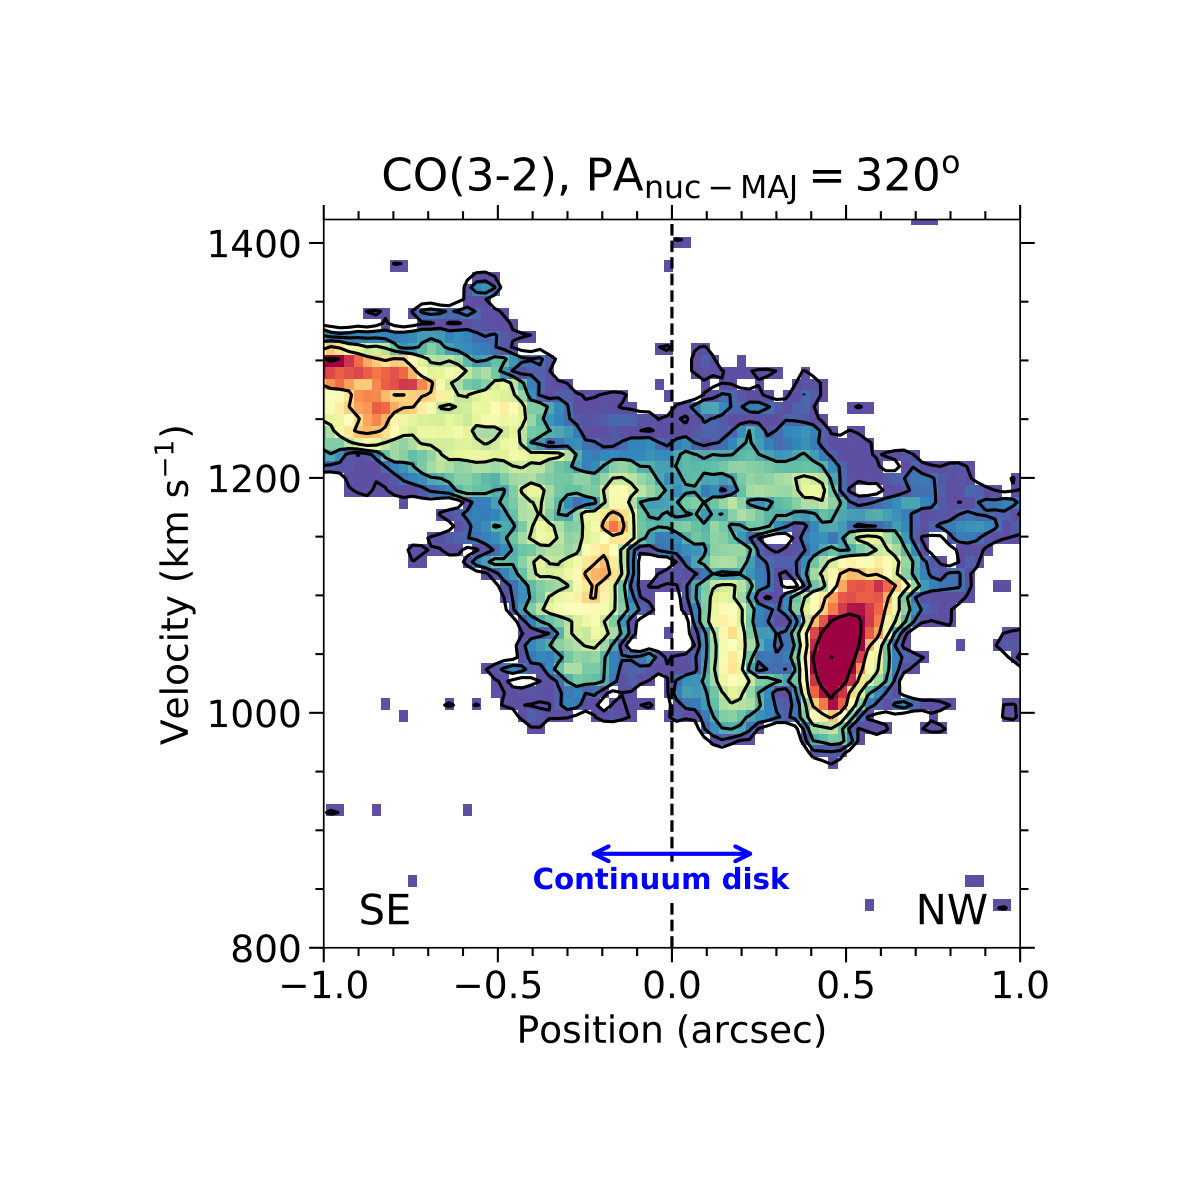 Figure 11
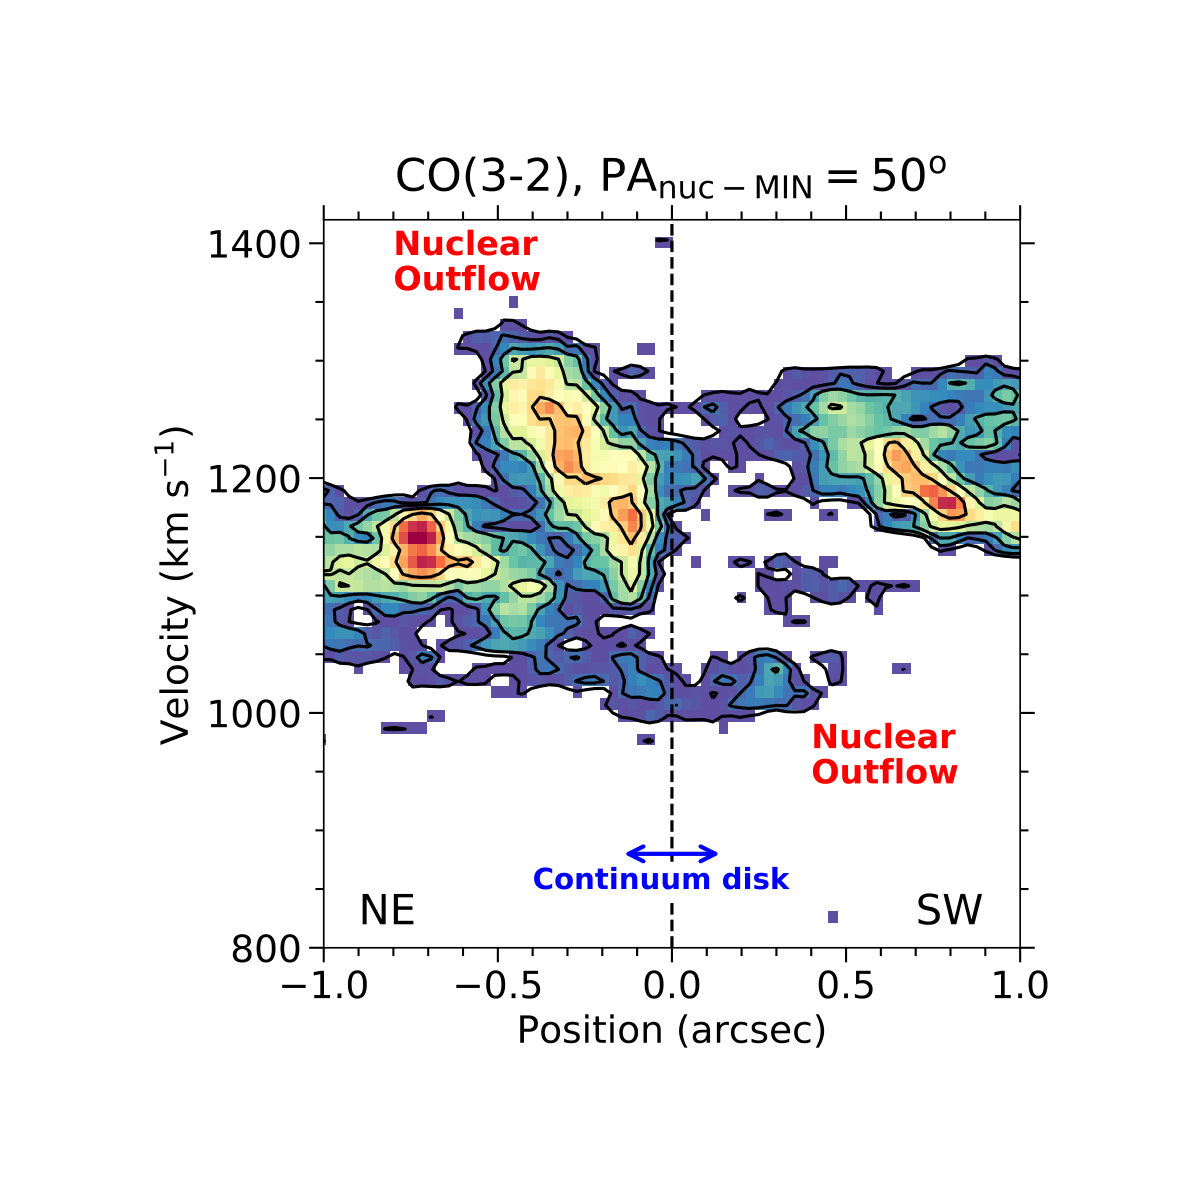 Figure 11
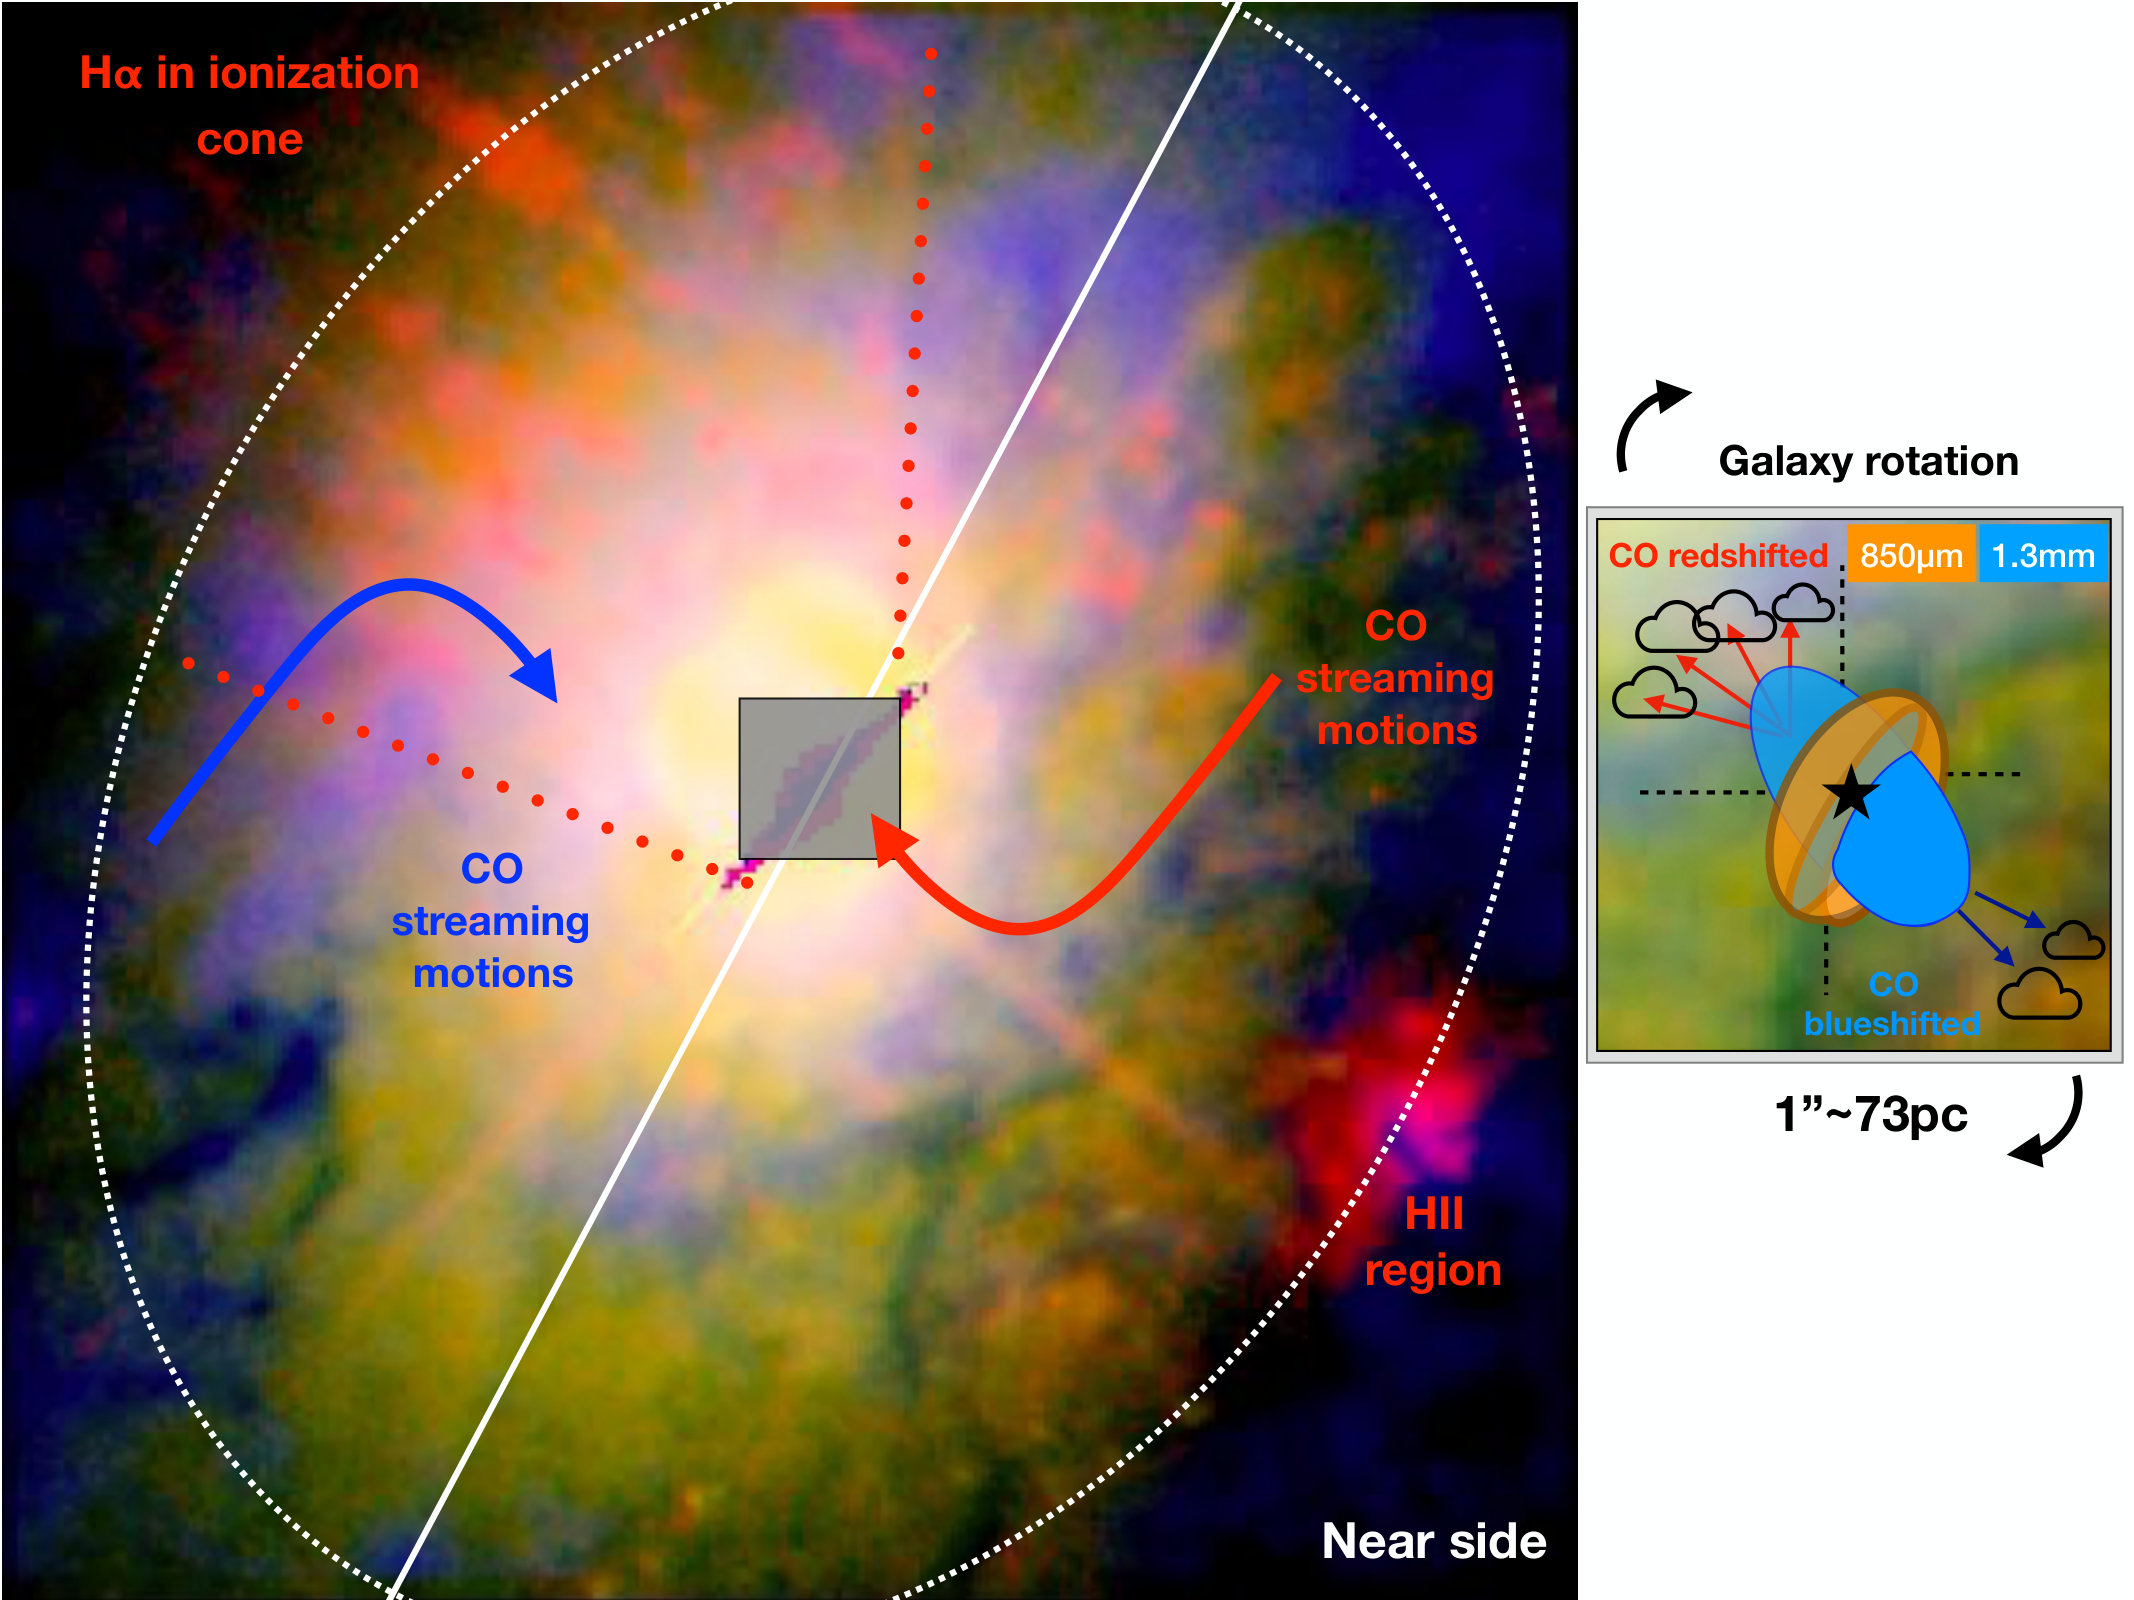 Figure 12
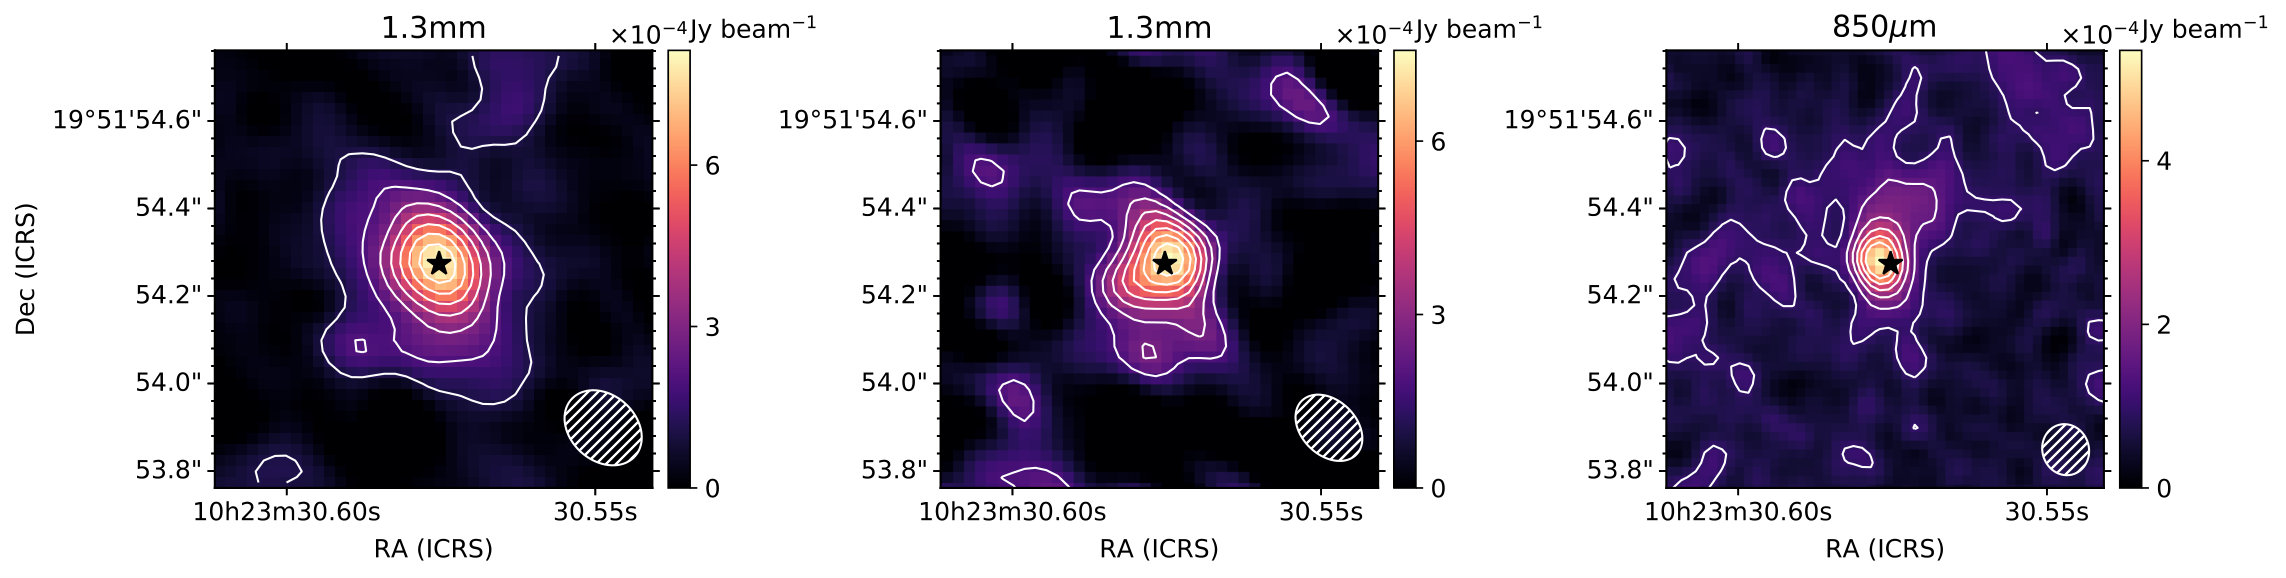 Figure 2
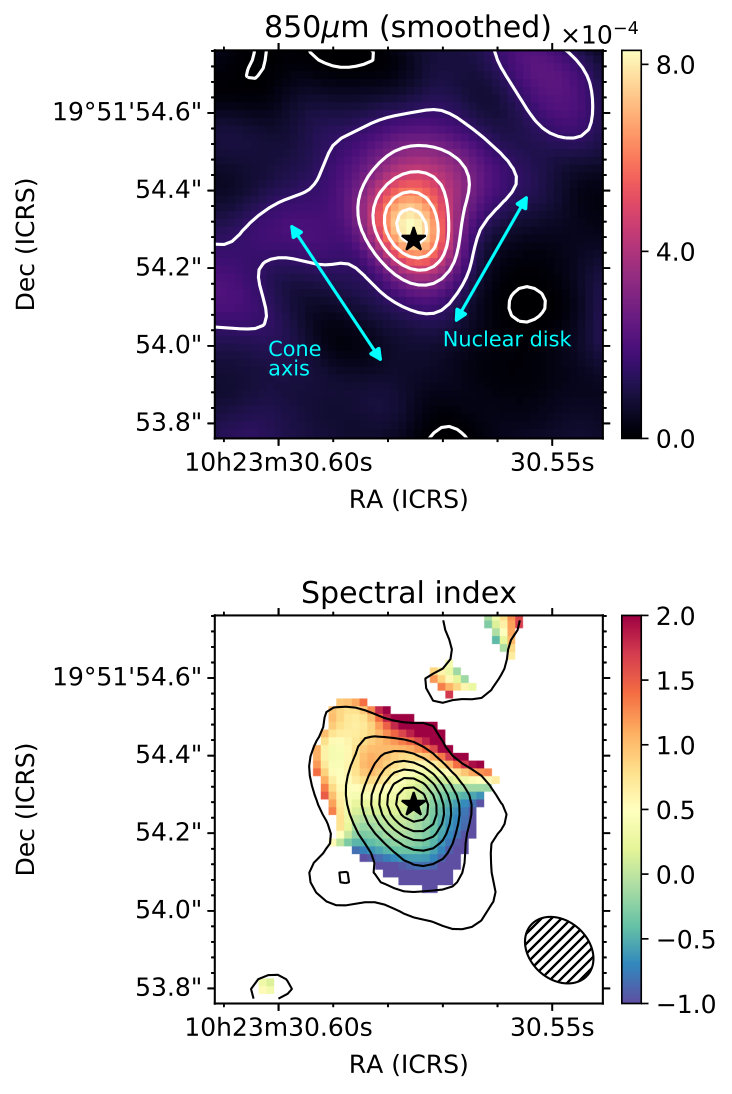 Figure 3
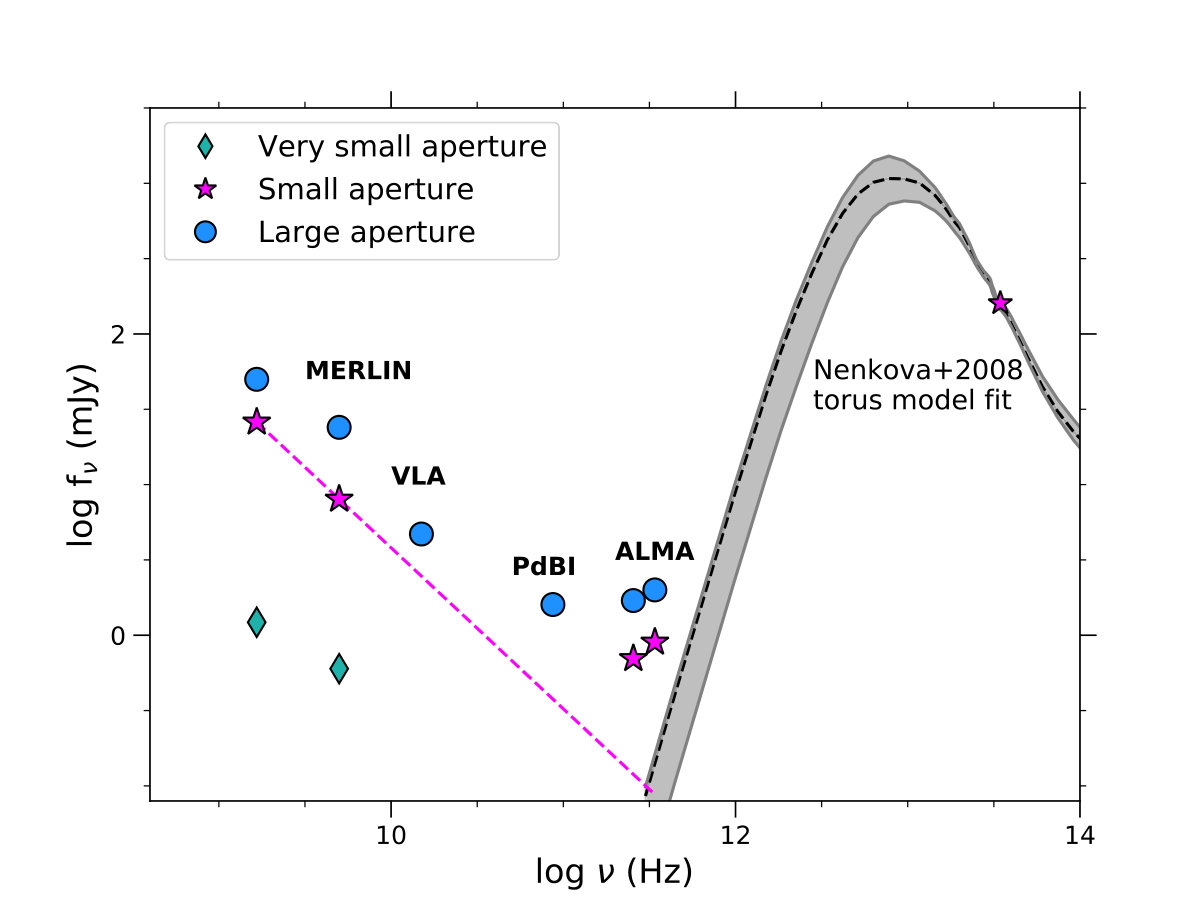 Figure 4
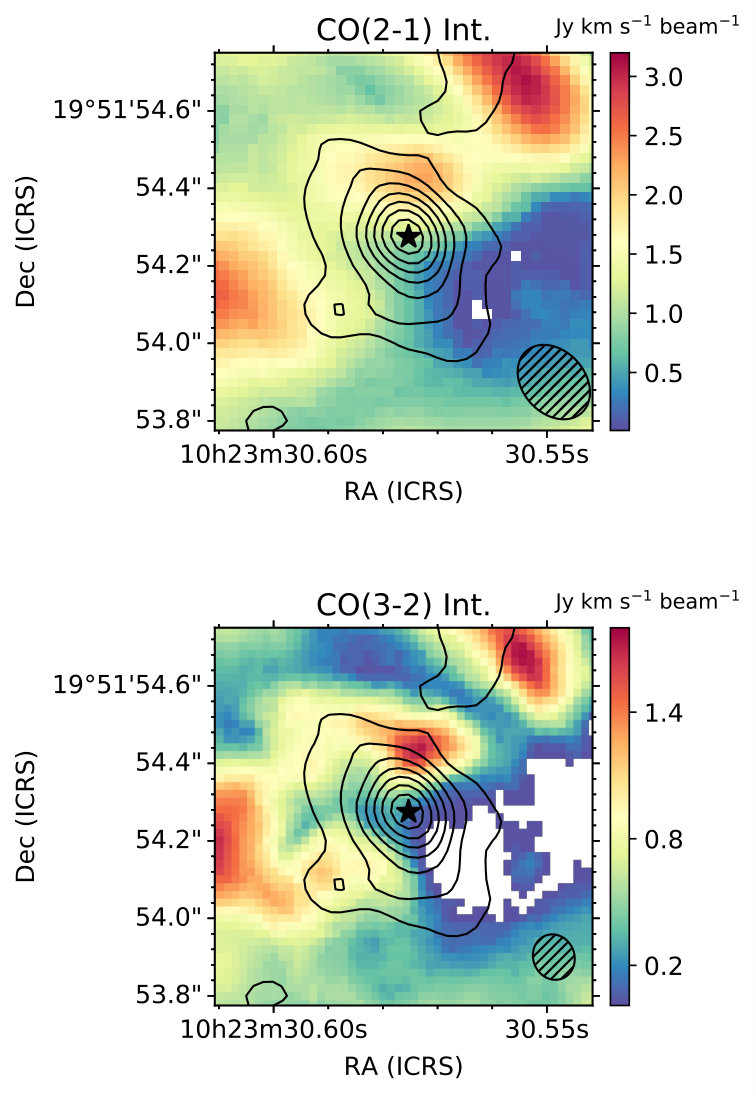 Figure 5
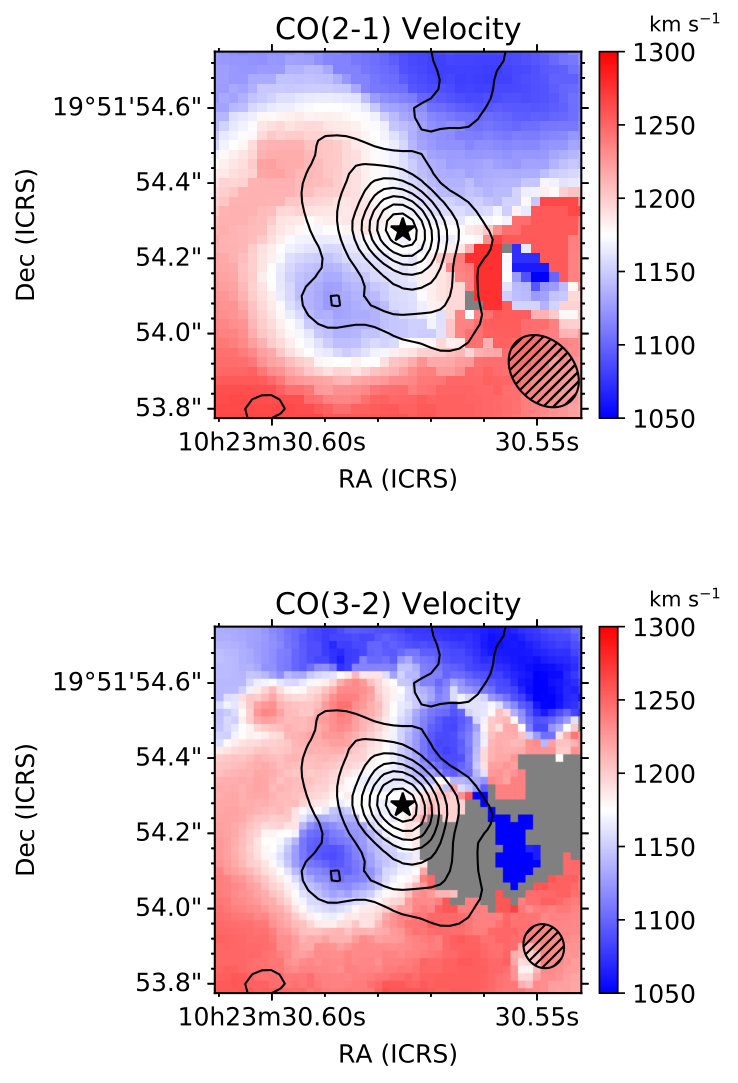 Figure 5
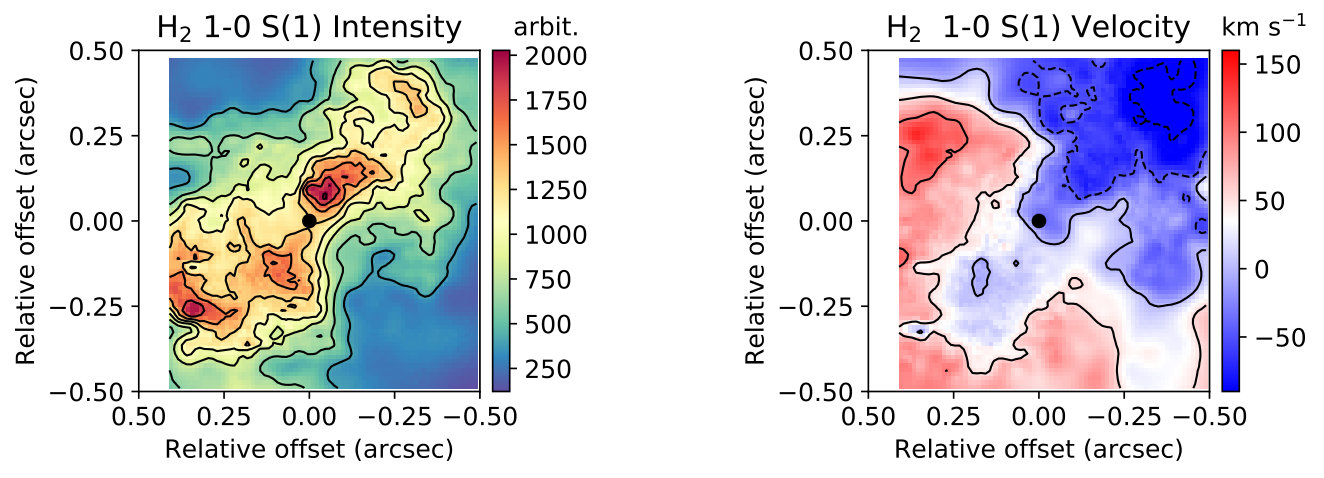 Figure 6
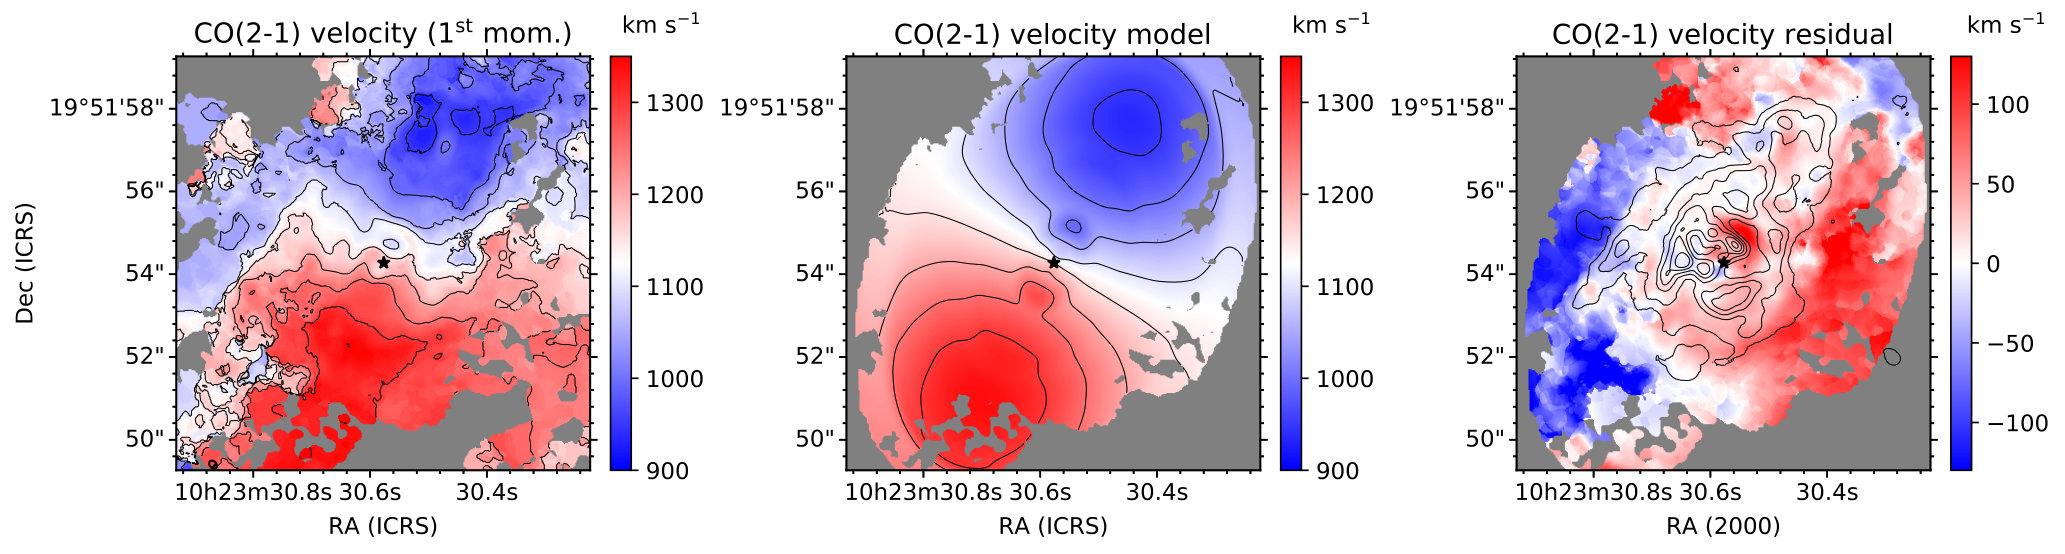 Figure 7
 Figure 8
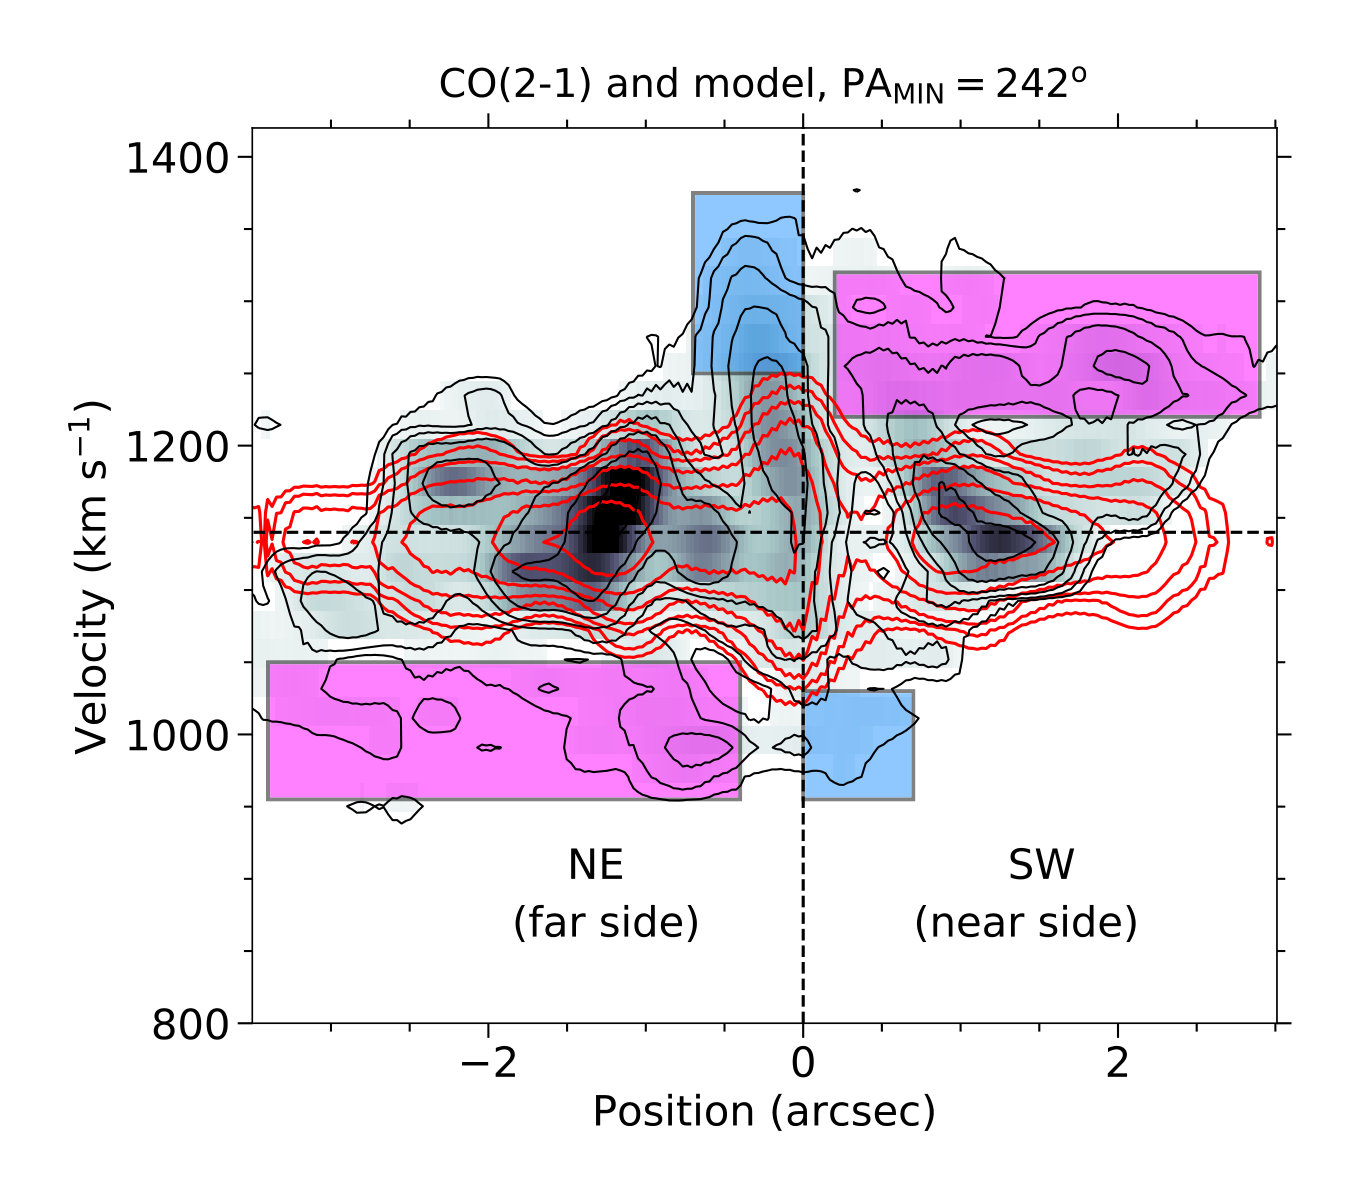 Figure 8
 Figure 8
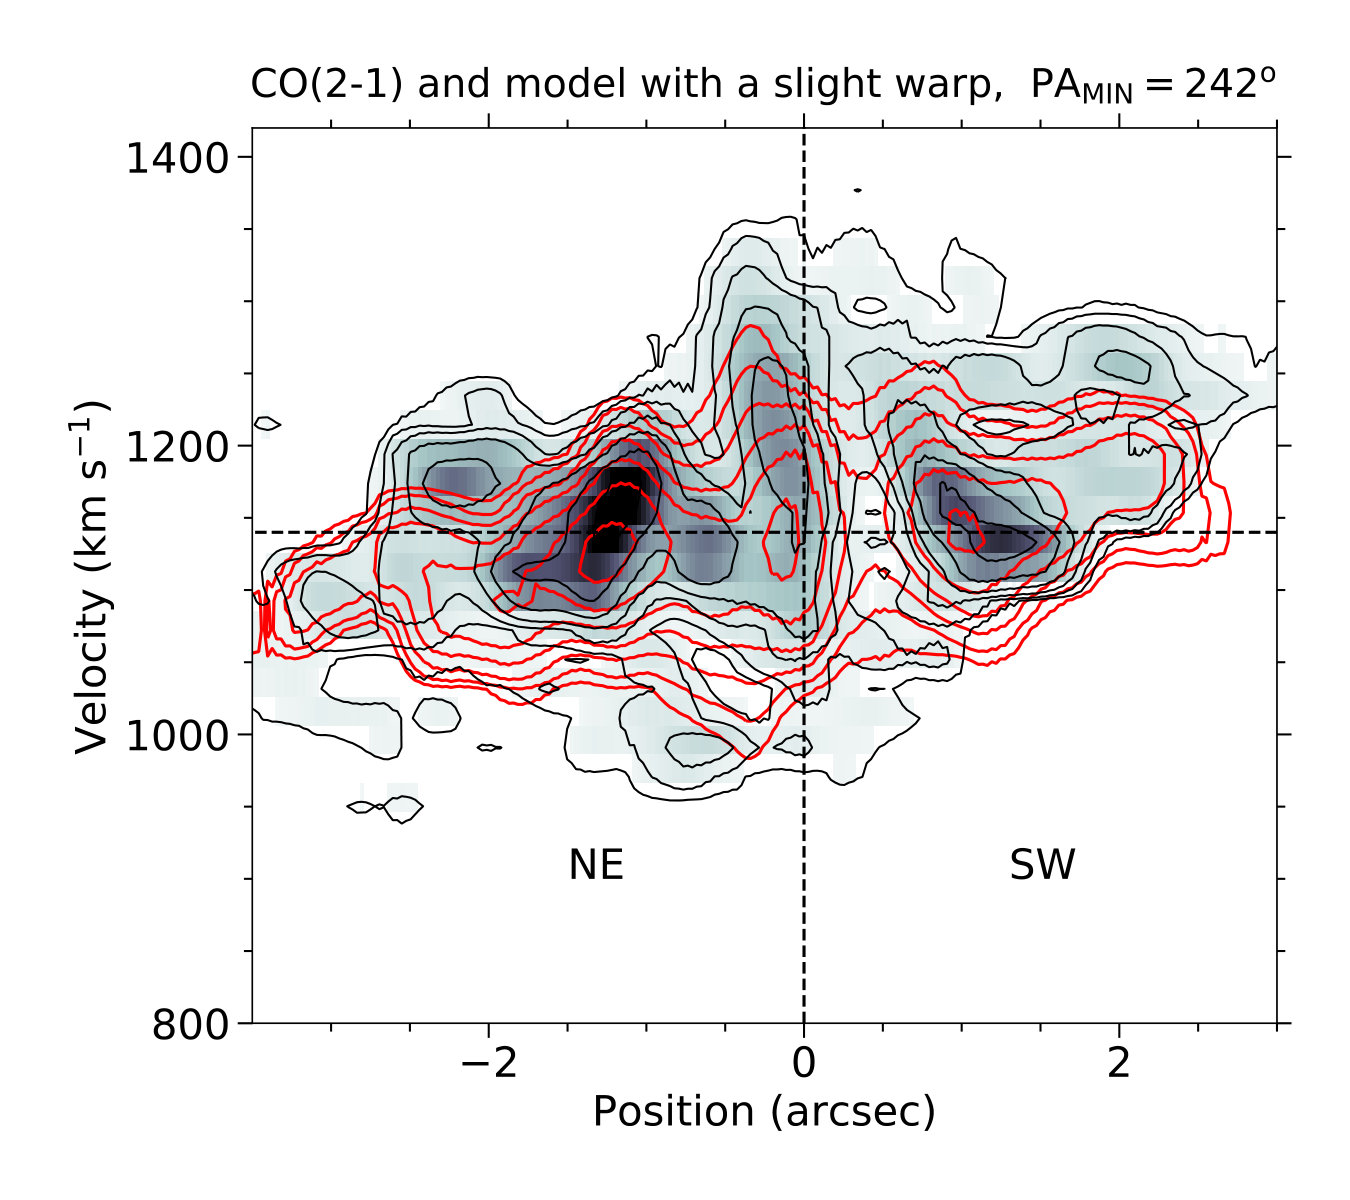 Figure 8
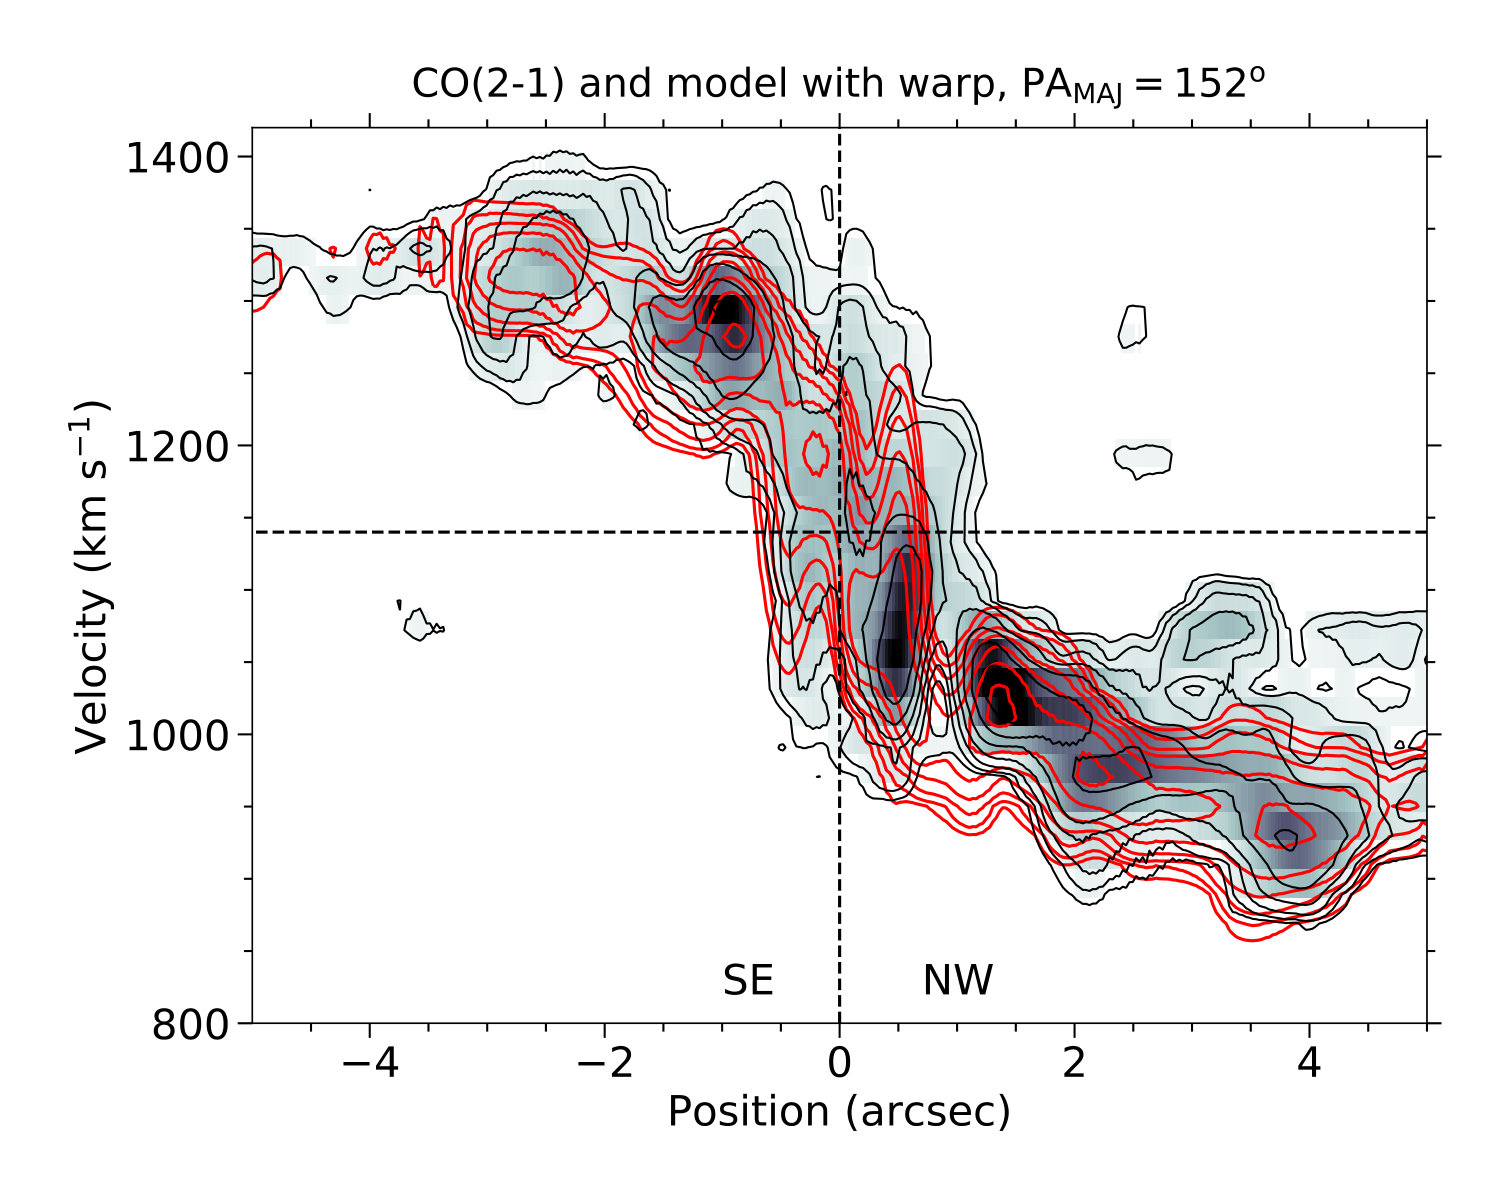 Figure 8
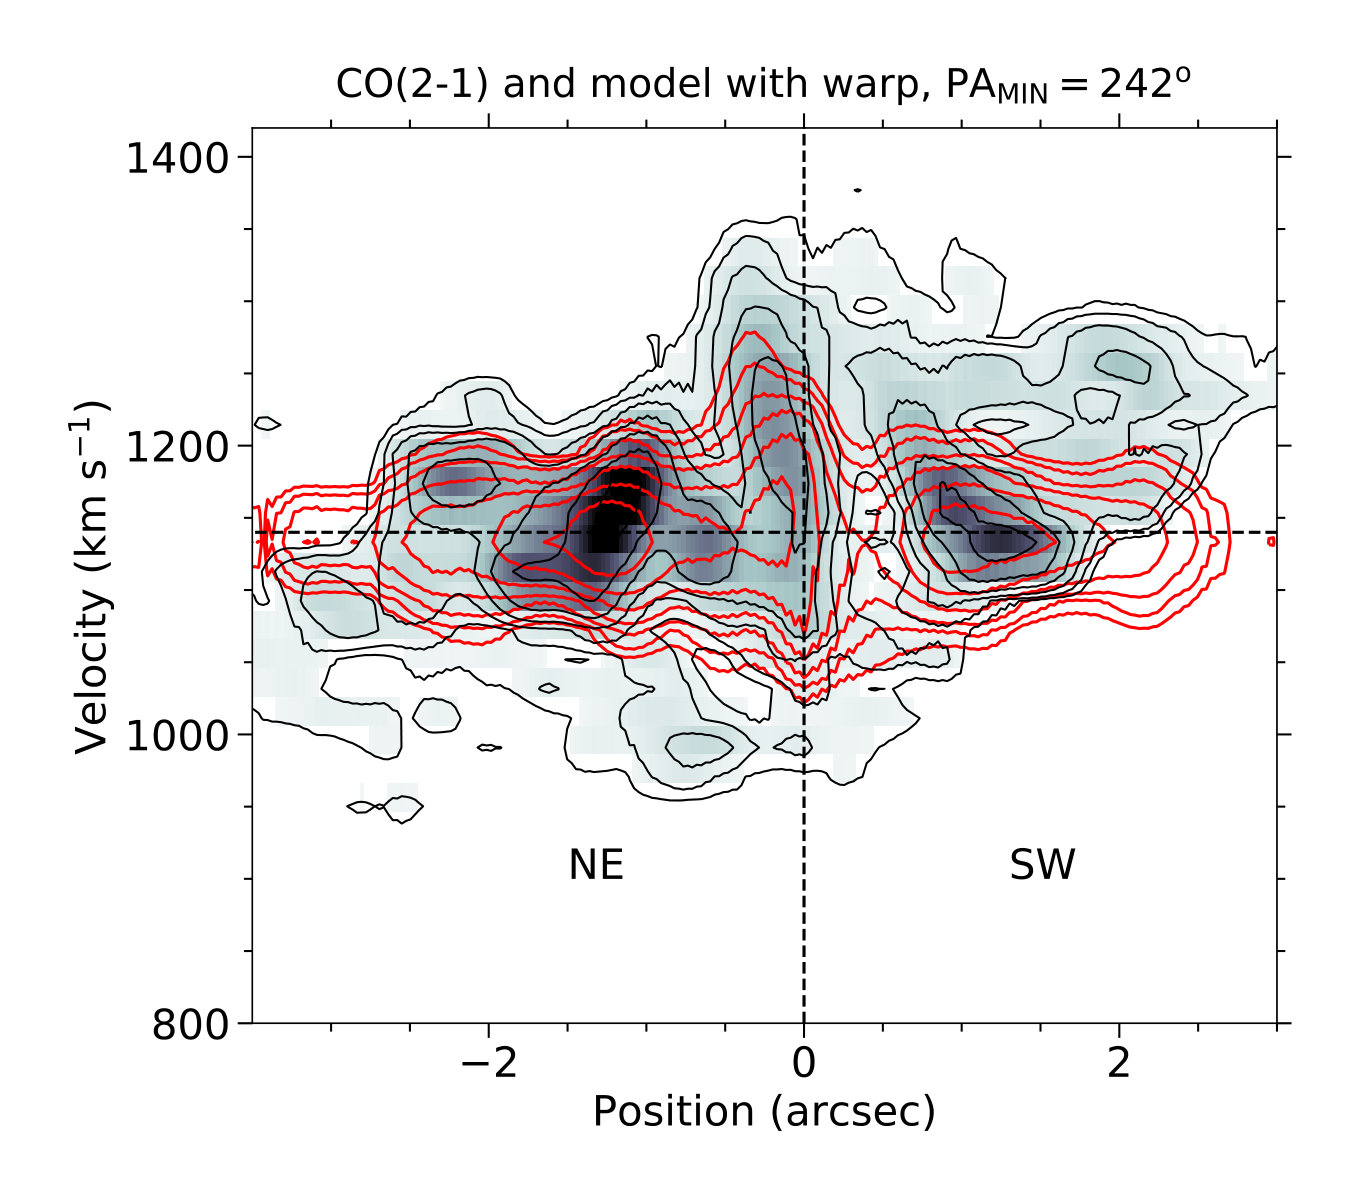 Figure 8
 Figure 8
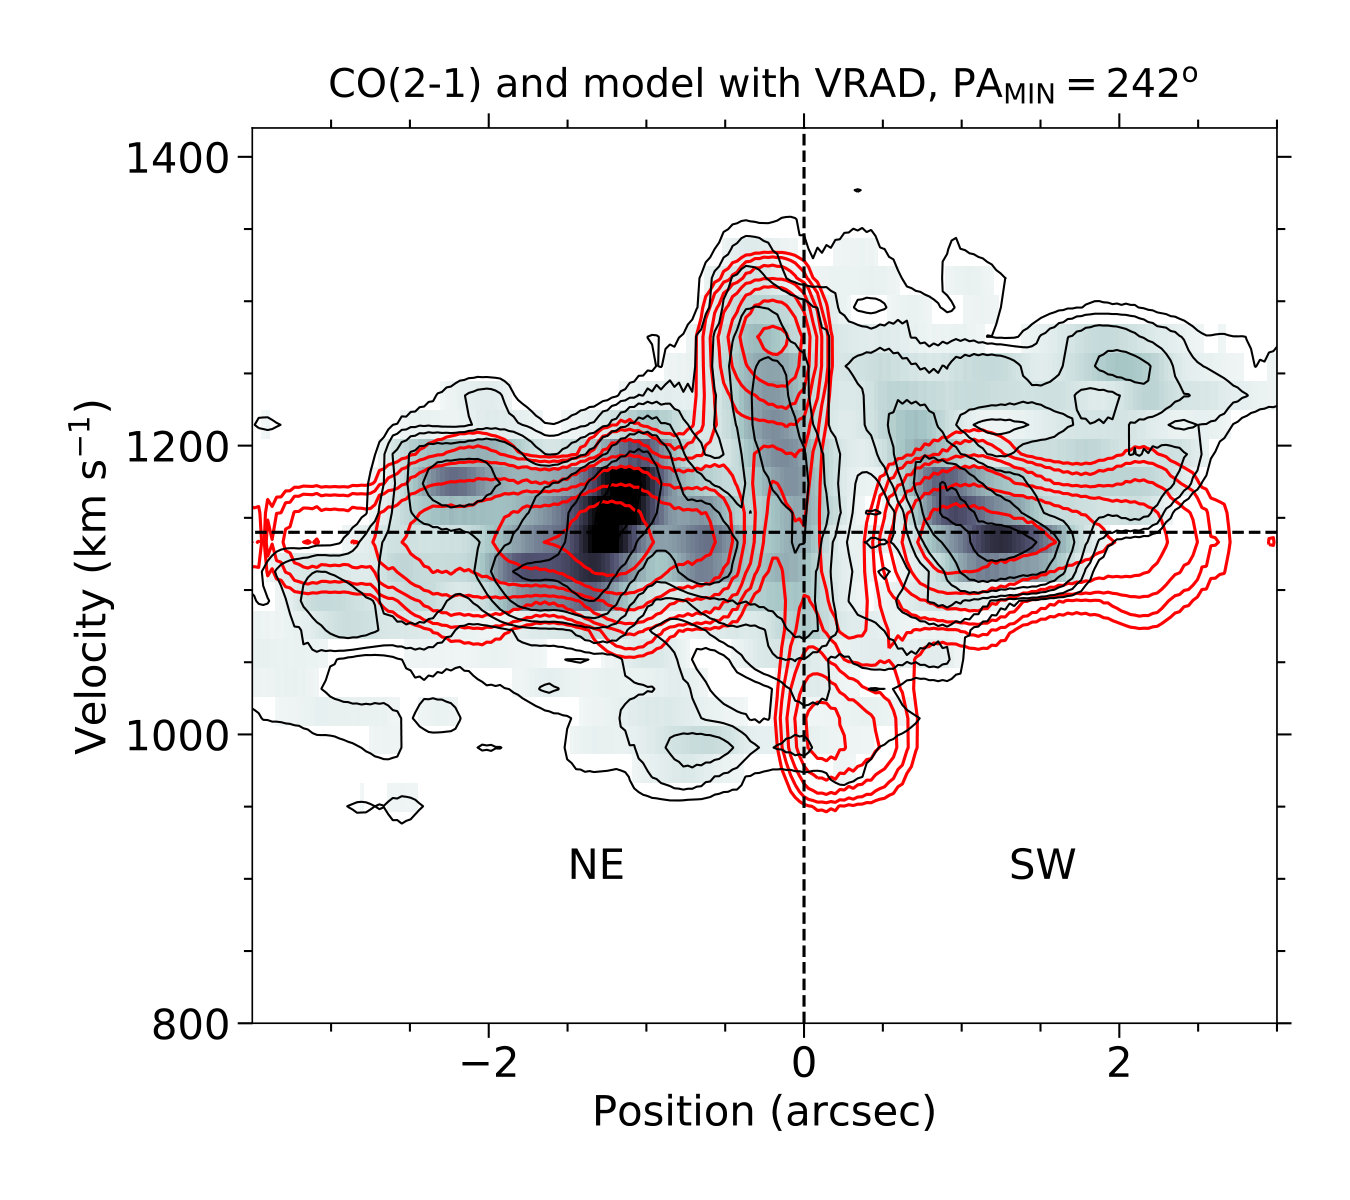 Figure 8
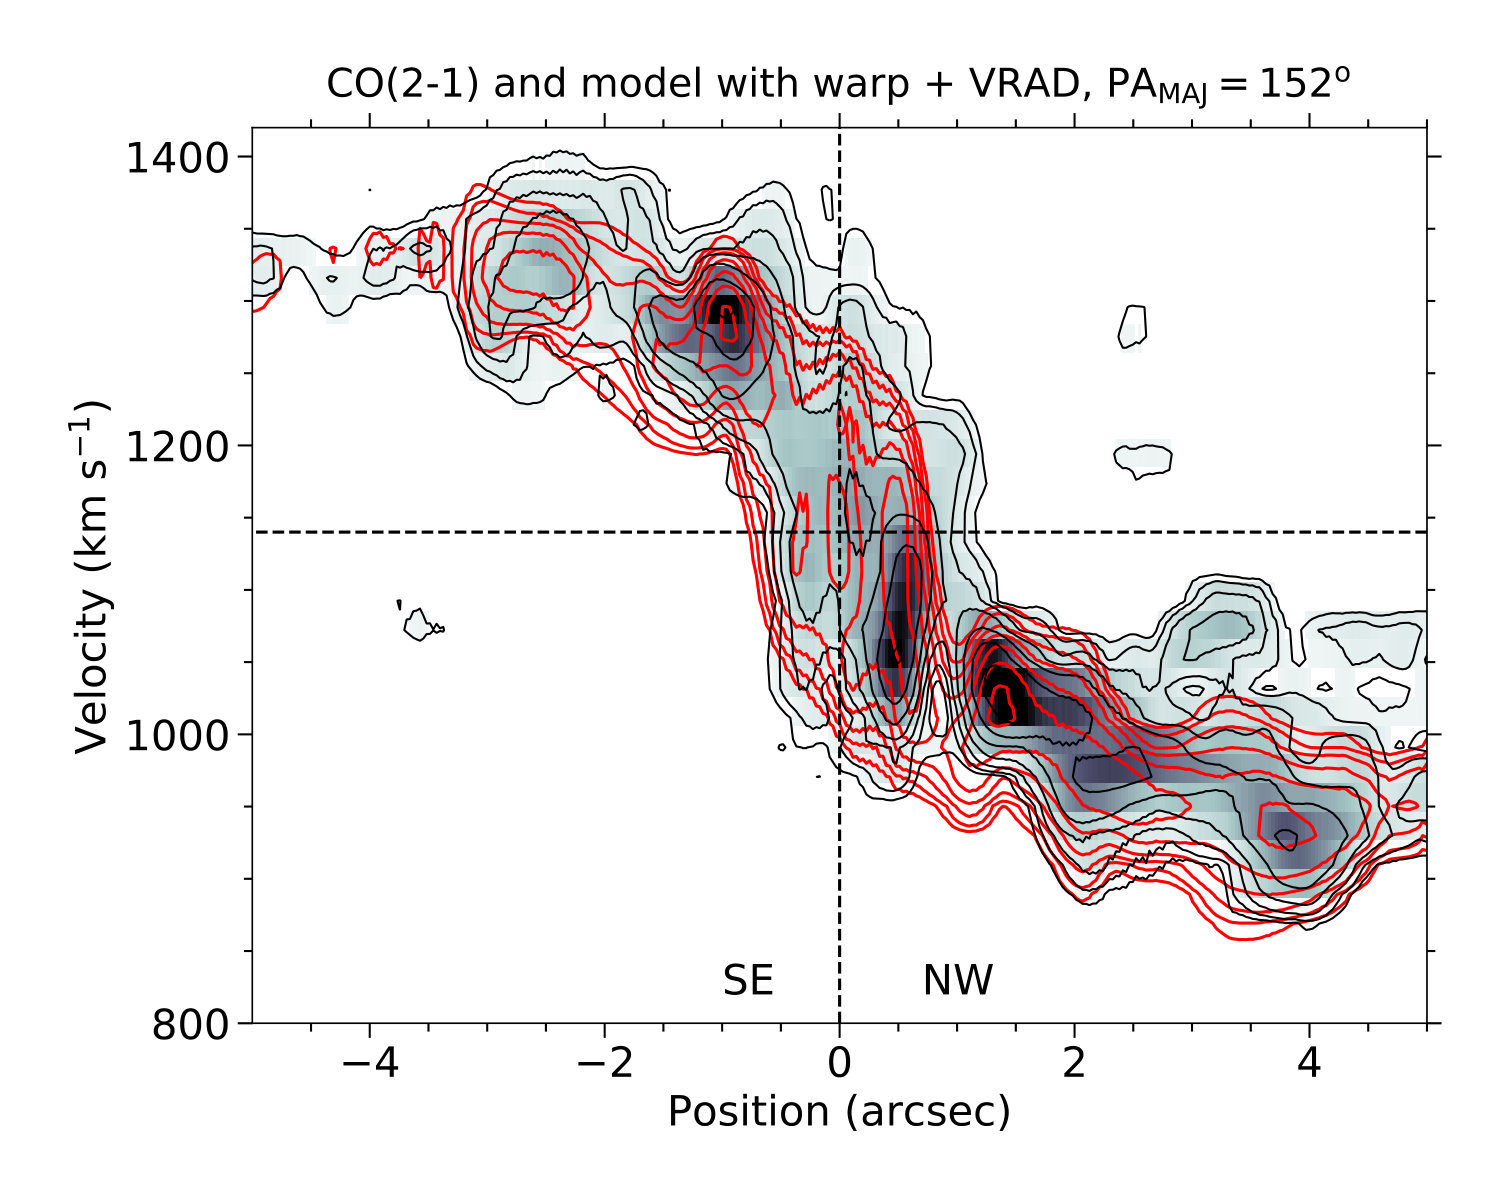 Figure 8
 Figure 8
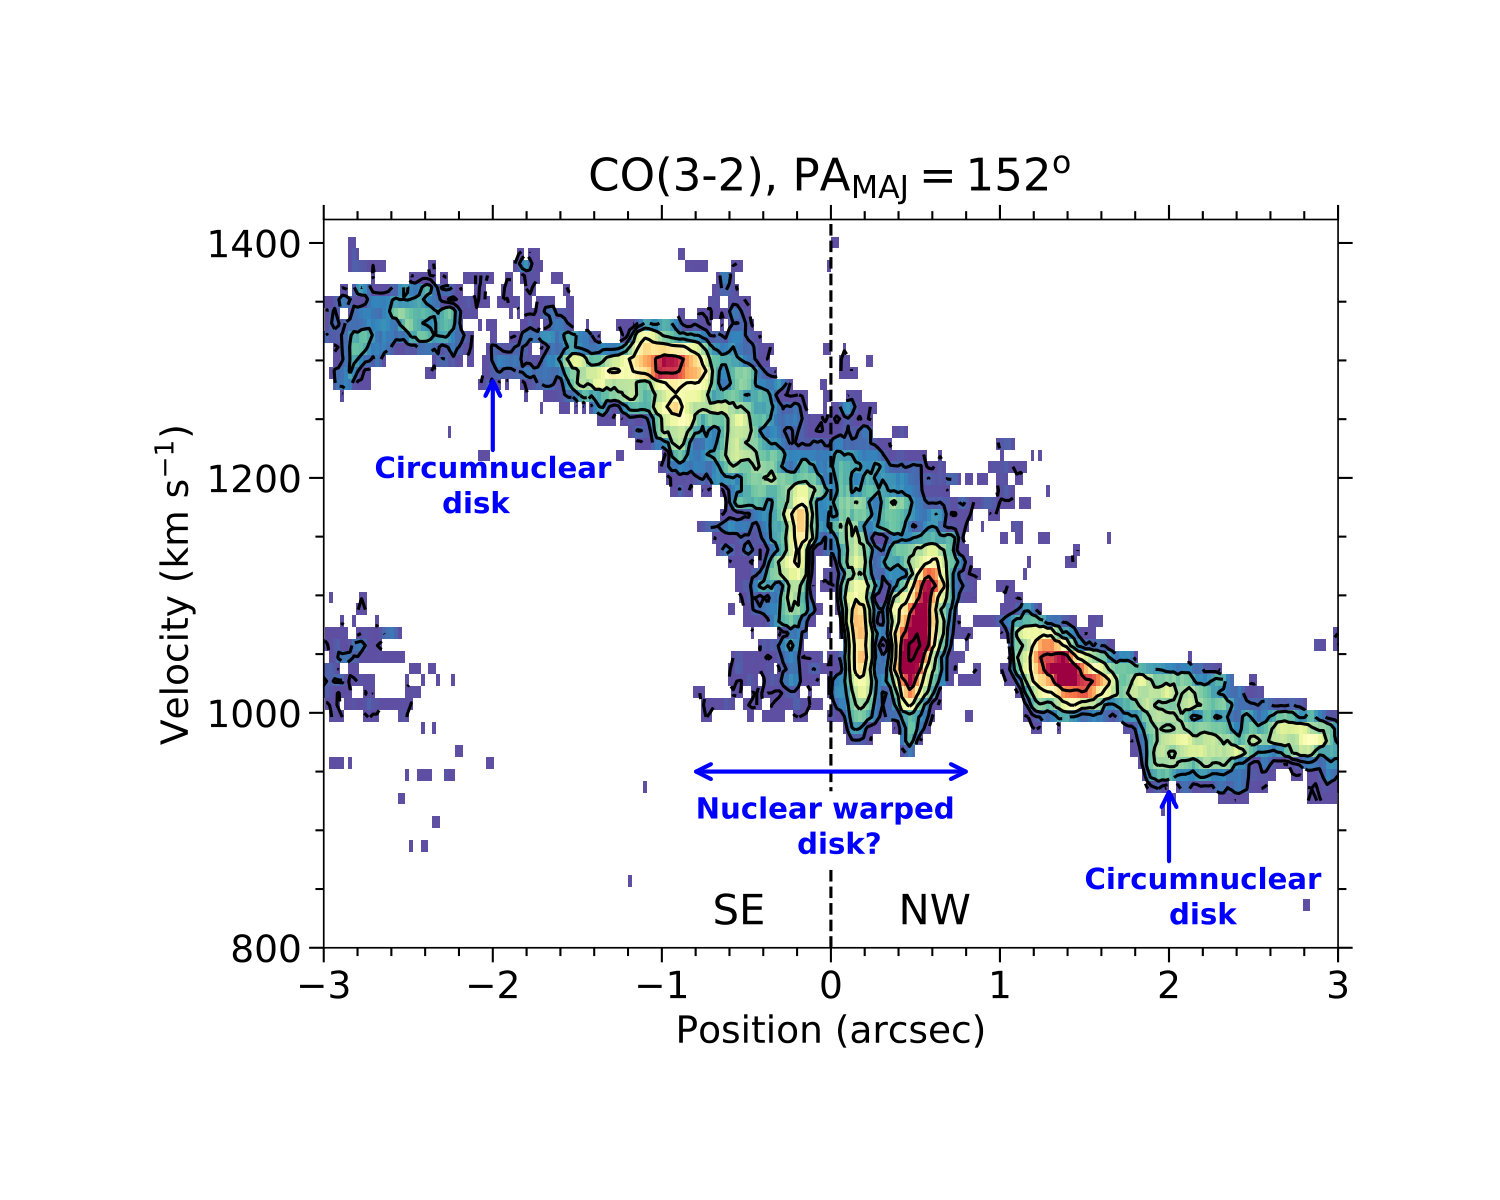 Figure 9
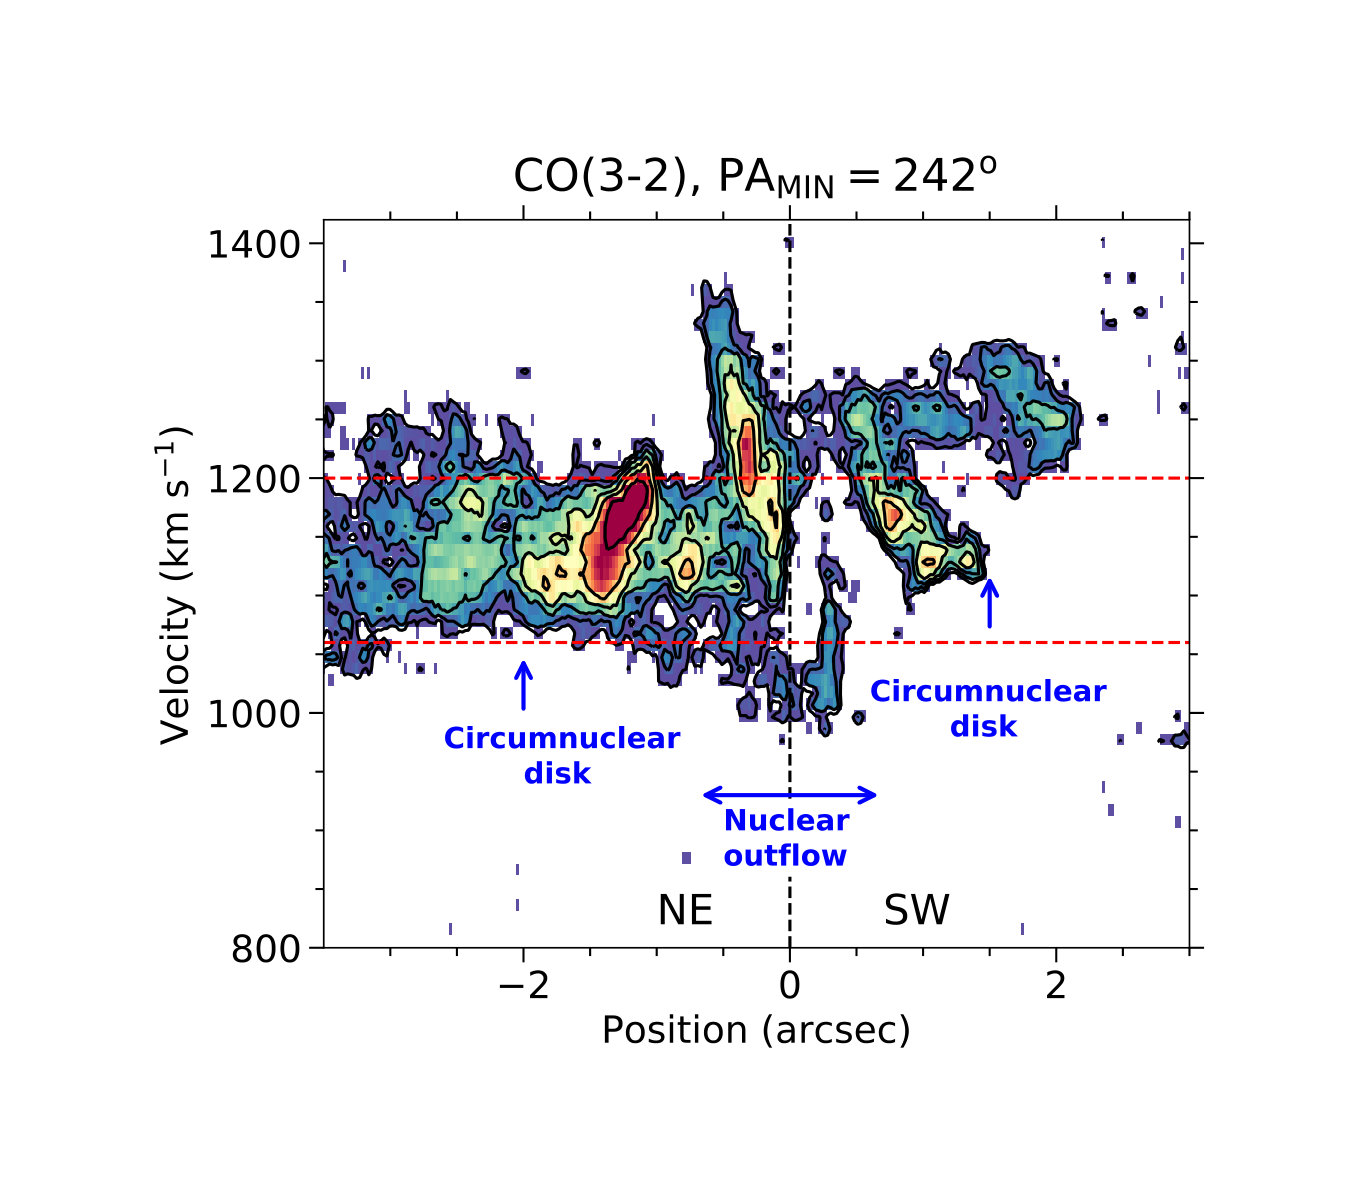 Figure 9
| ALMA | weight | Beam size | PAbeam | rms |
|---|---|---|---|---|
| () | (°) | (mJy beam-1) | ||
| Band 6 | 48.1 | |||
| Band 6 | 45.7 | |||
| Band 7 | natural | 16.6 |
| ALMA | Transition | weight | Beam size | PAbeam | rms per channel | vel res. |
|---|---|---|---|---|---|---|
| () | (°) | (mJy km s-1 beam-1) | (km s-1) | |||
| Band 6 | CO(2–1) | 42.0 | 15 | |||
| Band 7 | CO(3–2) | natural | 21.3 | 10 |
| Aperture | Flux density | Line flux | Mass | ||
| 1.3 mm | m | CO(2–1) | CO(3–2) | Mol Gas | |
| () | (mJy) | (mJy) | (Jy km s-1) | (Jy km s-1) | () |
| 0.7 | 0.9 | 1.2 | 1.7 | ||
| 1.7 | 2.0 | 7.3 | 14.3 | ||
| Model Name | Large disk | Nuclear region | ||
|---|---|---|---|---|
| component | component | parameters | type | |
| Disk | fixed∗ | none | … | … |
| Disk + nuclear slight warp | var | warp | , PA | var |
| Disk + nuclear warp | fixed∗ | warp | , PA | fixed |
| Disk + nuclear outflow | fixed∗ | non-circular | km s-1 | fixed |
| Disk + nuclear warp + outflow | fixed∗ | warp + non-circular | , PA | |
| km s-1 | fixed | |||
Peer Reviews
No public reviews on file for this paper yet. If you reviewed it on a platform where reviews are public (OpenReview, ICLR, NeurIPS, ICML), you can paste yours below so the community can read it here.
Videos
No videos yet. Explain this paper in a talk, walkthrough, or lecture? Add one.
11institutetext: Centro de Astrobiología (CAB, CSIC-INTA), ESAC Campus, E-28692 Villanueva de la Cañada, Madrid, Spain
11email: [email protected] 22institutetext: Observatorio de Madrid, OAN-IGN, Alfonso XII, 3, E-28014 Madrid, Spain 33institutetext: Department of Physics, University of Oxford, Keble Road, Oxford OX1 3RH, UK 44institutetext: Max Planck Institut für extraterrestrische Physik Postfach 1312, D-85741 Garching bei München, Germany 55institutetext: LERMA, Obs. de Paris, PSL Research Univ., Collége de France, CNRS, Sorbonne Univ., UPMC, Paris, France 66institutetext: DARK, The Niels Bohr Institute, University of Copenhagen, Vibenshuset, Lyngbyvej 2, DK-2100 Copenhagen O., Denmark 77institutetext: Steward Observatory, University of Arizona, 933 N. Cherry Avenue, Tucson, Arizona, USA 88institutetext: Núcleo de Astronomía de la Facultad de Ingeniería, Universidad Diego Portales, Av. Ejército Libertador 441, Santiago, Chile 99institutetext: Department of Physics & Astronomy, University of Southampton, Hampshire SO17 1BJ, Southampton, UK 1010institutetext: Instituto de Física de Cantabria, CSIC-Universidad de Cantabria, E-39005 Santander, Spain 1111institutetext: Department of Physics & Astronomy, University of Alaska Anchorage, AK 99508-4664, USA 1212institutetext: INAF-Osservatorio Astrofisico di Arcetri, Largo E. Fermi 5, 50125 Firenze, Italy 1313institutetext: National Astronomical Observatory of Japan, National Institutes of Natural Sciences (NINS), 2-21-1 Osawa, Mitaka, Tokyo 181–8588, Japan 1414institutetext: Department of Astronomical Science, SOKENDAI (The Graduate University of Advanced Studies), 2-21-1 Osawa, Mitaka, Tokyo 181-8588, Japan 1515institutetext: Space Telescope Science Institute, 3700 San Martin Drive, Baltimore, MD 21218, USA 1616institutetext: Astrophysics Research Institute, Liverpool John Moores University, IC2 Liverpool Science Park, 146 Brownlow Hill, L3 5RF, UK 1717institutetext: Department of Physics and Astronomy, University of Texas at San Antonio, 1 UTSA Circle, San Antonio, TX 78249, USA 1818institutetext: Instituto de Astrofísica de Canarias, Calle Vía Láctea, s/n, E-38205, La Laguna, Tenerife, Spain 1919institutetext: Departamento de Astrofísica, Universidad de La Laguna, E-38206, La Laguna, Tenerife, Spain 2020institutetext: Kavli Institute for Astronomy and Astrophysics, Peking University, Beijing 100871, China 2121institutetext: Centre for Extragalactic Astronomy, Durham University, South Road, Durham DH1 3LE, UK 2222institutetext: Excellence Cluster Origins, Ludwig-Maximilians-Universität München, Boltzmannstr. 2, 85748 Garching, Germany
A nuclear molecular outflow in the Seyfert galaxy NGC 3227
A. Alonso-Herrero A nuclear molecular outflow in the Seyfert galaxy NGC 3227A nuclear molecular outflow in the Seyfert galaxy NGC 3227
S. García-Burillo A nuclear molecular outflow in the Seyfert galaxy NGC 3227A nuclear molecular outflow in the Seyfert galaxy NGC 3227
M. Pereira-Santaella A nuclear molecular outflow in the Seyfert galaxy NGC 3227A nuclear molecular outflow in the Seyfert galaxy NGC 3227
R. I. Davies A nuclear molecular outflow in the Seyfert galaxy NGC 3227A nuclear molecular outflow in the Seyfert galaxy NGC 3227
F. Combes A nuclear molecular outflow in the Seyfert galaxy NGC 3227A nuclear molecular outflow in the Seyfert galaxy NGC 3227
M. Vestergaard A nuclear molecular outflow in the Seyfert galaxy NGC 3227A nuclear molecular outflow in the Seyfert galaxy NGC 3227A nuclear molecular outflow in the Seyfert galaxy NGC 3227A nuclear molecular outflow in the Seyfert galaxy NGC 3227
S. I. Raimundo A nuclear molecular outflow in the Seyfert galaxy NGC 3227A nuclear molecular outflow in the Seyfert galaxy NGC 3227
A. Bunker A nuclear molecular outflow in the Seyfert galaxy NGC 3227A nuclear molecular outflow in the Seyfert galaxy NGC 3227
T. Díaz-Santos A nuclear molecular outflow in the Seyfert galaxy NGC 3227A nuclear molecular outflow in the Seyfert galaxy NGC 3227
P. Gandhi A nuclear molecular outflow in the Seyfert galaxy NGC 3227A nuclear molecular outflow in the Seyfert galaxy NGC 3227
I. García-Bernete A nuclear molecular outflow in the Seyfert galaxy NGC 3227A nuclear molecular outflow in the Seyfert galaxy NGC 3227
E. K. S. Hicks A nuclear molecular outflow in the Seyfert galaxy NGC 3227A nuclear molecular outflow in the Seyfert galaxy NGC 3227
S. F. Hönig A nuclear molecular outflow in the Seyfert galaxy NGC 3227A nuclear molecular outflow in the Seyfert galaxy NGC 3227
L. K. Hunt A nuclear molecular outflow in the Seyfert galaxy NGC 3227A nuclear molecular outflow in the Seyfert galaxy NGC 3227
M. Imanishi A nuclear molecular outflow in the Seyfert galaxy NGC 3227A nuclear molecular outflow in the Seyfert galaxy NGC 3227A nuclear molecular outflow in the Seyfert galaxy NGC 3227A nuclear molecular outflow in the Seyfert galaxy NGC 3227
T. Izumi A nuclear molecular outflow in the Seyfert galaxy NGC 3227A nuclear molecular outflow in the Seyfert galaxy NGC 3227
N. A. Levenson A nuclear molecular outflow in the Seyfert galaxy NGC 3227A nuclear molecular outflow in the Seyfert galaxy NGC 3227
W. Maciejewski A nuclear molecular outflow in the Seyfert galaxy NGC 3227A nuclear molecular outflow in the Seyfert galaxy NGC 3227
C. Packham A nuclear molecular outflow in the Seyfert galaxy NGC 3227A nuclear molecular outflow in the Seyfert galaxy NGC 3227A nuclear molecular outflow in the Seyfert galaxy NGC 3227A nuclear molecular outflow in the Seyfert galaxy NGC 3227
C. Ramos Almeida A nuclear molecular outflow in the Seyfert galaxy NGC 3227A nuclear molecular outflow in the Seyfert galaxy NGC 3227A nuclear molecular outflow in the Seyfert galaxy NGC 3227A nuclear molecular outflow in the Seyfert galaxy NGC 3227
C. Ricci A nuclear molecular outflow in the Seyfert galaxy NGC 3227A nuclear molecular outflow in the Seyfert galaxy NGC 3227A nuclear molecular outflow in the Seyfert galaxy NGC 3227A nuclear molecular outflow in the Seyfert galaxy NGC 3227
D. Rigopoulou A nuclear molecular outflow in the Seyfert galaxy NGC 3227A nuclear molecular outflow in the Seyfert galaxy NGC 3227
P. F. Roche A nuclear molecular outflow in the Seyfert galaxy NGC 3227A nuclear molecular outflow in the Seyfert galaxy NGC 3227
D. Rosario A nuclear molecular outflow in the Seyfert galaxy NGC 3227A nuclear molecular outflow in the Seyfert galaxy NGC 3227
M. Schartmann A nuclear molecular outflow in the Seyfert galaxy NGC 3227A nuclear molecular outflow in the Seyfert galaxy NGC 3227A nuclear molecular outflow in the Seyfert galaxy NGC 3227A nuclear molecular outflow in the Seyfert galaxy NGC 3227
A. Usero A nuclear molecular outflow in the Seyfert galaxy NGC 3227A nuclear molecular outflow in the Seyfert galaxy NGC 3227
M. J. Ward A nuclear molecular outflow in the Seyfert galaxy NGC 3227A nuclear molecular outflow in the Seyfert galaxy NGC 3227
(Received: –; accepted —)
ALMA observations have revealed nuclear dusty molecular disks/tori with characteristic sizes 15-40 pc in the few Seyferts and low luminosity AGN studied so far. These structures are generally decoupled both morphologically and kinematically from the host galaxy disk. We present ALMA observations of the CO(2–1) and CO(3–2) molecular gas transitions and associated (sub)-millimeter continua of the nearby Seyfert 1.5 galaxy NGC 3227 with angular resolutions (7–15 pc). On large scales the cold molecular gas shows circular motions as well as streaming motions on scales of a few hundred parsecs associated with a large scale bar. We fitted the nuclear ALMA 1.3 mm emission with an unresolved component and an extended component. The m emission shows at least two extended components, one along the major axis of the nuclear disk and the other along the axis of the ionization cone. The molecular gas in the central region (1″pc) shows several CO clumps with complex kinematics which appears to be dominated by non-circular motions. While we cannot demonstrate conclusively the presence of a warped nuclear disk, we also detected non-circular motions along the kinematic minor axis. They reach line-of-sight velocities of . Assuming that the radial motions are in the plane of the galaxy, then we interpret them as a nuclear molecular outflow due to molecular gas in the host galaxy being entrained by the AGN wind. We derive molecular outflow rates of and at projected distances of up to 30 pc to the northeast and southwest of the AGN, respectively. At the AGN location we estimate a mass in molecular gas of and an equivalent average column density in the inner 15 pc. The nuclear CO(2-1) and CO(3-2) molecular gas and sub-mm continuum emission of NGC 3227 do not resemble the classical compact torus. Rather, these emissions extend for several tens of parsecs and appear connected with the circumnuclear ring in the host galaxy disk, as found in other local AGN.
Key Words.:
** Galaxies: kinematics and dynamics – Galaxies: Seyfert – Galaxies: individual: NGC 3227 – Submillimeter: galaxies**
1 Introduction
The detection of the hidden broad line region of NGC 1068 (Antonucci & Miller, 1985), the archetypical type 2 active galactic nucleus (AGN), boosted the idea of the so-called Unified Model. A dusty molecular torus obscures the view of the central engine in type 2 AGN along directions near the equatorial plane while near polar directions allow the detection of the broad line region thus classifying the AGN as a type 1. This torus was proposed to be both geometrically and optically thick (e.g., Antonucci, 1993). To explain the observed properties of NGC 1068 and other active galaxies, the theoretical models initially favored a relatively compact torus (Pier & Krolik, 1992; Nenkova et al., 2002, 2008a, 2008b). Subsequently, it was suggested that the torus is part of a larger and more diffuse structure extending for up to 100 pc (Pier & Krolik, 1993; Granato & Danese, 1994; Maiolino & Rieke, 1995; Efstathiou & Rowan-Robinson, 1995; Young et al., 1996). However, only the inner warm parts of the torus would be responsible for the near and mid-infrared emission (Schartmann et al., 2008). Additionally, most local Seyfert galaxies with sufficiently high signal-to-noise mid-infrared interferometric observations show emission along the polar direction on parsec-scales (Tristram et al., 2009; Hönig et al., 2013; López-Gonzaga et al., 2016). Theoretical arguments indicate that this phenomenon could be associated with an outflowing torus, as already captured by dusty disk-wind models (Elitzur & Shlosman, 2006; Hönig & Kishimoto, 2017) and radiation-driven outflow models (Wada, 2012; Wada et al., 2016). Other alternatives to the optically and geometrically thick torus, including nuclear warped disks (see Jud et al., 2017, for Circinus) are discussed in detail by Lawrence & Elvis (2010). See also Ramos Almeida & Ricci (2017) for a recent review.
The excellent high angular resolution achieved with the Atacama Large Millimeter Array (ALMA) is now revealing that relatively large (diameters of up to 20-50 pc) molecular tori/disks appear to be common in the few local Seyferts and low-luminosity AGN observed so far (García-Burillo et al., 2014, 2016; Gallimore et al., 2016; Imanishi et al., 2018; Alonso-Herrero et al., 2018; Izumi et al., 2017, 2018; Combes et al., 2019). Moreover, these nuclear tori/disks appear to be decoupled both morphologically and kinematically from their host galaxies. This is in good agreement with previous results that found random orientations of the radio jets/ionization cones of local AGN with respect to their host galaxies (see e.g., Nagar & Wilson, 1999; Kinney et al., 2000; Fischer et al., 2013). Studying the mechanisms responsible for this decoupling as well as the physical scales where they operate is thus crucial for making progress in our understanding of the general question of the fueling and nuclear obscuration of active galaxies.
This is the second paper of a series (first paper, Alonso-Herrero et al., 2018) based on several ALMA programs to observe the cold molecular gas in the nuclear and circumnuclear regions of an ultra-hard X-ray selected sample of nearby Seyfert galaxies. Our parent sample is drawn from the X-ray Swift/BAT keV all-sky 70 month catalog (Baumgartner et al., 2013). Our main goal is to understand the connections between the cold and hot molecular gas, the AGN torus, and nuclear/circumnuclear star formation activity in local active galaxies. In this paper we present a detailed study of the cold molecular gas emission of the nearby Seyfert 1.5 galaxy NGC 3227. We use a distance of Mpc as derived from AGN lags (Yoshii et al., 2014) and thus 1″73 pc. The intrinsic keV X-ray luminosity is approximately erg s*-1* (Ricci et al., 2017) for our assumed distance. This galaxy is interacting with NGC 3226 and presents evidence for large scale streaming motions detected in neutral hydrogen (Mundell et al., 1995b). It is also located in a group of 13-14 galaxies (Davies et al., 2014). Finally, NGC 3227 is classified as SAB(s)a pec in the Third Reference Catalogue of Bright Galaxies (de Vaucouleurs et al., 1991). However, Mulchaey et al. (1997) modeled near-infrared observations of this galaxy, which revealed the presence of a large scale bar.
Schinnerer et al. (2000) used the Plateau de Bure interferometer (PdBI) to obtain CO(1–0) and CO(2–1) observations of NGC 3227 with angular resolutions in the range. They detected apparent counterrotation in the nuclear region of this galaxy and interpreted this kinematic signature as evidence of the warping of a thin inner molecular disk starting at an approximately outer radius of 1″. Davies et al. (2006), on the other hand, based on the high velocity dispersion of the hot molecular gas traced by the H2 m 1–0 S(1) emission line, argued that the nuclear kinematics could be explained with a nuclear thick disk with turbulent motions. In this paper we present ALMA Cycle 4 observations of the molecular gas CO(2–1) and CO(3–2) transitions and associated continuum of the nuclear region of NGC 3227, obtained with angular resolutions ranging from 0.21″ to 0.085″. The paper is organized as follows. Section 2 presents the ALMA observations and ancillary data used in this paper. In Sections 3 and 4 we discuss the (sub)-millimeter continuum and molecular gas CO(2–1) and CO(3–2) properties. We model the CO(2-1) molecular gas kinematics in Section 5. In Section 6 we derive the cold molecular gas mass and column density in the nuclear region of NGC 3227. Finally in Section 7 we present our conclusions.
2 Observations and Data Reduction
2.1 ALMA Band 6 and Band 7 observations
We obtained Band 6 ALMA observations of NGC 3227 between March and September 2017 using the 12 m array in two configurations (compact with baselines between 15 and 460 m and extended with baselines between 20 and 3700 m) and the Atacama Compact Array (ACA) with baselines between 9 and 50 m. These observations were part of the project 2016.1.00254.S (PI: A. Alonso-Herrero). We defined two spectral windows of 1.875 GHz bandwidth (with 3.9 MHz 5 km s*-1* channels), at the observed frequency of the CO(2-1) transition (229.8 GHz) and the other at an observed frequency of 231 GHz (1.3 mm) to measure the sub-millimeter continuum. We also used Band 7 ALMA data of NGC 3227 observed between August and September 2017 with the 12 m array in a single configuration with baselines between 21 and 3700 m observed for the 2016.1.01236.S (PI: M. Vestergaard) project. A spectral window was centered on the CO(3-2) transition (344.4 GHz) and other three spectral windows at 342.6, 354.6, and 356.5 GHz to measure the continuum (approximately m).
We calibrated and imaged the data using the ALMA reduction software CASA (v.5.1, McMullin et al., 2007). For the 12 m array data (Band 6 and 7), either J0854+2006 or J1058+0133 were used for both the bandpass and amplitude calibrations and J1025+1253 was used for the phase calibration. For the Band 6 ACA data, J1058+0133 was used for the bandpass calibration, Ganymede for the flux calibration, and J1041+0610 for the phase calibration. The Ganymede flux was estimated using the Butler-JPL-Horizons 2012 model. The consistency of the flux calibration was verified by comparing the observed amplitudes as a function of the uv distance for all the configurations. Since the amplitudes of the overlapping baselines are similar we can conclude that the flux calibration is consistent. The J0854 and J1058 fluxes are 2.5 and 3.1 Jy at 229 GHz. Finally, we note that we used the same phase calibrator for band 6 and 7 except for the ACA band 6 data (J1041+0610). However, the ACA data should not significantly affect the emission detected on the scales discussed in this work and therefore, all the data are referenced to the same phase calibrator.
We subtracted the corresponding continua from the CO(2-1) and CO(3-2) spectral windows directly in the visibility data by fitting the continuum emission with a constant in the line-free channels. Then, we combined and cleaned the data using the CASA clean task. The output frequency reference frame was set to the kinematic local standard of rest (LSRK). For the Band 6 continuum images, we used a continuum spectral window which we cleaned with the CASA clean task using the Briggs weighting (Briggs, 1995), with robustness parameters of and . These result in a lower angular resolution and higher sensitivity, and higher angular resolution and slightly decreased sensitivity, respectively. We summarize the beam properties and sensitivities of the Band 6 and Band 7 continuum maps in Table 1. For the Band 7 data, we combined the line-free channels of the 4 spectral windows also using the CASA clean task and a natural weight (b=2). For the CO(2–1) and CO(3–2) transitions we produced cleaned data cubes with weights and natural, respectively and the resulting beam sizes and sensitivities are listed in Table 2. As can be seen from these two tables, our ALMA observations have angular resolutions between 0.085 and 0.21″. For the assumed distance to NGC 3227 they probe physical resolutions in the 7-15 pc range.
From the Band 6 and Band 7 data cubes we produced maps of the CO(2–1) and CO(3–2) integrated intensity, mean-velocity field, and velocity dispersion, respectively. For this we used the GILDAS111http://www.iram.fr/IRAMFR/GILDAS moment task and set the threshold limit to and . In Figure 1 (left panel), we show the integrated CO(2–1) molecular line map created from the Band 6 data cube with and the detection threshold. We show an approximate field of view (FoV) of , which corresponds to a circumnuclear region of in size. In this figure and following figures, the coordinates are in the International Coordinate Reference System (ICRS) frame.
2.2 Ancillary archival HST images
We downloaded from the Hubble Legacy Archive (HLA) images taken with the Advanced Camera for Surveys (ACS) on board of the Hubble Space Telescope (HST) using the narrow-band filter F658N, which contains the H+[N ii] emission lines, and the broad-band filter F814W (proposal ID: 9293). The HLA images are fully reduced and drizzled to a pixel size of 0.05″. We adjusted the HST/ACS astrometry for NGC 3227 by fixing the coordinates of the bright nuclear point source to that of the peak of the unresolved ALMA band 6 continuum at 1.3 mm (see Section 3.1). To trace the emission from the NGC 3227 ionization cone and circumnuclear H ii regions (see Gonzalez Delgado & Perez, 1997) at high angular resolution, we constructed a pseudo H+[N ii] line map by dividing the F658N image by that of the nearby broad-band continuum traced by the F814W image (Figure 1, right panel). This map also highlights the regions with high extinction. These are seen as dust lanes toward the west, southwest and southeast of the nucleus (marked in the figure), which are due mostly to material in the near side of the galaxy (see Martini et al., 2003; Davies et al., 2014).
In Figure 1 we show the F658N/F814W map for the same FoV as the ALMA CO(2–1) integrated line emission map. As inferred from optical imaging, line ratios and emission line kinematics of this galaxy (Mundell et al., 1995a; Gonzalez Delgado & Perez, 1997), the line emission to the north, northwest and northeast is mostly photoionized by the AGN and it is likely tracing mostly one side of the ionization cone of this galaxy (Fischer et al., 2013), whereas the emission at to the southwest of the AGN is mostly due to star formation activity in the disk of the galaxy. Further indication for AGN photoionization to the north and northeast is the detection of outflowing ionized gas at PA, reaching velocities of up to (see Barbosa et al., 2009). Moreover, modelling of the ionized gas kinematics finds a position angle (measured east from the north) for the ionization cone of PA (Fischer et al., 2013). This value is also in good agreement with the value derived from optical polarization, assuming that the polarization is due to polar scattering (Smith et al., 2004).
3 Nuclear continuum emission
3.1 Morphology
In Figure 2 we show the images of the 1.3 mm and m continua of NGC 3227 for the nuclear region (). The continuum at both wavelengths appears clearly extended. The 1.3 mm continuum presents a complex morphology with an unresolved source and probably several extended components (see below). The 1.3 mm continuum map derived from the weight data cube shows an extended component along the northeast-southwest direction, that is, at a PA. This direction coincides with the axis of the projected H+[N ii] emission (see the right panel of Figure 1), which traces mostly emission on one side of the cone in the ionization cone (see e.g. Mundell et al., 1995a; Gonzalez Delgado & Perez, 1997; Barbosa et al., 2009; Fischer et al., 2013). The 1.3 mm continuum map derived with the weight, which has higher angular resolution (see Table 1 and middle panel of Figure 2), shows more clearly that in addition to the emission in the direction of the ionization cone, there is another component nearly perpendicular to it (see below).
For simplicity we modelled the 1.3 mm continuum in the uv plane using only two components, namely a point source and a Gaussian source to encompass all the extended emission. We left the positions of the two sources free and we only fixed the width of the extended component to FWHM= due to the limited signal-to-noise ratio of this component. For the unresolved component we obtained the following coordinates (ICRS frame) RA(ICRS)=10h23m30.574s and Dec(ICRS)=+1951′54.278″. These coordinates are, within the errors, coincident with source C detected at 1.7 and 5 GHz by Bontempi et al. (2012) using high angular resolution European VLBI Network (EVN) radio observations. Given the high brightness temperature and spectral index of source C, these authors identified it as the position of the AGN of NGC 3227. The 1.3 mm extended component does not peak exactly at the same position but it appears offset by approximately 0.07″ to the southeast of the AGN position. This offset appears to be real as it is a factor of a few above the positional uncertainties of the phase calibrator used during the data reduction. The derived fluxes at 1.3 mm are mJy and mJy for the unresolved and resolved components, respectively.
The m continuum map (Figure 2, right panel) shows that most of the nuclear emission at this wavelength has a disk-like morphology extending for about 0.6″ (pc) and oriented at PA to , which is perpendicular to the axis of the ionization cone. There is also fainter emission in the direction of the ionization cone (see also the top panel of Figure 3). The m continuum morphology shows a remarkable resemblance to the SINFONI Br narrow component map presented by Davies et al. (2006) (their figure 3, with a similar FoV as our continuum maps). These authors interpreted this Br emission as originating mostly in star formation activity and is probably associated with the nuclear stellar disk. There is also evidence for the presence of nuclear on-going/recent star formation activity from the detection of polycyclic aromatic hydrocarbon emission on scales of (Imanishi, 2002; Rodríguez-Ardila & Viegas, 2003; Davies et al., 2007; Esquej et al., 2014; Alonso-Herrero et al., 2016). Moreover, Davies et al. (2006) also suggested that the MERLIN 6 cm radio continuum emission (Mundell et al., 1995a), which has an extended component approximately in the same direction as the nuclear disk, might be due to the superposition of many supernova remnants rather than due to a radio jet (see also Chapman et al., 2000).
3.2 Spectral index
To investigate further the nuclear (sub)-millimeter continuum emission of NGC 3227, we constructed a map of the 1.3 mm to m spectral index, defined as , with the ALMA Band 6 and Band 7 continuum images. We used GILDAS to convolve the m continuum map to the beam size and orientation of the 1.3 mm continuum map for the weight ( at PA). We show the result in the bottom panel of Figure 3. For the spectral index map we only used pixels where both continua were detected at a level or higher. With the adopted definition of the spectral index, positive values in the range to would indicate a thermal dust component (from the dusty molecular torus or dust heated by star formation or both). Pure synchrotron radiation (from a jet or supernova remnants) has (for non-beamed emission), and thermal free-free emission (associated for instance with H ii regions) takes values of for optically thin emission and for optically thick emission. More complicated scenarios, which have been discussed for NGC 1068, include synchrotron emission with free-free absorption and electron scattered synchrotron emission (Hönig et al., 2008; Krips et al., 2011; Pasetto et al., 2019). These processes result in positive spectral indices. Finally optically-thick synchrotron with can also be relevant to low-luminosity AGN (Koljonen et al., 2015).
In Figure 3 (bottom panel) we show the spectral index map of the nuclear region of NGC 3227. The spectral index map displays a range of values. These variations are real since they take place on scales larger than the map beam. This suggests that the (sub)-millimeter emission in this region is a combination of different mechanisms. To the south and southwest of the AGN position out to projected distances of 0.2″, the spectral index appears to be mostly negative. This might indicate that synchrotron radiation dominates in this region. This direction coincides with that of the south part of the cone, which is obscured in the optical due to extinction from the host galaxy222The near side of the galaxy is to the southwest assuming that the spiral arms are trailing., as inferred from the modeling of the optical ionized gas kinematics (Fischer et al., 2013).
To the north and northeast of the AGN, the observed spectral index could reflect a combination of thermal processes and synchrotron emission. One possible interpretation for the extended 1.3 mm emission at PA to the northeast would be a combination of polar dust emission and emission produced in a radio jet. In the mid-infrared this galaxy shows extended m emission towards the north, northeast and south of the AGN (scales of approximately 2″, see Alonso-Herrero et al., 2016; Asmus et al., 2016; García-Bernete et al., 2016), which might be tracing dust emission in the ionization cone. If we interpret the non-thermal part of the extended 1.3 mm emission as a radio jet, then there would not be a large misalignment with the ionization cone emission and radio. It is worth mentioning that Mundell et al. (1995a) noted that there is also 18 cm radio emission detected perpendicular to PA, which could be associated with the ALMA extended emission at 1.3 mm. This extended radio emission at a position angle similar to that of the ionization cone can also be seen at 6 cm (see figure 9 of Davies et al., 2006).
Along the nuclear disk at PA and more importantly towards the northwest of the AGN the spectral index takes positive values. This could be associated with the on-going or recent star formation activity in the nuclear disk (Davies et al., 2006, 2007) via thermal processes such as dust emission or free-free emission due to H ii regions or both.
3.3 Nuclear radio to sub-millimeter SED
In addition to the ALMA spectral index map, we also compiled radio to (sub)-millimeter small aperture measurements to construct the nuclear spectral energy distribution (SED) shown in Figure 4. For the radio part we used the small aperture () MERLIN 18 cm and 6 cm data points of the southern source of Mundell et al. (1995a), which we associate with the AGN position. From the ALMA 1.3 mm and m continuum maps, we measured the flux densities through a square aperture 0.2″ (pc) on a side. We also measured the ALMA continuum flux densities for a larger square aperture 0.5″ on a side to approximately encompass the emission from the nuclear disk detected at m (see Figure 2). Table 3 lists the ALMA continuum measurements. We compare them with the Very Large Array (VLA) 5 GHz total flux density of Nagar et al. (2005) and the 3 mm flux density measured within approximately 1″ using the PdBI by Sani et al. (2012). For the identification of the AGN we show the EVN radio flux density for source C of Bontempi et al. (2012), which has a size of a few milli-arcseconds. We also show the fit to the nuclear infrared emission of NGC 3227 (typical angular resolutions ) using the Nenkova et al. (2008a, b) clumpy torus models derived by García-Bernete et al. (2019).
The derived spectral index fitted to the MERLIN nuclear values, , is similar (see also Mundell et al., 1995a) to that derived between 6 and 20 cm by Edelson (1987) for NGC 3227 and other Seyfert galaxies. The simplest interpretation is that it reflects mostly synchrotron emission at these frequencies. If we extrapolate this fit to the ALMA Band 6 and Band 7 frequencies (dashed magenta line in Figure 4), we can see that the contribution from optically-thin synchrotron emission to the ALMA bands would be small. However, the core emission could be self-absorbed. It is also possible that the low frequency spectral index of may not hold all the way to the mm wavelengths (Behar et al., 2018). Similarly, the predicted emission from the fitted Nenkova et al. (2008a, b) clumpy torus model at 1.3 mm and m would only account for a small fraction of the observed emission at these frequencies, even for the 0.2″ aperture. This suggests that even at m within the inner pc of NGC 3227, there is a significant contribution from star formation likely giving rise to thermal and non-thermal emission in this region. Indeed, Davies et al. (2006) estimated that in this nuclear region approximately 75% of the narrow component Br emission might originate in star formation (see also Davies et al., 2007). Alternatively there could be a more extended cold disk component, still heated by the AGN, which is not captured by the clumpy torus models.
4 CO molecular gas emission
4.1 Circumnuclear region
Figure 1 (left panel) shows the integrated CO(2–1) intensity map (the 0th-order moment map) covering a FoV of with a beam size of at PA. As previously shown by Schinnerer et al. (2000) using PdBI observations at lower angular resolution, the circumnuclear cold molecular gas shows an asymmetric ring-like morphology with a projected diameter of approximately (pc). This circumnuclear ring is also coincident with a stellar ring with low velocity dispersion, which Barbosa et al. (2006) interpreted as a ring with recent star formation activity. The circumnuclear ring is connected with the host galaxy disk through a large scale molecular bar, which extends for 10–15″ to the northwest and southeast of the galaxy nucleus, with the former part being brighter and in the direction of the companion galaxy (Meixner et al., 1990; Schinnerer et al., 2000).
Our ALMA CO(2–1) observations further resolve the circumnuclear ring into several clumps none of which coincide with the AGN location derived from the peak of the unresolved 1.3 mm continuum (see Section 3.1 and below). The comparison of the CO(2–1) map with the HST F658N/F814W map in the central almost suggests an anti-correspondence between the ionized gas (bright regions in this map) and the molecular gas, except for the bright H ii region located approximately 4″ southwest of the AGN. This is likely explained because most of the cold molecular gas is in the disk of the galaxy (see Section 5) while the ionized emission in the circumnuclear region to the northeast is tracing outflowing material in the ionization cone (Mundell et al., 1995a; Barbosa et al., 2009; Fischer et al., 2013). In fact, the regions of high extinction to the west and southwest in the near side of the galaxy, seen as dark lanes in the F658N/F814W map and in the color maps presented by Chapman et al. (2000), are all well traced by the CO(2–1) emission. This coincidence between molecular gas and dust lanes is expected and has been observed in other Seyfert galaxies (García-Burillo et al., 2005; Combes et al., 2013, 2014; Alonso-Herrero et al., 2018; Izumi et al., 2018).
4.2 Nuclear region
Figure 5 zooms in on to the nuclear region of NGC 3227. The left panels display in color the CO(2–1) and CO(3–2) integrated line emission. These maps show a complex morphology with several peaks of emission. The higher angular resolution CO(3–2) map reveals that none of these peaks are associated with the AGN position. The peaks of the CO(2–1) emission appear to be distributed along PA extending for about (see also Figure 1). The morphology of the extended CO(2–1) emission is similar to that seen in the m map when degraded to the same resolution (top panel of Figure 3). The CO(3–2) morphology in the nuclear region is similar to that of the hot molecular gas traced by the VLT/SINFONI adaptive optics near-infrared H2 1–0 S(1) line at m (Davies et al., 2006). We reproduce this map in Figure 6 (left). It has a FWHM angular resolution of 0.085″, which is similar to that of the ALMA CO(3–2) map. This indicates that near the AGN position these CO transitions are tracing warmer gas than in other environments (e.g., star forming regions), as also found in NGC 1068 by Viti et al. (2014).
The CO(3–2) intensity map resolves the inner 0.5″ (pc) emission into two main regions with the northwest clump being brighter of the two. In projection the AGN is located approximately in between these two CO(3–2) nuclear peaks. We note that even though the AGN does not coincide with any of the CO(3–2) clumps, there is molecular gas emission at the AGN location, as we shall see in Section 6. This nuclear molecular gas emission is also elongated similarly to that of the nuclear disk m and 1.3 mm continuum emission. Furthermore, the superposition of the 1.3 mm emission contours on the CO(3–2) maps (Figure 5) reveals that the faint 1.3 mm continuum emission also traces the innermost molecular gas clumps. There is also CO(3–2) emission in the direction of the polar dust/radio jet to the northeast of the AGN. However, to the southwest of the AGN there appears to be a region where some of the gas might have been evacuated. In this region there is evidence of the presence of shocks (Schönell et al., 2019). Based on the high velocity dispersion of the hot molecular gas in this region Davies et al. (2006) interpreted the hot molecular gas emission as due to a highly turbulent rotating disk (see also Hicks et al., 2009).
5 CO(2–1) and CO(3–2)
kinematics
In this section we study the molecular gas kinematics of the nuclear and circumnuclear regions of NGC 3227 (central ) using our ALMA CO(2–1) and CO(3–2) observations.
Figure 7 (left panel) shows that in the central (a few hundred parsecs) the molecular gas follows circular motions. The CO(2–1) velocity field in this figure is noticeably similar to that of the 1–0 S(1) H2 line (Davies et al., 2014). However, at radial distances greater than 2-3″, the CO(2–1) and H2 velocity fields also show clear deviations from circular motions (see Section 5.1). The stellar kinematics on the other hand shows relatively well ordered motions on these scales (Barbosa et al., 2006; Davies et al., 2014), although with high velocity dispersion (Davies et al., 2006) in the nuclear region. Within the inner 1″ the CO(2–1) and CO(3–2) transitions show very complex kinematics (see the mean velocity fields in the right panels of Figure 5). The motions do not appear to follow the large scale velocity field except at the edges of the FoV. To the southeast (approximately 0.2″) of the AGN position and along the direction of the nuclear disk, there is a region with apparent counterrotation. In the direction of the ionization cone axis there are also clear deviations from circular motions. The hot molecular gas kinematics (see the VLT/SINFONI map in the right panel of Figure 6) traced with the 1–0 S(1) H2 line (Davies et al., 2006) shows again a remarkable resemblance with the CO(2–1) and CO(3–2) kinematics. These authors also noted the high velocity dispersions and interpreted the observations as due to the presence of a nuclear thick disk.
To understand the kinematics and the strong deviations from circular motions, we model the CO(2–1) data cube with 3DBAROLO (Di Teodoro & Fraternali, 2015). This code was developed to fit 3D tilted-ring models to emission-line data cubes using simple rotating disks. We first started by fitting a simple 3DBAROLO model of a rotating disk allowing the following parameters to vary: the systemic velocity (), the disk inclination () and PA3333DBAROLO defines the position angle of the major axis on the receding half of the galaxy, taken anticlockwise from the north direction on the sky and the inclination with respect to the observer ( for an edge-on view). of the kinematic major axis (PAMAJ), the circular velocity, and the velocity dispersion (). For the kinematic center we used the position of the AGN as that of the unresolved component from the two component fit to the 1.3 mm continuum emission (see Section 3.1). We first fitted the central few arcseconds where clear circular motions are observed and derived an average value of km s*-1*. With the systematic velocity fixed, we fitted the central and derived average values of the major axis PA and inclination of the host galaxy disk of PA and , respectively. These are in good agreement with those inferred from the stellar kinematics over similar physical scales (Barbosa et al., 2006; Davies et al., 2006, 2014; Hicks et al., 2009). The next step was to fix the values of the galaxy disk PA and inclination and the systemic velocity and fit only the velocity dispersion and circular velocity. The resulting 3DBAROLO model together with the CO(2–1) mean velocity field (1st-order moment map) are presented in Figure 7.
In the following subsections we will use this simple rotating disk model as our base model to first look for departures from circular motions and then to add nuclear components to try to reproduce the observed kinematics.
5.1 Streaming motions
We constructed a CO(2–1) residual mean velocity field map (right panel of Figure 7) by subtracting the 3DBAROLO rotating disk model from the observed mean velocity field. On circumnuclear scales, the model reproduces the mean velocity field except along the minor kinematic axis. There are strong velocity deviations from circular motions at approximately projected along this axis, as well as in the nuclear region (see below). The velocity residuals, which are of the order of or more, are positive to the northwest and west (projected radial distances greater than pc) and negative to the southeast (projected radial distances greater than pc). Davies et al. (2014) observed similar velocity residuals on scales of a few arcseconds from the AGN when modeling the kinematics of the near-infrared H2 line at m with a rotating disk.
We can also compare the observed CO(2–1) position-velocity (p-v) diagrams along the major and minor kinematic axes of the host galaxy disk (shown in Figure 8 in grey scale and black contours) with the fitted 3DBAROLO model of a rotating disk (red contours, top panel). Along the kinematic major axis the 3DBAROLO model with the rotating disk fits fairly well the rotation curve of the host galaxy disk for projected radial distances . However it fails to reproduce it at radial distances from the nucleus of less than approximately 1″, where we find emission from forbidden velocities for a simple rotating disk. Along the kinematic minor axis of the host galaxy disk, again the 3DBAROLO rotating disk model reproduces only the observations outside the nuclear regions. However, at radial distances greater than 1″, we can clearly see the non-circular motions to the southwest and northeast parts of the galaxy, where we identified the strong mean-velocity residuals in Figure 7. Along this position angle the inflow appears to be stronger to the southwest of the AGN.
Figure 9 shows the same observed p-v diagrams along the kinematic major and minor axes of the host galaxy disk for the CO(3–2) transition at higher angular resolution (see Table 2). Qualitatively we observe the same evidence for non-circular motions along the kinematic minor axis of the host galaxy especially to the southwest of the AGN and as close as 0.5-0.7″ (projected distances 35-50 pc) from the AGN location (Figure 9, right panel). We can also see the clear kinematic decoupling of the nuclear emission in the p-v diagram along the major kinematic axis taking place at projected radial distances of less than .
As discussed in the Introduction, NGC 3227 presents a large scale stellar bar (Mulchaey et al., 1997) with a measured position angle of PA and a length greater than 80″. Based on the bar properties, Davies et al. (2014) used a hydrodynamical simulation developed by Maciejewski (2004) to illustrate the effects of the presence of a strong stellar bar in the gas kinematics of NGC 3227. They showed that the simulated line-of-sight velocity field reproduced well both the circular motions and the presence of streaming motions at the outer part of the ring, as observed in their H2 map and also our CO(2–1) map. The streaming motions are expected in and near the dust lanes entering the circumnuclear ring, which is exactly what we observe in our maps (see Figures 1 and 7).
Here we evaluate if the perturbation from a large scale bar alone is responsible for the CO(2–1) non-circular motions observed on different physical scales in NGC 3227. To do so, we used the same Maciejewski (2004) bar simulation (model termed 0S20r) used by Davies et al. (2014) and adapted it to the disk geometry fitted with 3DBAROLO. Then we smoothed it to the angular resolution of our ALMA CO(2–1) data (assuming a circular Gaussian with a FWHM of 0.2″) and scaled it to the observed velocities and derived . To compare with the observed CO(2–1) p-v diagrams, we extracted plots of the line-of-sight velocity against the distance from the center along the major and minor axes from the simulated velocity field of the gas. The comparison of Figure 10 and Figure 8 (top panels) shows that the bar simulation model is able to reproduce the line-of-sight velocity along the major axis as well as the streaming motions in regions along the minor axis at ″ to the northeast and southwest of the AGN (marked with the magenta rectangles in Figure 8). Since at these radial distances we are inside the large scale bar corotation, the streaming motions are associated with material inflowing near the leading edges of the bar. The bar model cannot, however reproduce the amplitude of the forbidden velocities along the major axis (marked with the blue rectangles in the left top panel of Figure 8).
Along the minor axis, the bar model cannot reproduce the strong non-circular motions in the nuclear region (). This finding is typical for the gas flow in barred potentials, which becomes close to circular inwards from the nuclear ring (e.g., Piner et al., 1995). In model 0S20r, in addition to the inflow along the bar, the bar triggers nuclear spiral shocks, which can be revealed in the line-of-sight velocity residuals (e.g., Storchi-Bergmann et al., 2007; Davies et al., 2009), and are manifested by the ”wiggles” at radial distances ″ in the nuclear region along the model minor axis p-v diagram (right panel of Figure 10). However, the amplitude of these residuals is not sufficient to explain the observed velocities along the minor axis of NGC 3227.
5.2 A nuclear warp?
Schinnerer et al. (2000) observed similar non-circular motions in the nuclear region of NGC 3227 using lower resolution CO(2–1) observations. They first attempted to model them with a nuclear bar but could not reproduce their observed p-v diagrams in the inner ″. They explored a second possibility using a circumnuclear disk that is warped at approximately radial distances of 0.7-1″ from the nucleus and it is orthogonal to the host galaxy plane in the innermost region. They found that this model reproduced better the CO(2–1) observations and the geometry would agree with that required from the kinematics of the ionized gas of NGC 3227. Indeed, Fischer et al. (2013) derived an angle between the axis of the ionization cone and the normal to the host galaxy disk of (Fischer et al., 2013). Therefore, this would also imply a drastic gradient of the axis of the rotating molecular gas as it approaches the nuclear collimating structure.
In this subsection we explore briefly with 3DBAROLO and our high angular resolution ALMA data the possibility of the presence of a nuclear warp. To do so, we took the initial model fitted with 3DBAROLO and refitted the nuclear region (radial distances of less than 1″) to allow for the presence of a slight geometric warp, in the sense of a small tilt between the inclination of the host galaxy and the nuclear region. This is because we do not know the scales on which this change of tilt happens, that is, whether on the scales probed by our ALMA CO(2–1) data or much further in. As before, we fixed the kinematic center and . For the nuclear warp we started with initial values of and PA. The change of almost 180° in the PA with respect to that of the host galaxy disk (that is, the twist) is necessary to fit the counterrotation seen in the nuclear region and to agree with the orientation of the nuclear CO(2–1) clumps (see Figure 5). Using these initial values we allowed 3DBAROLO to vary the nuclear and disk PA and inclination by . As can be seen from the second row of Figure 8, in the p-v diagram along the kinematic major axis the presence of a nuclear warp starts populating some of the forbidden velocities.
We run another 3DBAROLO model allowing for a more dramatic warp to make it consistent with the inclination of the collimating structure () for the ionization cone. In other words, we assume that the warp required takes place on the physical scales probed by our ALMA CO(2-1) data set. In this case we did not allow the nuclear PA and inclination to vary but kept them fixed (see Table 4 for a summary). The model p-v diagrams are rather similar (third row of Figure 8) to those of the slight warp. This suggests that with this data set we cannot determine the physical scales where this warp would be taking place. We note that the model with the slight warp appears to produce a marginally better fit to the nuclear region along the major axis. This is because the fitted velocity dispersion in the nuclear region for the slight warp goes up to values (but see Section 5.4) while the drastic warp model only fits values up to . The effects of the increased velocity dispersion in the models with the warp can also be seen in the p-v diagrams along the minor axis of the model when compared to the simple rotating disk. Even so, the nuclear warps cannot reproduce the strong non-circular motions to the northeast and southwest along the minor axis (which are also seen in the hot H2 gas velocity map in Figure 6) in the nuclear region.
5.3 Nuclear non-circular motions
The observed CO(3–2) p-v diagram along the minor axis of the nuclear disk (PA) in Figure 11 clearly shows non-circular motions. The deviations from circular motions reach line-of-sight velocities of (i.e., redshifted) to the northeast of the AGN out to a projected distance , and (i.e., blueshifted) to the southwest of the AGN at a similar distance. Therefore, these radial motions are observed to extend for approximately (pc) along the minor axis of the nuclear disk. These excess velocities with respect to a purely rotating nuclear disk are in agreement with the nuclear velocity residuals observed in hot molecular gas using the near-infrared H2 line by Davies et al. (2014).
To illustrate the effects of strong non-circular motions in the nuclear regions, as seen along the kinematic minor axis, we run another 3DBAROLO model again using the initial rotating disk model and including a radial velocity component in the nuclear region. Based on the deviations discussed above we fixed radial velocity component in the nuclear region () to (see Table 4). We allowed the rotational velocity and the velocity dispersion to vary, and left the other parameters fixed. The fitted model is shown in the fourth row of Figure 8. We can see that this model reproduces fairly well the p-v diagram along the minor axis and in the nuclear region, as can be seen more clearly when looking also at the right panel of Figure 11. We note that this is not the best fit to the data, as there are also inflowing motions near the nuclear region seen to the southwest and northeast of the AGN (see above). However, with 3DBAROLO we cannot include simultaneously at a particular radial distance radial velocity components with different signs. Thus we include the dominant radial component in the nuclear region, which produces a better fit to the nuclear part of the p-v diagram while keeping the fitted velocity dispersion relatively low (approximately ).
As a final 3DBAROLO model, we combine a nuclear warp with a radial component, with the parameters listed in Table 4. Visually this last model (Figure 8, 5th row) produces a better fit to p-v diagrams along both the major and minor axes than just having the nuclear warp or the radial component alone, respectively. Additionally it does not need large nuclear gas velocity dispersions at the transition region of the warp.
5.4 A nuclear molecular outflow
In the previous subsection we showed that non-circular motions along the minor axis of the galaxy are certainly detected within the central 1″, and more importantly along the minor axis. If we assume that these motions are in the plane of the putative nuclear disk (at ), then these motions would be interpreted as inflow. However, the inferred radial velocities (up to ) would be unrealistically high for a nuclear inflow. For instance, the hydrodynamical simulations run to fit the observations of the low luminosity AGN NGC 1097 required radial flows of the order of (Davies et al., 2009). Even in the presence of a nuclear bar, the inflow velocities are expected to be a fraction of the circular velocity (Haan et al., 2009), so it is unlikely that these radial velocities would be associated with nuclear inflows.
Alternatively, we can assume that the radial motions are taking place in the plane of the host galaxy disk, as they appear further away from the nuclear disk as seen from the projected vertical size of the m continuum map (see Figure 11). In this case the non-circular motions would imply a nuclear molecular gas outflow possibly due to molecular gas in the disk of the galaxy being swept by the AGN wind. This has been observed in other nearby AGN, for instance, NGC 1068 (García-Burillo et al., 2014) and IC 5063 (Morganti et al., 2015). The observations would imply an outflow on physical scales of 70 pc with a maximum velocity of . This velocity is consistent with the molecular outflows observed in a few Seyfert galaxies with similar AGN bolometric luminosities (see Fiore et al., 2017, for a compilation), although these are generally detected much further away from the AGN (several hundreds of parsecs). On nuclear scales they are similar to those identified by Davies et al. (2014) with the near-infrared H2 line in NGC 3227 and other Seyferts.
The CO(3–2) total intensity map of the nuclear region (Figure 5) shows that the emission is not symmetric around the AGN location. Especially along the minor axis, the kinematics reveals a cavity like structure (Figure 11) which can be seen also from the CO intensity maps and even better from the hot molecular gas map in Figure 6. It thus appears that in the region immediately southwest of the AGN the molecular gas and possibly the dust are being more efficiently hollowed out, although not completely emptied, by the AGN wind and/or jet, as also observed in NGC 1068 (see Müller Sánchez et al., 2009; García-Burillo et al., 2014, and 2019 in preparation). This would explain why in this region the spectral index between Band 6 and Band 7 (see Figure 3) appears to be mostly synchrotron-like emission whereas the region northeast of the AGN shows evidence of both thermal and non-thermal emission. We also note that the nuclear outflow coincides with a region with strong evidence for the presence of shocks/outflow based on near-infrared [Fe ii] observations (Schönell et al., 2019).
6 Nuclear molecular gas mass and column density
We measured the CO(2–1) and CO(3–2) line intensities over the nuclear region with a square aperture of centered at the AGN position (see Table 3). We can use the CO(2–1) measurement to estimate the molecular gas mass in this region. We take a CO(1–0)/CO(2–1) brightness temperature ratio of one, assuming a thermally excited and optically thick gas (Braine & Combes, 1992) and use the relation of Sakamoto et al. (1999) with a Galactic CO-to-H2 conversion factor (K km s*-1*)-1. We obtained a molecular gas mass in the inner 15 pc of approximately .
Sani et al. (2012) detected HCN emission using observations with an approximate resolution. The HCN transition peaks at the AGN position of NGC 3227, thus indicating that there is dense molecular gas. In this case, we would need to assume a brightness temperature ratio for the CO(1-0) and CO(2-1) transitions which is more appropriate for these gas conditions in the nuclear region. Viti et al. (2014) measured a (2–1) to (1–0) brightness temperature ratio of approximately 2.5 at the AGN location in NGC 1068. They also demonstrated that the observed suite of molecular gas transitions at the AGN location of NGC 1068 can be modelled with dense ) and hot (K) gas. If the gas conditions in the nuclear region of NGC 3227 are similar to those in NGC 1068, then the derived mass of molecular gas (as well as the column density, see below) in the nuclear region should be taken as an upper limit. This is just due to the higher CO(2–1) to CO(1–0) ratio assumed for the calculation.
The nuclear molecular gas mass of NGC 3227 is similar to that of the low-luminosity AGN NGC 1097 (Izumi et al., 2017) but smaller than the typical values measured by Combes et al. (2019) for low-luminosity AGN and other Seyferts (Alonso-Herrero et al., 2018; Izumi et al., 2018). However, it agrees remarkably well with the torus gas mass derived from SED fits of near and mid-IR emission (see García-Bernete et al., 2019). If we use a square aperture , which would encompass the nuclear disk identified from the m continuum (Sections 3.1 and 3.2), we derived a mass in molecular gas of which agrees well with the typical values for other nearby AGN. If we use the CO(3–2) measurement for this 0.5″ aperture and the expressions used by Combes et al. (2019), we would derive , which includes helium. For reference the molecular gas mass estimates in the central are in the range (Davies et al., 2006; Hicks et al., 2009), using the dynamical mass based on the near-infrared H2 line and assuming a gas mass fraction of 10%.
From the CO(2–1) measurement in the nuclear region we derive an average H2 column density towards the AGN location (inner pc) of approximately or a factor of two lower if there are significant amounts of dense molecular gas in the nuclear region. This value would appear to be high considering that NGC 3227 is optically classified as a Seyfert 1.5. However, X-ray, UV and optical studies have shown plenty of evidence for the presence of different absorbers toward the AGN line-of-sight, including a dusty warm absorber, lukewarm absorbers and cold absorbers (see e.g. Komossa & Fink, 1997; Crenshaw et al., 2001, and references therein). Moreover, this complex X-ray absorption is also variable (see e.g. Turner et al., 2018). . Recently, Beuchert et al. (2015) derived column densities for the ionized absorbers of . They also discussed that the absorbers could be part of an overall clumpy medium located in the outermost dust free broad line region or the inner part of the dusty torus.
7 Discussion and Conclusions
We have presented ALMA Band 6 and Band 7 observations of the molecular gas using the CO(2–1) and CO(3–2) transitions and their associated continua of the nuclear and circumnuclear regions of the nearby Seyfert 1.5 galaxy NGC 3227. The ALMA observations have angular resolutions between 0.085 and 0.21″, which for this galaxy correspond to physical resolutions in the range 7-15 pc. With these observations we have studied in detail the molecular gas morphology and kinematics as well as the (sub)millimeter continuum emission. Figure 12 summarizes our results.
From a morphological point of view, the ALMA continuum emission at 1.3 mm and m in the innermost pc shows an unresolved component —likely to be associated with the AGN itself— as well as extended components. One extended component is along the projected direction of the ionization cone axis () and the other along the position of the nuclear star-forming disk () identified with near-infrared observations (Davies et al., 2006). We show them in the cartoon in the right panel of Figure 12. In the direction of the ionization cone axis the spectral index between the two ALMA bands shows mostly positive values toward northeast of the AGN and negative values to the southwest. For the latter we can conclude that the ALMA continuum emission is dominated by synchrotron emission likely associated with a putative radio jet. Along the nuclear disk extension we derive spectral indices from slightly negative to positive values consistent with a combination of thermal emission from cold dust and free-emission from H ii regions and non-thermal emission due to the AGN.
Our analysis of the nuclear radio-to-infrared SED of NGC 3227 shows that the ALMA continuum at 1.3 mm and m could be produced by a combination of different physical processes, as found for other nearby Seyferts (Krips et al., 2011; García-Burillo et al., 2014; Pasetto et al., 2019). In particular, the extrapolation to the far-infrared of the Nenkova et al. (2008a, b) clumpy torus model fit to the infrared emission would only account for a small fraction of the observed m flux measured over 0.2″ (15 pc). This could be due to a significant contribution from star formation to the sub-mm emission in the nuclear region.
The exquisite ALMA angular resolution reveals the distribution of the molecular gas in the nuclear and circumnuclear regions, with the presence of a ring-like morphology (diameter of pc), previously identified by Schinnerer et al. (2000). The overall (FoV) kinematics of the CO(2–1) line shows circular motions consistent with those derived from the stellar kinematics (Davies et al., 2006; Barbosa et al., 2009). We also detect strong streaming motions (inflow) near the outer edges of the ring to the southeast and northwest of the AGN (at projected radial distances ) which can be explained with the presence of a large scale bar (Mulchaey et al., 1997; Davies et al., 2014). These streaming motions appear to continue inwards to regions as close as from the AGN.
In the innermost regions, the CO(2–1) and CO(3–2) maps show a number of clumps with a morphology similar to that of the hot molecular gas traced by the near-infrared H2 line (Davies et al., 2006). None of the CO or H2 peaks coincide with the AGN location (see Figures 5 and 6), assumed to correspond with the position of the unresolved 1.3 mm emission. However, we also showed that the extended 1.3 mm and m emission in the nuclear region traces well the distribution of the molecular gas. The nuclear region (inner pc) has extremely complicated kinematics with strong deviations from pure rotating motions along the kinematic major and minor axes. We explored the possibility of a nuclear warp which would be required to explain the angle between the axis of the cone and the normal to the galaxy plane of (Fischer et al., 2013). Although we cannot conclusively demonstrate the presence of a nuclear warp, a significant change of tilt between the host galaxy and the region collimating the ionization cone needs to happen in the inner 1″.
Both the CO(2–1) and the CO(3–2) transitions show strong non-circular motions along the minor kinematic axis in the nuclear region (Figures 8 and 11). They reach maximum velocities of (inclination corrected values) which are blueshifted to the southwest of the AGN and redshifted to the northeast (see also the cartoon in the right panel of Figure 12). These motions were well reproduced with 3DBAROLO by adding a nuclear radial velocity component to the host galaxy rotating disk. Assuming that they are in the plane of the host galaxy disk, then we can interpret them as due to a nuclear molecular outflow over scales of approximately 70 pc. The molecular gas outflow velocities are smaller than those derived from the ionized gas using the H and [S iii]9069 emission lines, which in this region reach maximum values of and , respectively (Fischer et al., 2013; Barbosa et al., 2009). This is understood if the molecular outflow in NGC 3227 is due to gas in the host galaxy entrained by the faster AGN wind.
Morphologically and kinematically the AGN wind appears to have excavated the molecular gas and possibly the dust in regions close to the AGN. This created a cavity-like structure, which is more apparent to the southwest of the AGN (see Figure 5 and especially Figure 6) that is similar to that observed in NGC 1068 (see Müller Sánchez et al., 2009; García-Burillo et al., 2014, and 2019). We can estimate the nuclear outflow rate on both sides of the AGN along the minor axis taking expression given in equation 4 of García-Burillo et al. (2014): for a multi-conical outflow uniformly filled by the outflowing clouds. We measured the CO(2-1) fluxes in square apertures of 0.2″ on a side just outside of the central AGN position and estimate molecular gas masses (following the same assumptions as in Section 6) of and to the northeast and southwest of the AGN, respectively. For the outflow velocity we take a typical value of and a size for the outflow of pc. This results in nuclear molecular outflow rates of and to the northeast and southwest of the AGN. These values are about an order of magnitude lower than the molecular outflow rate at the circumnuclear disk of NGC 1068 (García-Burillo et al., 2014) but comparable to that measured for NGC 1433 (Combes et al., 2013).
At the AGN position and with our angular resolution, this region is not entirely devoid of molecular gas. We estimated a mass in molecular gas of (for a square aperture 0.2″15 pc on a side) and an equivalent average column density of at the AGN position. However, if the molecular gas at the AGN location is dense and relatively hot as in NGC 1068, the derived molecular gas mass and column densities would be approximately a factor of two lower. The lower values are due to the higher CO(2–1) to CO(1–0) ratio observed in the nuclear region of NGC 1068 compared to the typical ratios observed in the disks of galaxies. Nevertheless, although NGC 3227 is classified as a Sy1.5, there is evidence of a gas-rich nuclear/circumnuclear environment. This agrees with the weak relationship between the circumnuclear (kpc) and nuclear (tens of parsecs) molecular gas mass and the X-ray column density in nearby AGN (see Rosario et al., 2018; Combes et al., 2019, respectively) and implies that the molecular gas has a low filling factor. As a quick estimation, the gas mass and size of the region give an average filling factor of molecular gas, assuming a density of cm*-3*, of , or a % chance that a given line-of-sight will not intersect a molecular clump. In this sense, it is not surprising that the AGN is partially unobscured.
In summary, the nuclear CO(2–1) , CO(3–2) and dust morphology of NGC 3227 do not resemble a classical compact torus. Rather, the dust and molecular gas emission is in a nuclear disk extended over several tens of parsecs. The orientation of the nuclear disk is consistent with being part of the collimating structure of the ionization cone. We find evidence that the dust might be heated not only by the AGN but also by the nuclear on-going/recent star formation activity (Davies et al., 2006; Esquej et al., 2014). In the CO(2–1) and CO(3–2) transitions we do not observe a bright and isolated nuclear structure/torus, but several clumps well connected with the circumnuclear ring in the host galaxy disk. In this situation it is difficult to say where the torus starts, although such molecular gas morphologies are also common in other AGN of similar or lower luminosity (Izumi et al., 2017, 2018; Alonso-Herrero et al., 2018; Combes et al., 2019).
Acknowledgements.
We are grateful to an anonymous referee for constructive comments which helped improve the manuscript. We thank Luis Colina, Alvaro Labiano, Leonard Burtscher and Daniel Asmus for useful discussions. A.A.-H. and I.G.-B. acknowledge support from the Spanish Ministry of Science, Innovation and Universities through grant AYA2015-64346-C2-1-P, which was party funded by the FEDER program. A.A.-H. also acknowledges CSIC grant PIE201650E36. A.A.-H., S.G.-B. and A.U. acknowledge support from the Spanish Ministry of Science, Innovation and Universities through grant PGC2018-094671-B-I00, which was party funded by the FEDER program. S.G.-B. and C.R.A. acknowledge the Spanish Plan Nacional de Astronomía y Astrofísica under grant AYA2016-76682-C3-2-P. M.P.-S. and D.R. acknowledge support from STFC through grant ST/N000919/1. T.D.-S. acknowledges support from ALMA-CONICYT project 31130005 and FONDECYT regular project 1151239. S.F.H. is supported by European Research Council Starting Grant ERC-StG-677117 DUST-IN-THE-WIND. C.R.A. also acknowledges the Ramón y Cajal Program of the Spanish Ministry of Science and Technology through project RYC-2014-15779. S.R. and M.V. gratefully acknowledge support from the Independent Research Fund Denmark via grant numbers DFF 4002-00275 and 8021-00130. L.K.H. acknowledges funding from the INAF PRIN-SKA 2017 program 1.05.01.88.04. C.R. acknowledges support from the CONICYT+PAI Convocatoria Nacional subvencion a instalacion en la academia convocatoria año 2017 PAI77170080. D.R. acknowledges the support of the Science and Technology Facilities Council (STFC) through grant ST/P000541/1. AU acknowledges support from the Spanish MINECO grants ESP2015-68964 and AYA2016-79006. This paper makes use of the following ALMA data: ADS/JAO.ALMA.2016.1.00254.S and JAO.ALMA.2016.1.01236.S. ALMA is a partnership of ESO (representing its member states), NSF (USA) and NINS (Japan), together with NRC (Canada), MOST and ASIAA (Taiwan), and KASI (Republic of Korea), in cooperation with the Republic of Chile. The Joint ALMA Observatory is operated by ESO, AUI/NRAO and NAOJ. Based on observations made with the NASA/ESA Hubble Space Telescope, obtained from the data archive at the Space Telescope Science Institute. STScI is operated by the Association of Universities for Research in Astronomy, Inc. under NASA contract NAS 5-26555.
The reference list from the paper itself. Each links out to its DOI / PubMed record.
- 1Alonso-Herrero et al. (2016) Alonso-Herrero, A., Esquej, P., Roche, P. F., et al. 2016, MNRAS, 455, 563
- 2Alonso-Herrero et al. (2018) Alonso-Herrero, A., Pereira-Santaella, M., García-Burillo, S., et al. 2018, Ap J, 859, 144
- 3Antonucci (1993) Antonucci, R. 1993, ARA&A, 31, 473
- 4Antonucci & Miller (1985) Antonucci, R. R. J. & Miller, J. S. 1985, Ap J, 297, 621
- 5Asmus et al. (2016) Asmus, D., Hönig, S. F., & Gandhi, P. 2016, Ap J, 822, 109
- 6Barbosa et al. (2006) Barbosa, F. K. B., Storchi-Bergmann, T., Cid Fernandes, R., Winge, C., & Schmitt, H. 2006, MNRAS, 371, 170
- 7Barbosa et al. (2009) Barbosa, F. K. B., Storchi-Bergmann, T., Cid Fernandes, R., Winge, C., & Schmitt, H. 2009, MNRAS, 396, 2
- 8Baumgartner et al. (2013) Baumgartner, W. H., Tueller, J., Markwardt, C. B., et al. 2013, Ap JS, 207, 19