Ultimate Merging at z~0.1
Daniel Maschmann, Anne-Laure Melchior

TL;DR
This study investigates 58 double-peaked emission line galaxies, revealing their likely merging stages, morphological features, and star formation activity, challenging simple rotation or outflow explanations.
Contribution
It provides new insights into the merging processes and characteristics of double-peaked emission galaxies, especially the high fraction of S0 types and their morphological and spectral features.
Findings
66% of galaxies have off-centered suppressed components
Approximately half of the sample are S0 galaxies
Galaxies are massive, star-forming, with signs of merging or post-merger stages
Abstract
We present a study of 58 double-peaked emission line galaxies for which one of the components is suppressed in [OIII]5008 or significantly weaker than the other one. Accordingly, the two components are classified differently in the BPT diagram. We show that the strong [OIII] component coincides with the stellar velocity and the suppressed component is off-centred in 66% of the galaxies, while in 12% of them it is the opposite. The analysis of their morphology reveals that about half of the sample is composed of S0, the rest is composed in equal part of mergers and late-type galaxies. We discuss that these characteristics exclude rotating discs and suggest different stages of merging. It is possible that the number of mergers is underestimated if the double nuclei are not resolved. Tidal features are detected in the outskirts of some S0 galaxies. This high fraction of S0 is surprising,…
Click any figure to enlarge with its caption.
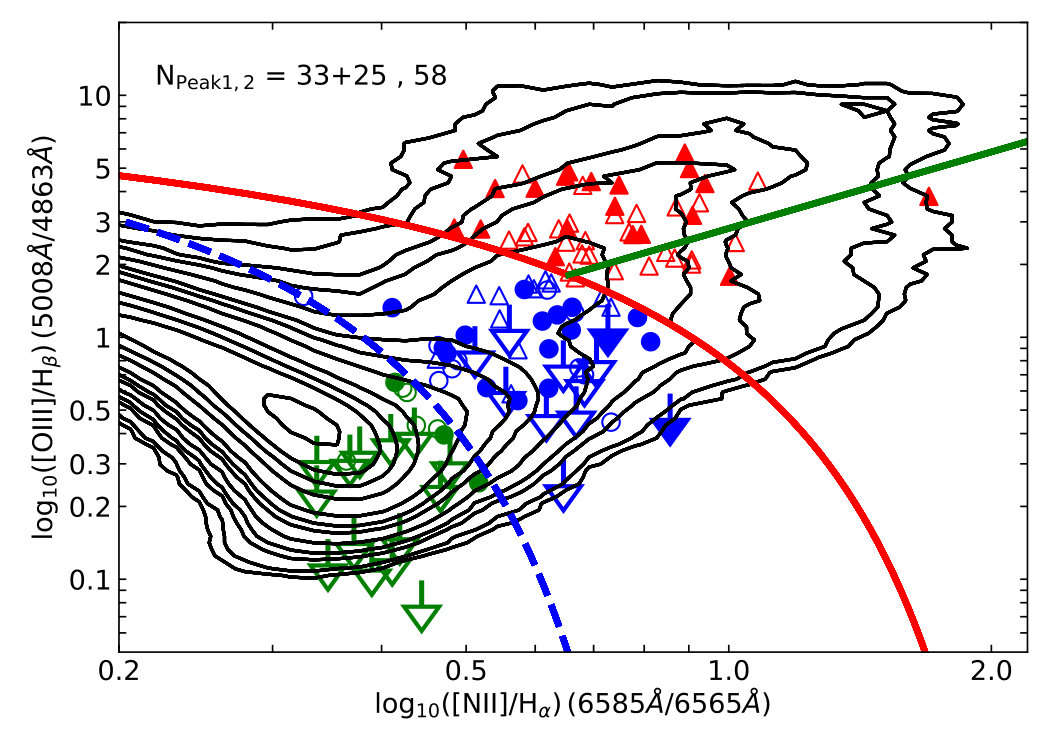 Figure 1
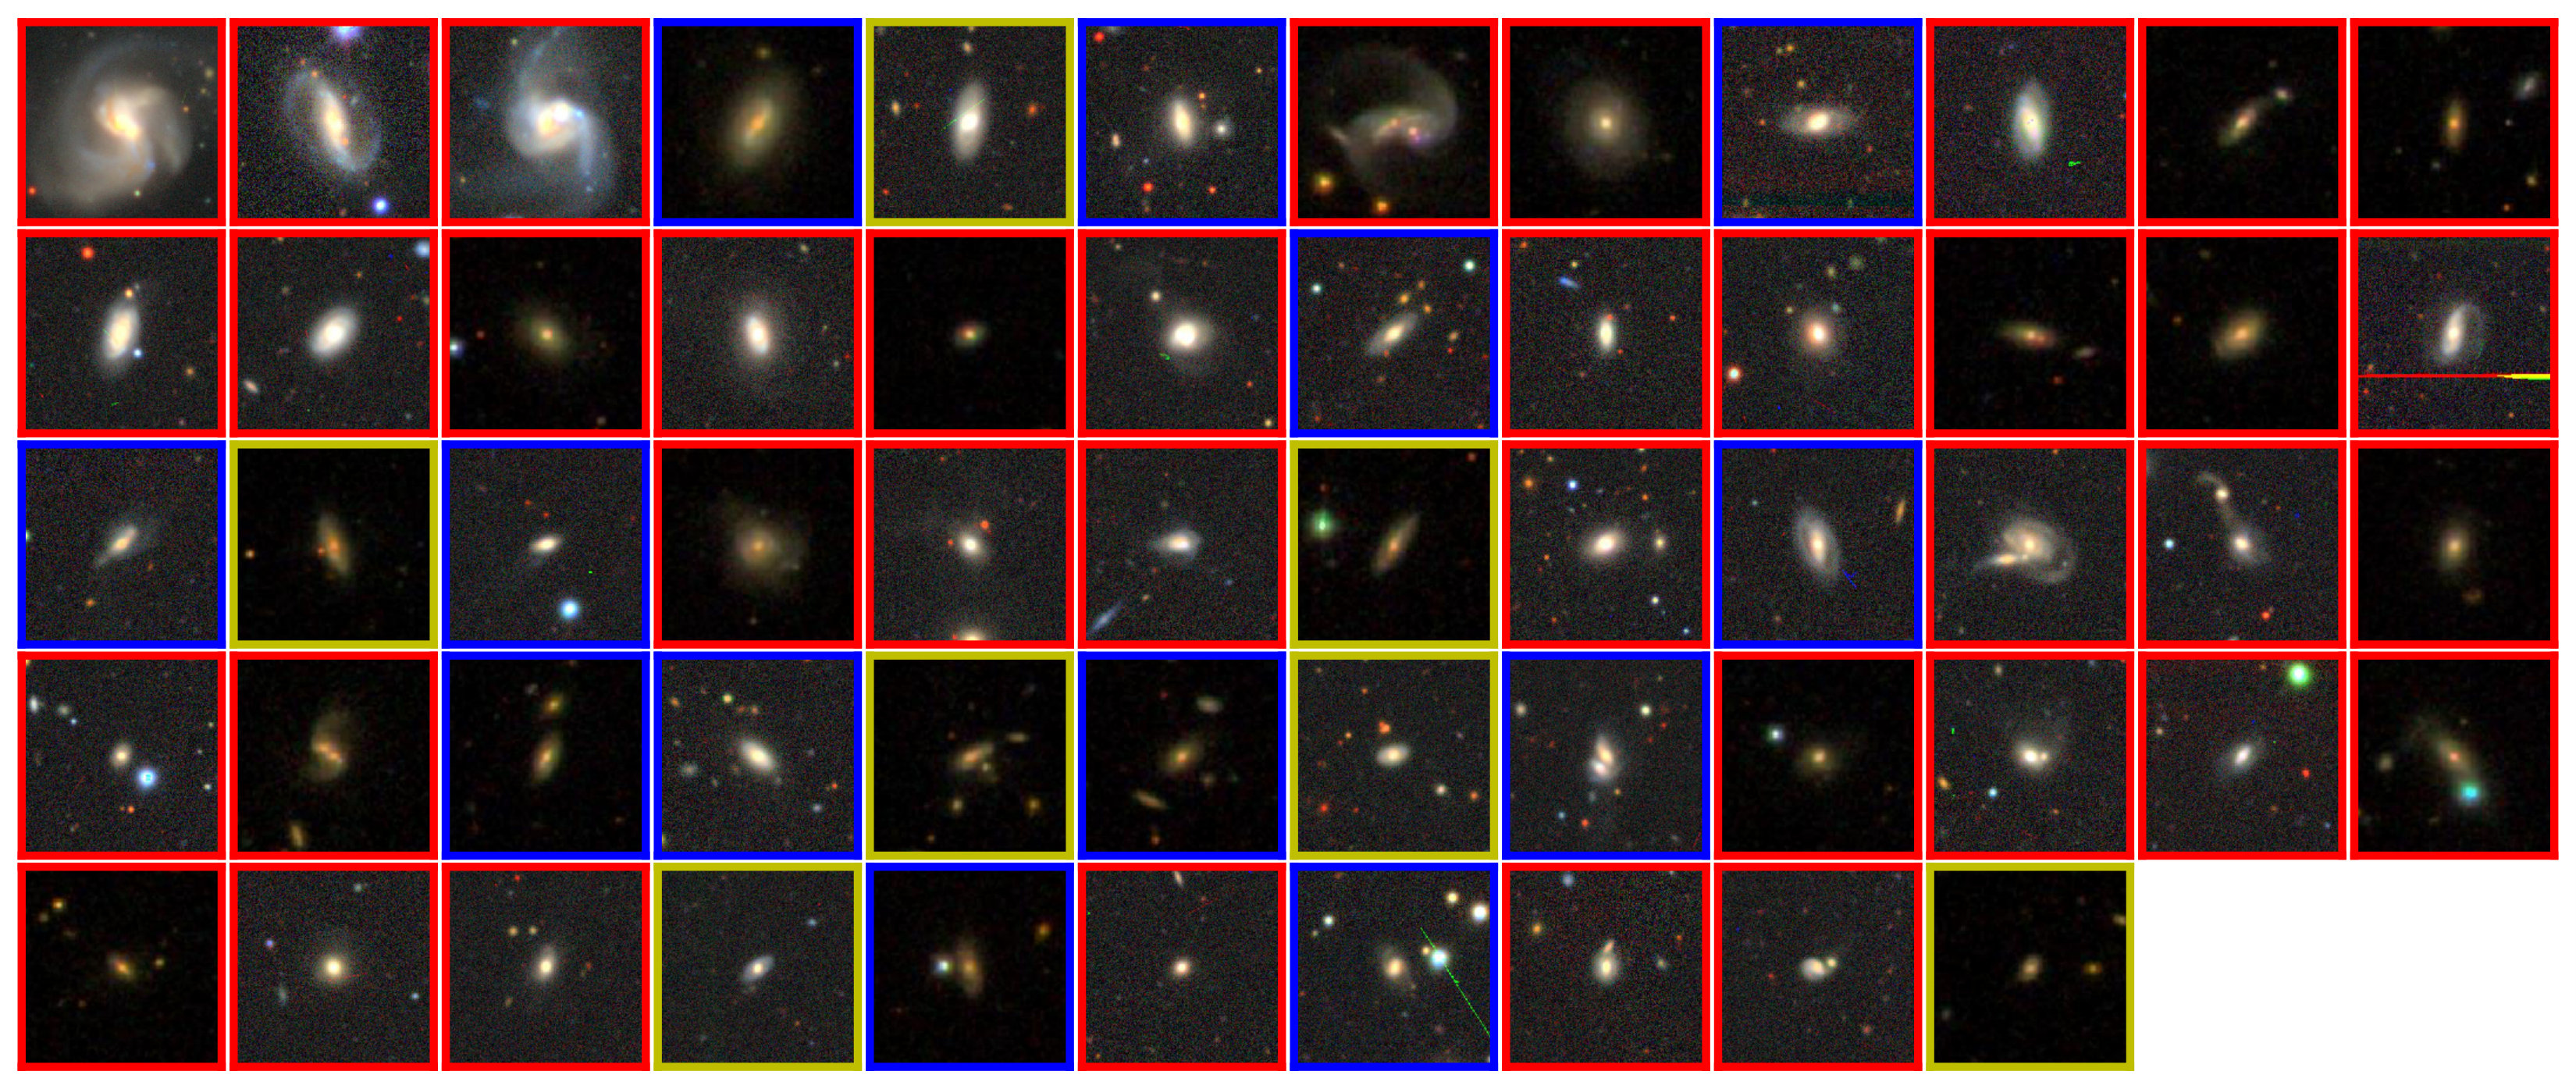 Figure 2
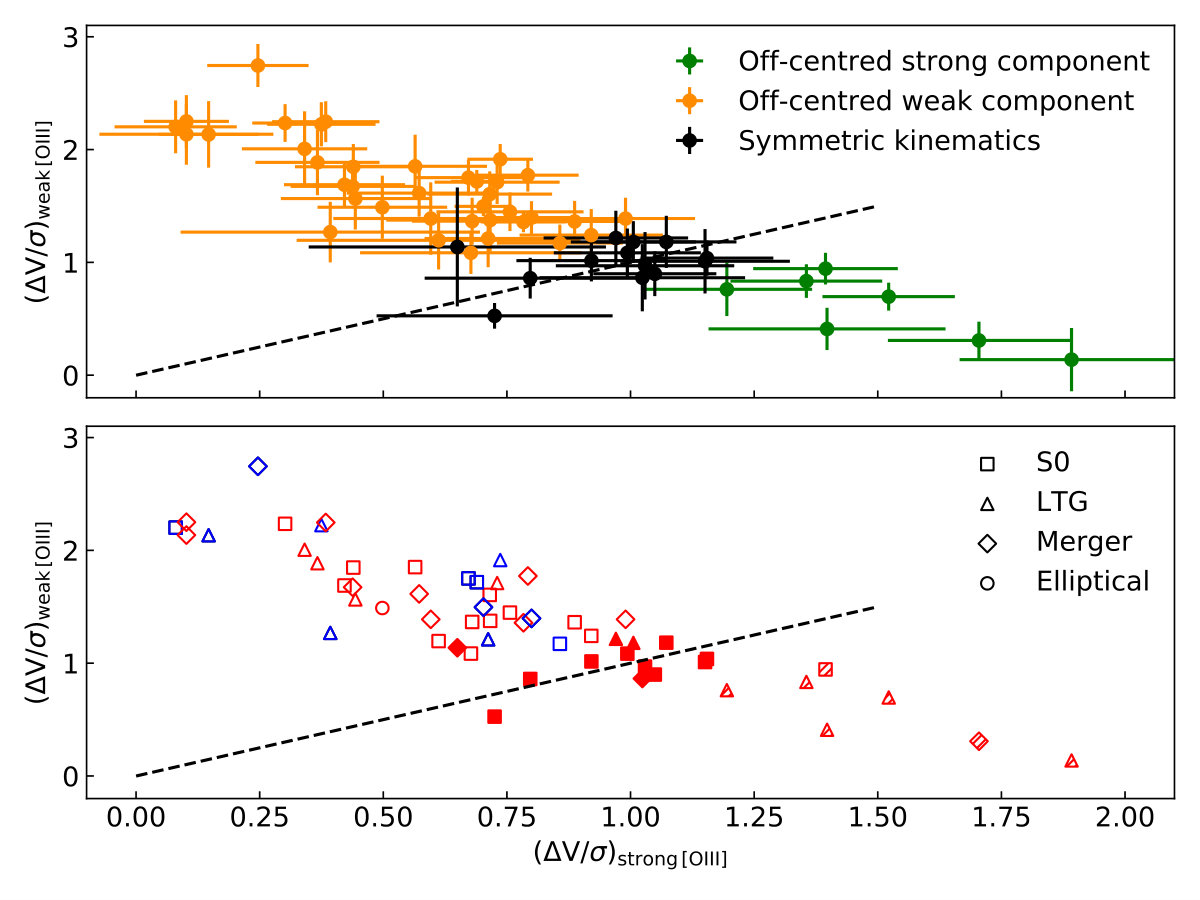 Figure 3
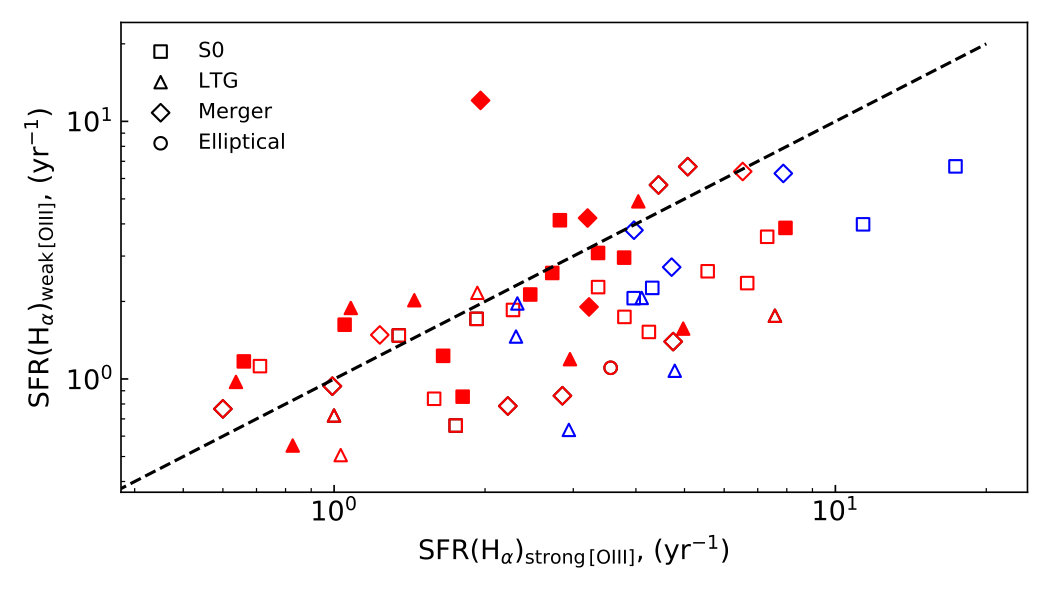 Figure 4
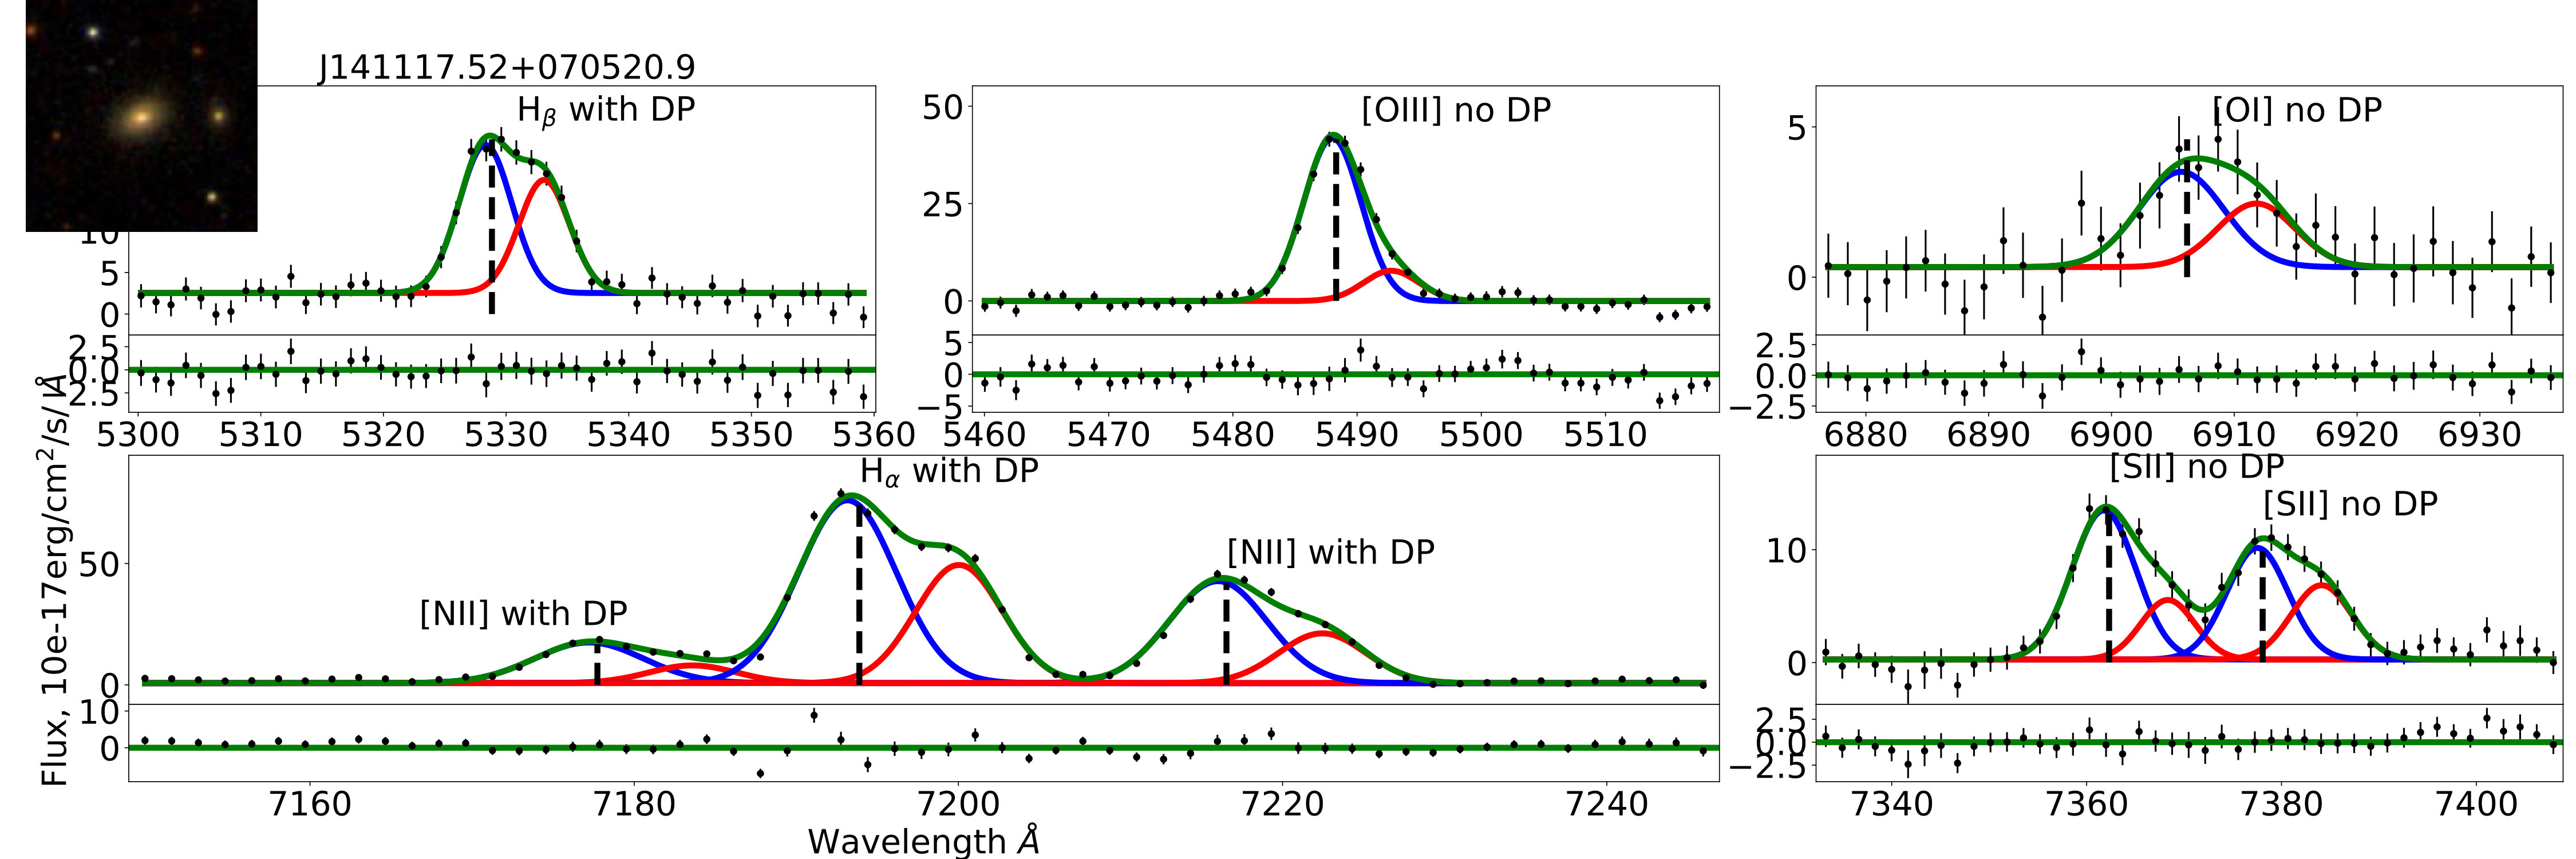 Figure 5
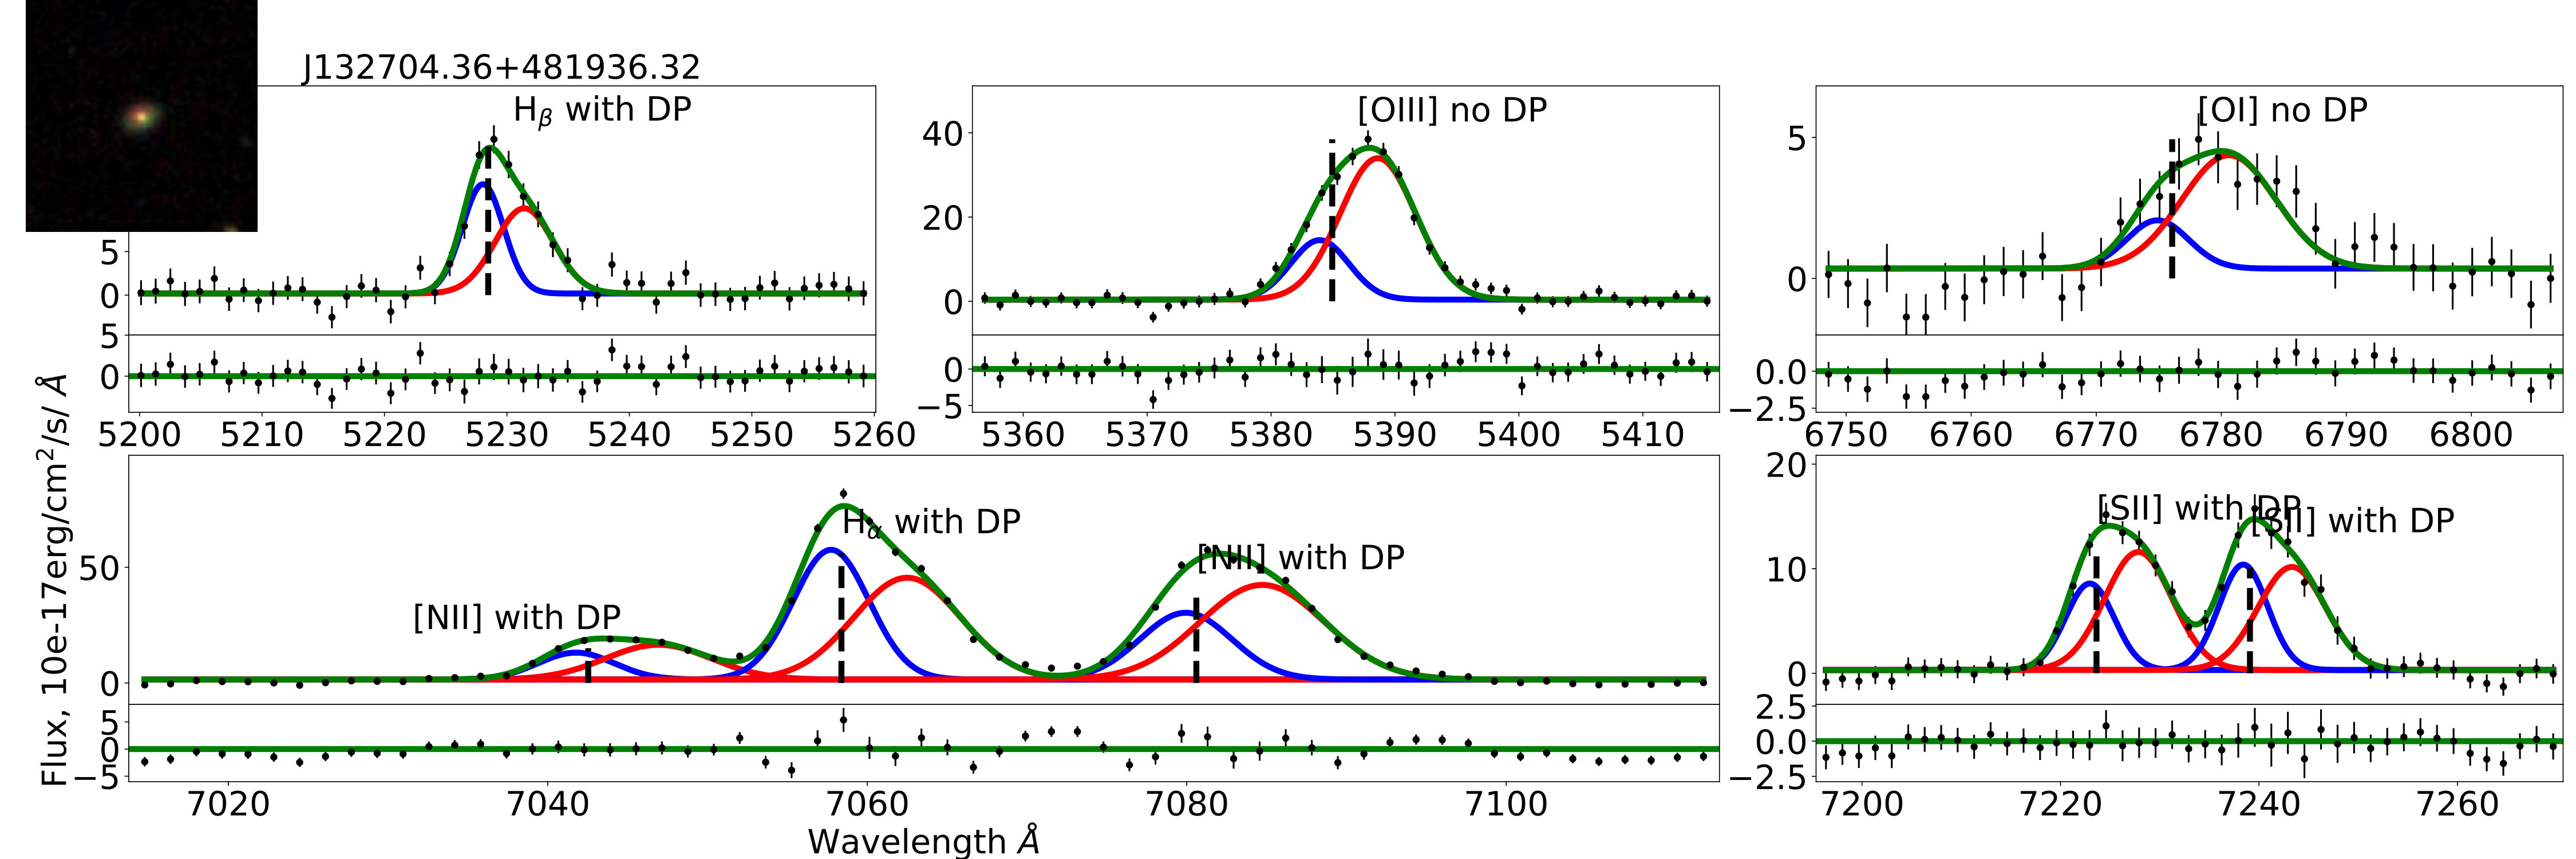 Figure 6
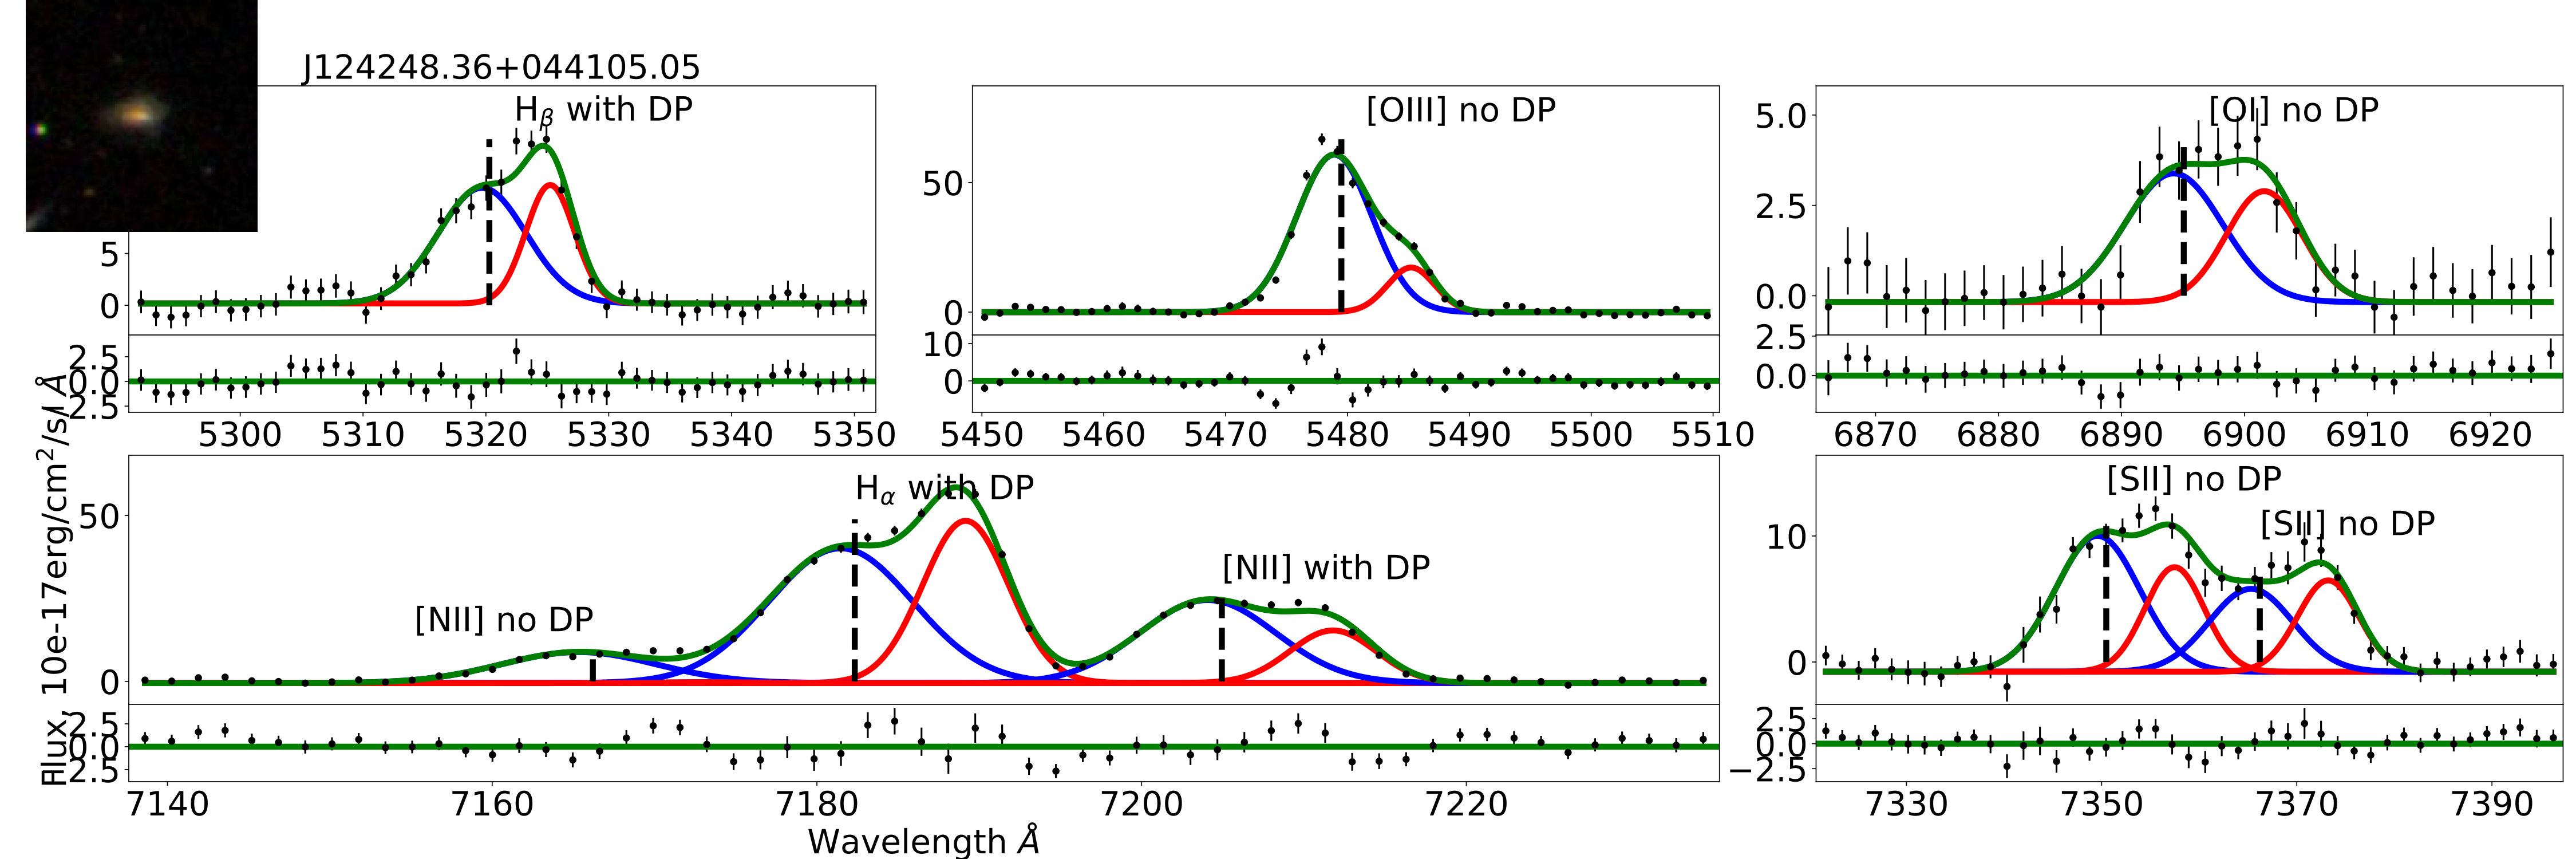 Figure 7
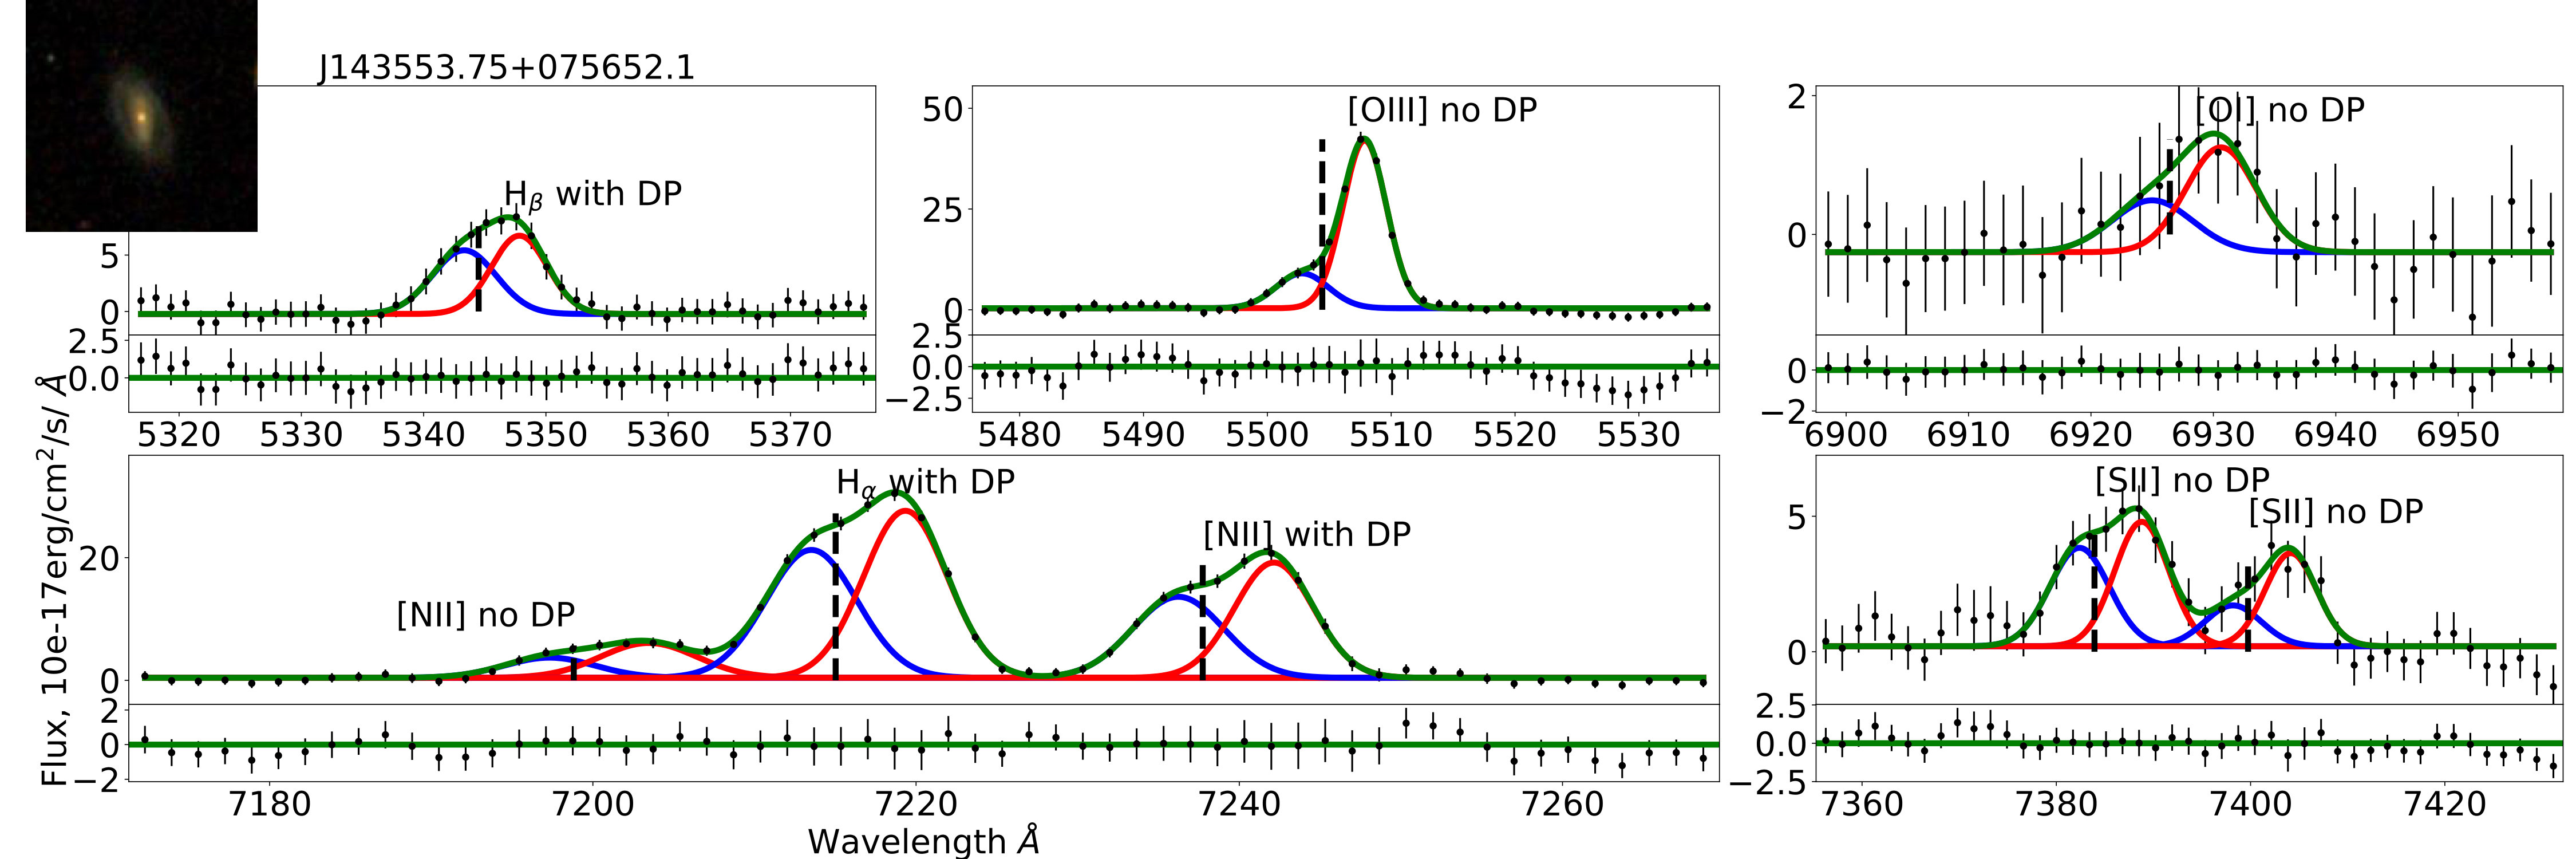 Figure 8
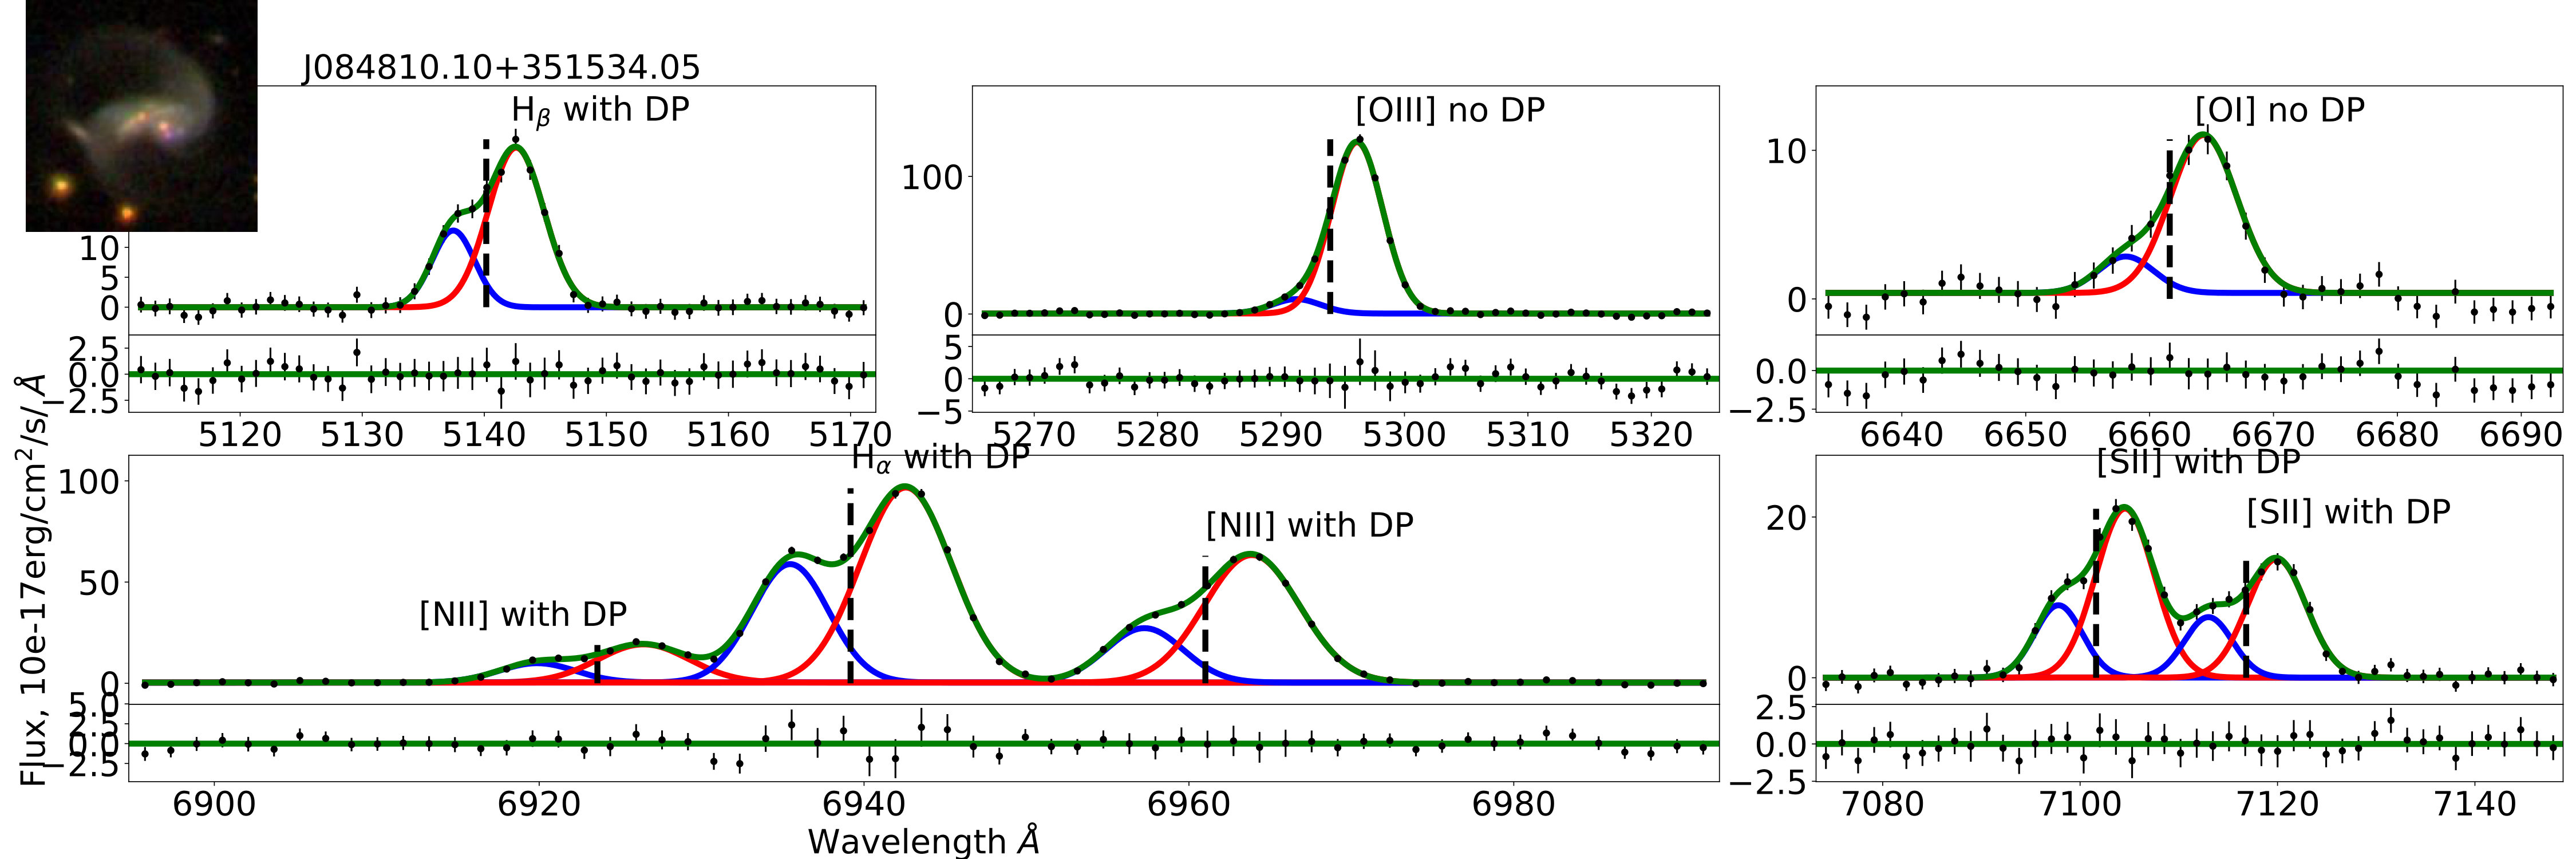 Figure 9
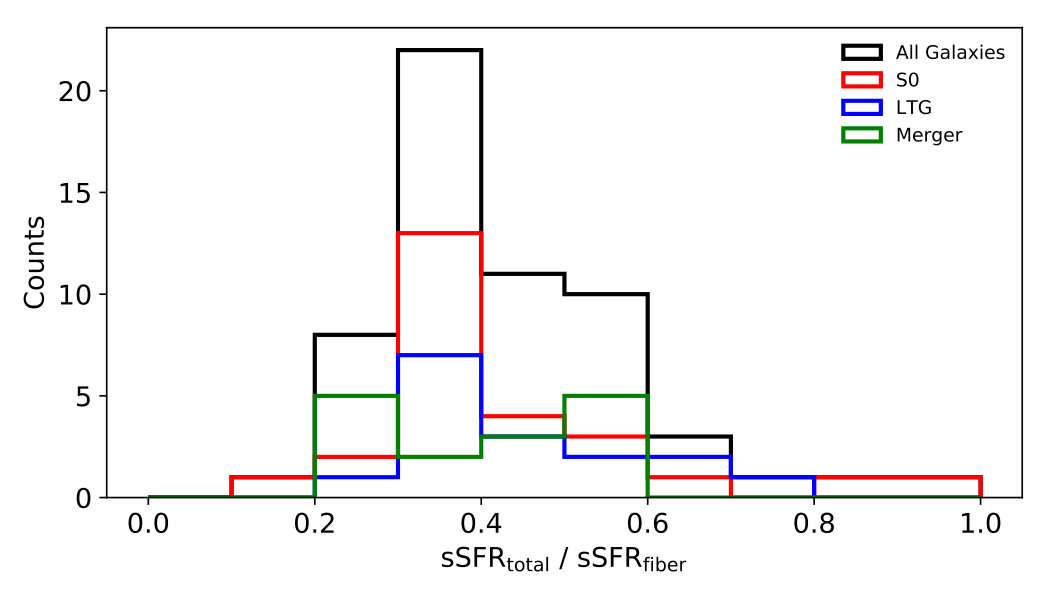 Figure 10
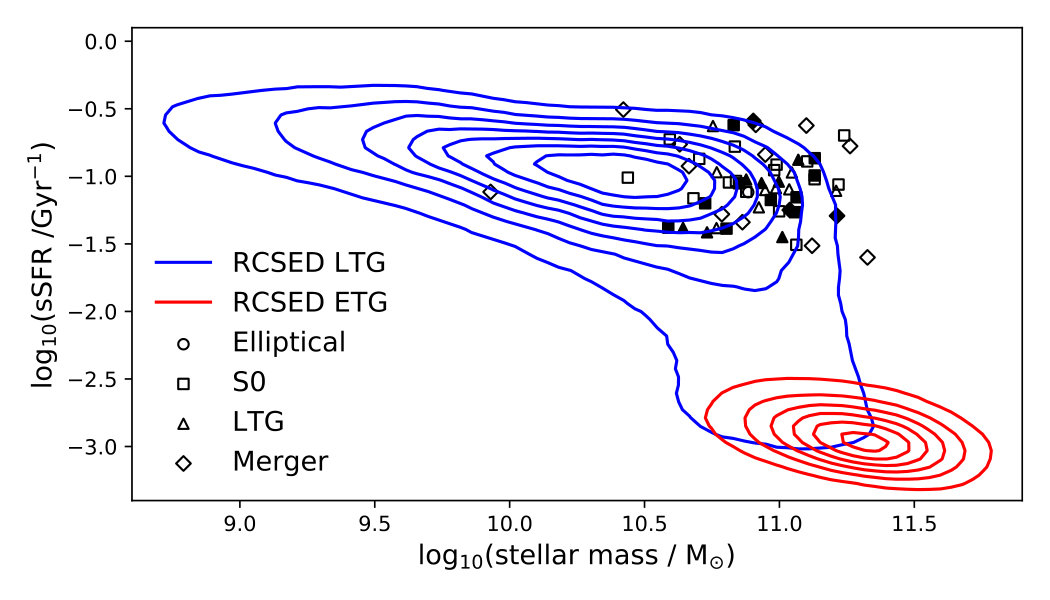 Figure 11
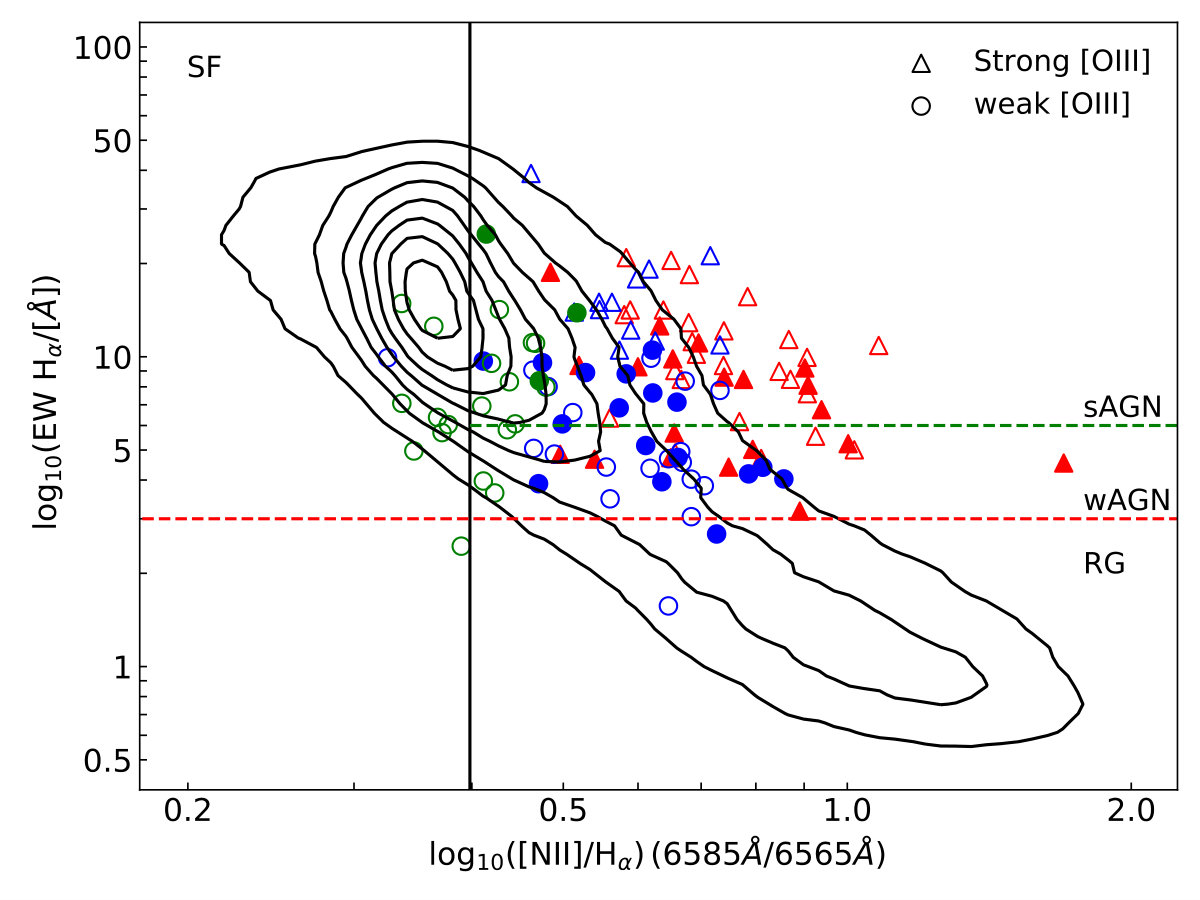 Figure 12
| ID | Designation | z | Morph | BPT | BPT | WHAN | WHAN | Kin | Ng | |
|---|---|---|---|---|---|---|---|---|---|---|
| (1) | (2) | (3) | (4) | (5) | (6) | (7) | (8) | (9) | (10) | (11) |
| 1 | J154403.67+044610.08 | 0.042 | Merger | LINER | SF | sAGN | sAGN | off-w | 4 | |
| 2 | J075416.45+200136.32 | 0.046 | LTG | COMP | SF | sAGN | SF | off-w | 2 | |
| 3 | J091954.54+325559.79 | 0.049 | Merger | COMP | SF | sAGN | SF | off-w | 0 | |
| 4 | J142859.54+605000.58 | 0.052 | S0 | LINER | COMP | wAGN | wAGN | cen | 1 | |
| 5 | J143555.01+103117.22 | 0.055 | LTG | AGN | COMP | wAGN | wAGN | off-s | 1 | |
| 6 | J143454.41-011618.06 | 0.056 | S0 | AGN | COMP | sAGN | wAGN | cen | 1 | |
| 7 | J084810.10+351534.05 | 0.057 | Merger | AGN | COMP | sAGN | sAGN | off-w | 0 | |
| 8 | J120923.63+620955.96 | 0.060 | S0 | LINER | COMP | wAGN | wAGN | off-w | 1 | |
| 9 | J233141.99-103206.95 | 0.061 | S0 | LINER | COMP | wAGN | wAGN | cen | 1 | |
| 10 | J001119.84-093940.57 | 0.062 | LTG | AGN | SF | sAGN | RG | off-w | 1 | |
| 11 | J083515.21+511732.70 | 0.067 | Merger | AGN | SF | sAGN | sAGN | off-w | 1 | |
| 12 | J153556.76-013749.17 | 0.070 | S0 | AGN | COMP | sAGN | wAGN | off-w | 1 | |
| 13 | J095600.70+130806.78 | 0.070 | LTG | COMP | SF | sAGN | SF | off-w | 2 | |
| 14 | J110233.35+224513.71 | 0.074 | LTG | LINER | COMP | wAGN | RG | off-w | 1 | |
| 15 | J164754.90+443345.05 | 0.074 | S0 | COMP | SF | sAGN | sAGN | off-w | 4 | |
| 16 | J142457.53+241517.82 | 0.075 | S0 | AGN | COMP | wAGN | wAGN | off-w | 2 | |
| 17 | J132704.36+481936.32 | 0.076 | S0 | AGN | COMP | sAGN | sAGN | off-w | 1 | |
| 18 | J142606.64+202831.56 | 0.077 | Merger | COMP | SF | sAGN | SF | off-w | 4 | |
| 19 | J081204.73+171703.77 | 0.081 | S0 | AGN | COMP | sAGN | sAGN | cen | 1 | |
| 20 | J121446.40+013547.43 | 0.083 | S0 | AGN | COMP | wAGN | wAGN | off-w | 1 | |
| 21 | J015415.01+144716.78 | 0.084 | Ellip | AGN | COMP | sAGN | wAGN | off-w | 1 | |
| 22 | J165253.53+324440.29 | 0.086 | Merger | AGN | COMP | sAGN | wAGN | off-w | 2 | |
| 23 | J090012.03+450514.82 | 0.088 | S0 | COMP | SF | sAGN | SF | off-w | 27 | |
| 24 | J073420.09+284038.96 | 0.089 | LTG | COMP | SF | sAGN | sAGN | off-w | 1 | |
| 25 | J093805.80+270456.72 | 0.090 | LTG | AGN | COMP | sAGN | sAGN | cen | 1 | |
| 26 | J131943.32+515255.83 | 0.090 | LTG | AGN | COMP | sAGN | sAGN | off-s | 2 | |
| 27 | J075932.35+193325.57 | 0.093 | S0 | AGN | COMP | wAGN | RG | cen | 1 | |
| 28 | J143035.27+443825.35 | 0.093 | LTG | COMP | SF | sAGN | wAGN | off-w | 1 | |
| 29 | J154124.59+271508.18 | 0.094 | S0 | LINER | COMP | sAGN | wAGN | off-w | 1 | |
| 30 | J124248.36+044105.05 | 0.094 | LTG | AGN | COMP | sAGN | SF | off-w | 1 | |
| 31 | J100759.81+630128.97 | 0.095 | LTG | AGN | COMP | wAGN | sAGN | off-s | 1 | |
| 32 | J141117.52+070520.89 | 0.096 | S0 | AGN | SF | sAGN | wAGN | off-w | 1 | |
| 33 | J143553.84+075652.13 | 0.099 | LTG | AGN | COMP | wAGN | wAGN | cen | 1 | |
| 34 | J113914.89-024107.87 | 0.103 | Merger | LINER | COMP | sAGN | wAGN | off-w | 1 | |
| 35 | J103554.15+110243.16 | 0.105 | Merger | AGN | SF | sAGN | sAGN | off-w | 2 | |
| 36 | J144222.93+580434.42 | 0.105 | S0 | COMP | SF | sAGN | SF | off-w | 1 | |
| 37 | J075016.22+145816.70 | 0.107 | S0 | LINER | COMP | sAGN | sAGN | off-w | 0 | |
| 38 | J080738.22+504526.08 | 0.120 | Merger | COMP | SF | sAGN | sAGN | off-w | 1 | |
| 39 | J154447.10+462817.72 | 0.121 | S0 | AGN | COMP | sAGN | wAGN | cen | 1 | |
| 40 | J142404.89+183606.76 | 0.121 | S0 | AGN | SF | wAGN | sAGN | cen | 1 | |
| 41 | J165742.02+380058.76 | 0.122 | Merger | AGN | SF | sAGN | sAGN | off-s | 1 | |
| 42 | J091431.22+551020.47 | 0.123 | S0 | AGN | COMP | wAGN | wAGN | cen | 1 | |
| 43 | J090211.82+083609.82 | 0.128 | LTG | AGN | COMP | sAGN | sAGN | off-s | 0 | |
| 44 | J164507.91+205759.50 | 0.130 | Merger | AGN | COMP | sAGN | sAGN | cen | 2 | |
| 45 | J164048.18+420042.75 | 0.133 | S0 | AGN | SF | sAGN | sAGN | off-w | 2 | |
| 46 | J090308.54+272639.04 | 0.135 | Merger | AGN | COMP | sAGN | sAGN | off-w | 1 | |
| 47 | J131044.32+245650.58 | 0.136 | LTG | COMP | SF | sAGN | wAGN | off-w | 1 | |
| 48 | J103510.83+420935.01 | 0.137 | S0 | COMP | SF | sAGN | SF | off-w | 1 | |
| 49 | J164155.60+252952.38 | 0.137 | LTG | AGN | COMP | sAGN | wAGN | off-w | 1 | |
| 50 | J105546.75+055409.21 | 0.138 | S0 | LINER | COMP | sAGN | wAGN | off-w | 1 | |
| 51 | J161050.02+324000.60 | 0.140 | S0 | AGN | COMP | sAGN | wAGN | off-w | 5 | |
| 52 | J104903.68+253323.97 | 0.140 | LTG | AGN | COMP | wAGN | sAGN | off-s | 1 | |
| 53 | J074715.76+370649.32 | 0.140 | Merger | AGN | COMP | sAGN | sAGN | cen | 1 | |
| 54 | J103945.99+173849.13 | 0.143 | S0 | AGN | COMP | sAGN | sAGN | off-w | 0 | |
| 55 | J171731.31+282424.67 | 0.152 | S0 | AGN | COMP | sAGN | sAGN | cen | 1 | |
| 56 | J150552.72+192909.16 | 0.157 | Merger | LINER | COMP | sAGN | sAGN | off-w | 1 | |
| 57 | J093610.57+303130.25 | 0.162 | Merger | AGN | SF | sAGN | sAGN | off-w | 1 | |
| 58 | J141426.56+643540.20 | 0.166 | S0 | AGN | SF | sAGN | sAGN | off-s | 0 |
Peer Reviews
No public reviews on file for this paper yet. If you reviewed it on a platform where reviews are public (OpenReview, ICLR, NeurIPS, ICML), you can paste yours below so the community can read it here.
Videos
No videos yet. Explain this paper in a talk, walkthrough, or lecture? Add one.
11institutetext: Sorbonne Université, LERMA, Observatoire de Paris, PSL research university, CNRS, F-75014, Paris, France 22institutetext: RWTH Aachen University, Institute for Philosophy of Science and Technology, Aachen, Germany
22email: [email protected], [email protected]
Ultimate Merging at z0.1
Daniel Maschmann 1122
Anne-Laure Melchior 11
(Received April ?, 2019; accepted ?)
We present a study of 58 double-peaked emission line galaxies for which one of the components is suppressed in 5008 or significantly weaker than the other one. Accordingly, the two components are classified differently in the BPT diagram. We show that the strong component coincides with the stellar velocity and the suppressed component is off-centred in 66 of the galaxies, while in 12 of them it is the opposite. The analysis of their morphology reveals that about half of the sample is composed of S0, the rest is composed in equal part of mergers and late-type galaxies. We discuss that these characteristics exclude rotating discs and suggest different stages of merging. It is possible that the number of mergers is underestimated if the double nuclei are not resolved. Tidal features are detected in the outskirts of some S0 galaxies. This high fraction of S0 is surprising, as in addition most of the galaxies are isolated and the others in small groups. All these galaxies, hosting an AGN component, are massive, lie on the star forming sequence, and exhibit an enhanced star formation in their centre. While we cannot exclude outflows, these galaxies exhibit a spectra, which do not correspond to usual outflow observations characterised by high gas velocities, and the standard deviations of the two peaks are comparable. In parallel, these characteristics are compatible with ultimate stages of galaxy merging, where the two nuclei are too close to be detected or dynamical disturbances might be present in post-mergers like massive S0.
Key Words.:
galaxies: kinematics and dynamics, galaxies: interactions, galaxies: evolution, galaxies:irregular, techniques: spectroscopic, methods: data analysis
1 Introduction
The building-up of galaxies is currently understood as a co-evolution of the star formation (SF), usually strong in the central parts, and the accretion activity of the central black hole (Madau & Dickinson 2014). While galaxy interactions can trigger SF (Mihos & Hernquist 1994, 1996; Bellocchi et al. 2013), gas accretion is not negligible (Kereš et al. 2005; Sancisi et al. 2008). In the local Universe, interactions and minor/major mergers do not necessarily enhance SF (e.g. Bergvall et al. (2003); Bell et al. (2005); Di Matteo et al. (2007)), but they can also drive gas towards the centre, fuel the nuclear black hole, enhancing active galactic nuclei (AGN) activity and feedback (Croton et al. 2006; Springel et al. 2005). Major mergers are definitely providing the largest starbursts (Sanders & Mirabel 1996), but they are rare, and their influence on the total cosmic SF is low (Di Matteo et al. 2007; Robaina et al. 2009). Galaxy mergers are usually identified on their optical morphology. Wide field observations connect enhanced AGN and starburst activities with interactions in galaxy pairs (Patton et al. 2013; Satyapal et al. 2014).
In this letter, we investigate a galaxy sample based on a spectroscopic selection. Relying on the RCSED catalogue from Chilingarian et al. (2017), Maschmann et al. (in prep.) have performed an automatic selection of about 5000 galaxies from the SDSS catalogue (Strauss et al. 2002), exhibiting double-peak emission lines. We study here 58 such double-peak galaxies, whose peaks exhibit two different Baldwin, Phillips Terlevich (BPT) diagnostics: AGN/SF, AGN/composite or composite/SF. Previous works on double-peaked emission-lines, motivated by dual or offset AGNs, were restricted to AGN lines. Different works identified galaxy mergers and AGN outflows (Comerford et al. 2018; Liu et al. 2018; Nevin et al. 2018; Müller-Sánchez et al. 2015). As discussed in Ge et al. (2012), beside dual AGN, double-peaked emission lines can correspond to several configurations difficult to disentangle: rotating disk, gas outflow or different gas components due to a galaxy merger. In this work, we focus on double-peak emission-line galaxies with a high signal-to-noise ratio (SNR) in all lines, but with one of the [OIII]5008 components absent or significantly weaker than the other one. As further argued throughout this letter, we do not expect rotating discs exhibiting such a pattern, which favours the merging and possibly outflow scenarios. In Sect. 2, we present the spectroscopic selection of the galaxy sample, their host properties, the estimated star formation and their environment. In Sect. 3, we discuss the results. A cosmology of , and is assumed in this work.
2 Data analysis: host properties of merger candidates
Relying on the RCSED catalogue (Chilingarian et al. 2017), a single and a double Gaussian function are fitted to the emission-lines and several selection criteria have been applied. We stacked all fitted emission lines and introduced a global peak position and velocity dispersion () for each peak. (resp. ) corresponds to the flux of the blueshifted (resp. redshifted) component. The catalogue finally provides parameters of the fitted double Gaussian function for the different optical lines. We restrict the analysis to the 4863, [OIII]5008, 6565 and 6586 emission-lines.
2.1 Spectroscopic selection and classification
We focus here on galaxies with (1) a 6565 flux ratio between the two components in the range and (2) an [OIII]5008 flux ratio below or above . We also require a signal-to-noise ratio (SNR) larger than 10 for the [OIII]5008 line. We hence select galaxies with a well-defined double-peak structure in the 6565 line, but suppressed in [OIII]5008. At this stage, we select 123 galaxies. We then classify each emission line component individually with a BPT diagram (Baldwin et al. 1981; Kewley et al. 2006) and select the galaxies with two different classifications. We finally get 58 galaxies as displayed in Figure 1. The weaker components are situated in the composite and star forming regions. The components with the higher [OIII] flux are clearly associated with AGN/LINER activity but for 11 located in the composite region. We later refer to the two components as the weak [OIII] and the strong [OIII] components. Examples of spectra of galaxies thus selected are displayed in Figure 2 and Figure 8.
We also classify the sample with the WHAN diagram shown in Figure 9. While a shift is observed between the two components, there are only 9 out of 58 galaxies with AGN/SF classification. The BPT-AGN are classified strong and weak AGN in the WHAN diagnostics. The BPT-based composite and star forming classifications are more ambiguous. However, the WHAN diagram (Cid Fernandes et al. 2010) based on equivalent widths is biased if there is an AGN in one component as the continuum of both components will be affected.
In Table 1, we list the properties of the 58 galaxies sorted by redshift.
2.2 Morphology
Our selected sample is composed of galaxies with redshifts in the range 0.04-0.17, corresponding to a SDSS 3 fiber diameter between 2 and 10 kpc. The mean stellar masses are around log10(M/M*⊙*)11 (Kauffmann et al. 2003). Relying on a machine-learning-based morphological classification (Domínguez Sánchez et al. 2018) and a visual correction when required, we classify this sample as 15 (26) merger, 16 (28) late-type (LTG), 1 (2) early type (ETG) and 26 (45) S0 galaxies. Only one galaxy has been (mis-)classified as elliptical, and it might be a S0. Several galaxies were mis-classified by machine-learning-based morphological classification, e.g. close double nuclei were missed. We show snapshots in Figure 3. Beside galaxies classified mergers, many tidal features can be observed even around S0 galaxies. This can be compared to the work of Eliche-Moral et al. (2018), who show that S0 galaxies resulting from major/minor mergers exhibit tidal features in their outskirts. Last, one can note the large fraction of S0 galaxies compared to the usual fraction observed in magnitude limited samples e.g. in Shapley-Ames Catalog (van den Bergh 2009).
2.3 Kinematics
The velocity differences between the two peaks are between 215 and 415 km s*-1*. These values correspond to the upper range of the Tully-Fisher relation expected according to the stellar masses (McGaugh et al. 2000).
We then compare the velocity of each emission-line component with the stellar velocity. We compute the ratio of the difference between the individual peak position and the stellar velocity of the host galaxy, to the velocity dispersion of the component. In Figure 4, we display these ratios for the weak [OIII] component as a function of those of the strong [OIII] component. We then study if one of the two peaks is centred on the same velocity as the stars or not. We classify galaxies with off-centred strong (resp. weak) [OIII] components as those showing a velocity offset in this component, larger than at least from the stellar velocity. We clearly see that for the majority (66 ) of these galaxies, the position of the strong [OIII] peak is closer to the stellar velocity than for the weak [OIII] peak. This comprises also all galaxies with a strong [OIII] component classified as composite (see Sect. 2.1). But we find also 7 galaxies showing an off-centred strong [OIII] component. The latter are mostly classified as LTG (5), and the remaining are respectively one merger and one S0 galaxy. Last, we also find that 13 galaxies () have the stellar velocity centred between the two peaks. The majority (9) of those are S0 galaxies, the others are 2 LTG and 2 mergers.
2.4 Environment
Following Yang et al. (2007), we estimate the number of identified neighbours, associated to each galaxy of the studied sample. The majority of the galaxies (67 ) is composed of isolated galaxies with no identified counterparts, 46 of those are classified S0, 21 mergers and 31 late-type galaxies. 12 galaxies are located in small groups composed of 2 to 5 galaxies. 3 (25 ) are late-type, 5 (41 ) mergers and 4 (33 ) S0 galaxies. Only one S0 galaxy is located in a small cluster with 27 counterparts. Last, 6 galaxies (10 ) have not been processed by Yang et al. (2007): 2 mergers, 3 S0 galaxies and 1 LTG.
23 (61 ) of the galaxies with an off-centred weak [OIII] component are isolated, while 11 (29 ) of those have counterparts (one of these is in the small cluster above mentioned), 4 (11 ) have not been processed by Yang et al. (2007). Regarding galaxies with an off-centred strong [OIII] component, 4 (57 ) of them are in isolated galaxies, and 1 (14 ) in a pair of galaxies. The 2 (29 ) remaining are not in Yang et al. (2007). Last, the majority 12 (92 ) of galaxies with symmetrical kinematics are isolated and only 1 (8 ) is in a pair.
2.5 Star formation
In Figure 5, we compute the stellar mass - sSFR diagram as discussed by Brinchmann et al. (2004) with stellar mass (resp. sSFR) computed by (Kauffmann et al. 2003) (resp. Brinchmann et al. (2004)). The galaxies from our sample are not quenched and exhibit a star formation ratio typical of the upper-mass range of the main sequence. In Figure 6, we present the ratio between the specific star formation ratio (sSFR) of the total galaxy and the sSFR of the 3 SDSS fiber. The sSFR measurements are computed from Brinchmann et al. (2004). For all the galaxies, we observe a star formation stronger in the central regions.
We calculate the SFR from the extinction corrected 6565 luminosity as described in Kewley et al. (2002). We compute the extinction for each line component using the Balmer decrements (Domínguez et al. 2013) assuming an intrinsic ratio (Osterbrock 1989) and the Whitford reddening curve from Miller & Mathews (1972). With the Balmer decrement, we estimate a mean E(B-V) of 0.6 for the two peaks. The measured mean [OIII]/ flux ratios of the weak and strong components are 0.2 and 1, while the differential dust attenuation between 5007A and 6565A is . Hence, the relative reduction of one of the [OIII] lines cannot be accounted for by extinction only. We subsequently compute the SFR following Kewley et al. (2002):
[TABLE]
In Figure 7, we observe that the SFR associated to the strong [OIII] component is larger than the weak [OIII] one. This effect is even stronger for centred strong [OIII] components (discussed in Sect. 2.3) and especially for those which are also classified as composite (discussed in Sect. 2.1).
3 Discussion
The sample of emission-line galaxies discussed here exhibits two peaks lying in different regions of the BPT. We show that the gas velocities of the two peaks for only 22 of the galaxies are centred on the stellar velocity (see Fig. 4). All these galaxies exhibiting a symmetric kinematics are isolated but one (in a pair), and 69 of them are classified S0. This is not the expected proportion for the morphology of field disc galaxies (e.g. van den Bergh 2009). 78 of the galaxies have one gas peak associated to the stellar velocity, while the second one is offset. Only 33 of these galaxies with an offset kinematics are in pairs or small groups. All galaxies with the stronger [OIII] component classified as composite (see Figure 1) have a stellar velocity associated to this component (Figure 4).
We do not find any significant extinction bias between the two peaks, and the optical snapshots do not reveals any asymmetric features. Similarly, one might think of off-centred circumnuclear discs like observed in NGC1068 (García-Burillo et al. 2017) or the off-centring of the AGN within the sphere of influence of the blackhole (Combes et al. 2019). However, it seems difficult to recover with a 3” fiber these relatively small scale features. Again non-resolved triaxial structures or bars in the central regions might also produce a large velocity gradient and possibly a double peak feature, but it would be difficult to account for the observed off-centring of one component. In addition, this cannot account for the unusual morphological types of this sample.
On the one hand, half of the sample is composed of merger and late-type galaxies. As displayed in Figure 3, it is difficult to disentangle a double nucleus if the galaxy is distant. It is thus possible that the number of mergers is underestimated. On the other hand, half of the sample is composed of S0 galaxies. While the number of S0 is estimated larger in clusters of galaxies (28 according to van den Bergh (2009)), our sample is mainly composed of isolated galaxies or galaxies in small groups.
Those galaxies are actively forming stars: they lie in the upper-mass range of the star forming main sequence (see Figure 5). They are characterised by an enhanced star formation activity in their centre (see Figure 6). They also host an AGN. We find the SFR to be higher in the stronger [OIII] component (Figure 7). This effect is even more distinctive for strong [OIII] components classified as composite which is counter intuitive since the weaker component is classified as SF.
Beside their morphological appearance, the S0 galaxies of this sample exhibit the same properties as the other galaxies of the sample. The origin of the S0 galaxies have been largely debated. While gas ejection by AGN has been proposed (e.g. van den Bergh 2009), it has also been shown that they could result from major/minor mergers (e.g. Eliche-Moral et al. 2018), which is supported here by the fact that some tidal features are observed around some of the S0 galaxies. These different points suggest that we might observe some mergers as well as ultimate phases of merging: galaxies with a double nucleus not resolved in the images or post-mergers (S0) with a central asymmetry. Fraser-McKelvie et al. (2018) discuss that large-mass S0 galaxies might be formed by mergers, as studied by Eliche-Moral et al. (2018). Given the known co-evolution of SF and accretion of the black hole, the AGN activity can be concomitant with an enhancement of SFR (e.g. Mihos & Hernquist (1994); Sancisi et al. (2008)).
Last, one can also discuss the possibility that the off-centred component is linked to an outflow of gas. Asymmetries in emission lines are known to be connected to gas outflow (Heckman et al. 1981; Whittle 1985). Such evidences are based on large field studies. Greene & Ho (2005) and Woo et al. (2016) used double Gaussian emission line structures in the [OIII] line only, while spectroscopic integral field unit studies show a difference in the velocity dispersion of the two lines (Sharp & Bland-Hawthorn 2010; Karouzos et al. 2016), which is not the case here. These observations are consistent with measured outflows creating high offset velocity dispersion of around (Rupke & Veilleux 2013), even though smaller outflow velocities in the order of have been observed in NGC 5929 (Riffel et al. 2014) corresponding to double-peaks in the [OIII] line. We cannot exclude that our observations correspond to an outflow of gas which might explain an offset component.
4 Conclusion
We presented a sample of 58 double-peaked galaxies, displaying a single strong peak in the 5008 corresponding to one of the 6565 components. The two components are classified differently according to the BPT diagnostics, with one peak corresponding to an AGN or a composite region and the second one in the composite or SF region. In addition, we observe an off-centring of one of the components with respect to the stellar velocity in 78 of the galaxies. In addition, these massive galaxies () are actively forming stars with a central enhancement, and 45 of them are S0 galaxies. The large majority (67) are isolated galaxies, while the others are hosted in small groups (with 2-5 galaxies), but one in a small cluster (of 27 galaxies). We can thus exclude this high fraction of S0 galaxies to be due to the environment. Given the galactic nuclei and star formation activities of these galaxies, we cannot exclude that we observe some gas outflows, which would require additional observations e.g. of molecular gas. In the meantime, it is probable that these kinematic signatures are linked to merging activity.
Acknowledgements.
We thank Françoise Combes for interesting suggestions, and Gary Mamon for his support for this work. ALM has benefited from support from Action Fédératrice ”Cosmologie et Structuration de l’Univers”. We thank the anonymous referee for constructive comments.
Funding for the SDSS and SDSS-II has been provided by the Alfred P. Sloan Foundation, the Participating Institutions, the National Science Foundation, the U.S. Department of Energy, the National Aeronautics and Space Administration, the Japanese Monbukagakusho, the Max Planck Society, and the Higher Education Funding Council for England. The SDSS Web Site is http://www.sdss.org/.
The Legacy Surveys (http://legacysurvey.org/) consist of three individual and complementary projects: the Dark Energy Camera Legacy Survey (DECaLS; NOAO Proposal ID # 2014B-0404; PIs: David Schlegel and Arjun Dey), the Beijing-Arizona Sky Survey (BASS; NOAO Proposal ID # 2015A-0801; PIs: Zhou Xu and Xiaohui Fan), and the Mayall z-band Legacy Survey (MzLS; NOAO Proposal ID # 2016A-0453; PI: Arjun Dey). DECaLS, BASS and MzLS together include data obtained, respectively, at the Blanco telescope, Cerro Tololo Inter-American Observatory, National Optical Astronomy Observatory (NOAO); the Bok telescope, Steward Observatory, University of Arizona; and the Mayall telescope, Kitt Peak National Observatory, NOAO. The Legacy Surveys project is honoured to be permitted to conduct astronomical research on Iolkam Du‘ag (Kitt Peak), a mountain with particular significance to the Tohono O’odham Nation.
Appendix A Additional figures
The reference list from the paper itself. Each links out to its DOI / PubMed record.
- 1Baldwin et al. (1981) Baldwin, J. A., Phillips, M. M., & Terlevich, R. 1981, PASP, 93, 5
- 2Bell et al. (2005) Bell, E. F., Papovich, C., Wolf, C., et al. 2005, Ap J, 625, 23
- 3Bellocchi et al. (2013) Bellocchi, E., Arribas, S., Colina, L., & Miralles-Caballero, D. 2013, A&A, 557, A 59
- 4Bergvall et al. (2003) Bergvall, N., Laurikainen, E., & Aalto, S. 2003, A&A, 405, 31
- 5Brinchmann et al. (2004) Brinchmann, J., Charlot, S., White, S. D. M., et al. 2004, MNRAS, 351, 1151
- 6Chilingarian et al. (2017) Chilingarian, I. V., Zolotukhin, I. Y., Katkov, I. Y., et al. 2017, Ap JS, 228, 14
- 7Cid Fernandes et al. (2010) Cid Fernandes, R., Stasińska, G., Schlickmann, M. S., et al. 2010, MNRAS, 403, 1036
- 8Cid Fernandes et al. (2011) Cid Fernandes, R., Stasińska, G., Mateus, A., & Vale Asari, N. 2011, MNRAS, 413, 1687