Search for a heavy charged boson in events with a charged lepton and missing transverse momentum from $pp$ collisions at $\sqrt{s} = 13$ TeV with the ATLAS detector
ATLAS Collaboration

TL;DR
This paper reports a search for a heavy charged boson decaying into a lepton and neutrino using 13 TeV proton-proton collision data from the ATLAS detector, setting mass exclusion limits up to 6 TeV.
Contribution
The study provides the first comprehensive search for $W'$ bosons in both electron and muon channels at 13 TeV, setting new exclusion limits and cross-section bounds.
Findings
No significant excess observed over Standard Model predictions.
Excluded $W'$ bosons below 6.0 TeV (electron) and 5.1 TeV (muon).
Set upper limits on cross sections and resonance widths.
Abstract
A search for a heavy charged-boson resonance decaying into a charged lepton (electron or muon) and a neutrino is reported. A data sample of 139 fb of proton-proton collisions at TeV collected with the ATLAS detector at the LHC during 2015-2018 is used in the search. The observed transverse mass distribution computed from the lepton and missing transverse momenta is consistent with the distribution expected from the Standard Model, and upper limits on the cross section for are extracted ( or ). These vary between 1.3 pb and 0.05 fb depending on the resonance mass in the range between 0.15 and 7.0 TeV at 95% confidence level for the electron and muon channels combined. Gauge bosons with a mass below 6.0 TeV and 5.1 TeV are excluded in the electron and muon channels, respectively, in a model with a resonance that has…
Click any figure to enlarge with its caption.
 Figure 1
 Figure 2
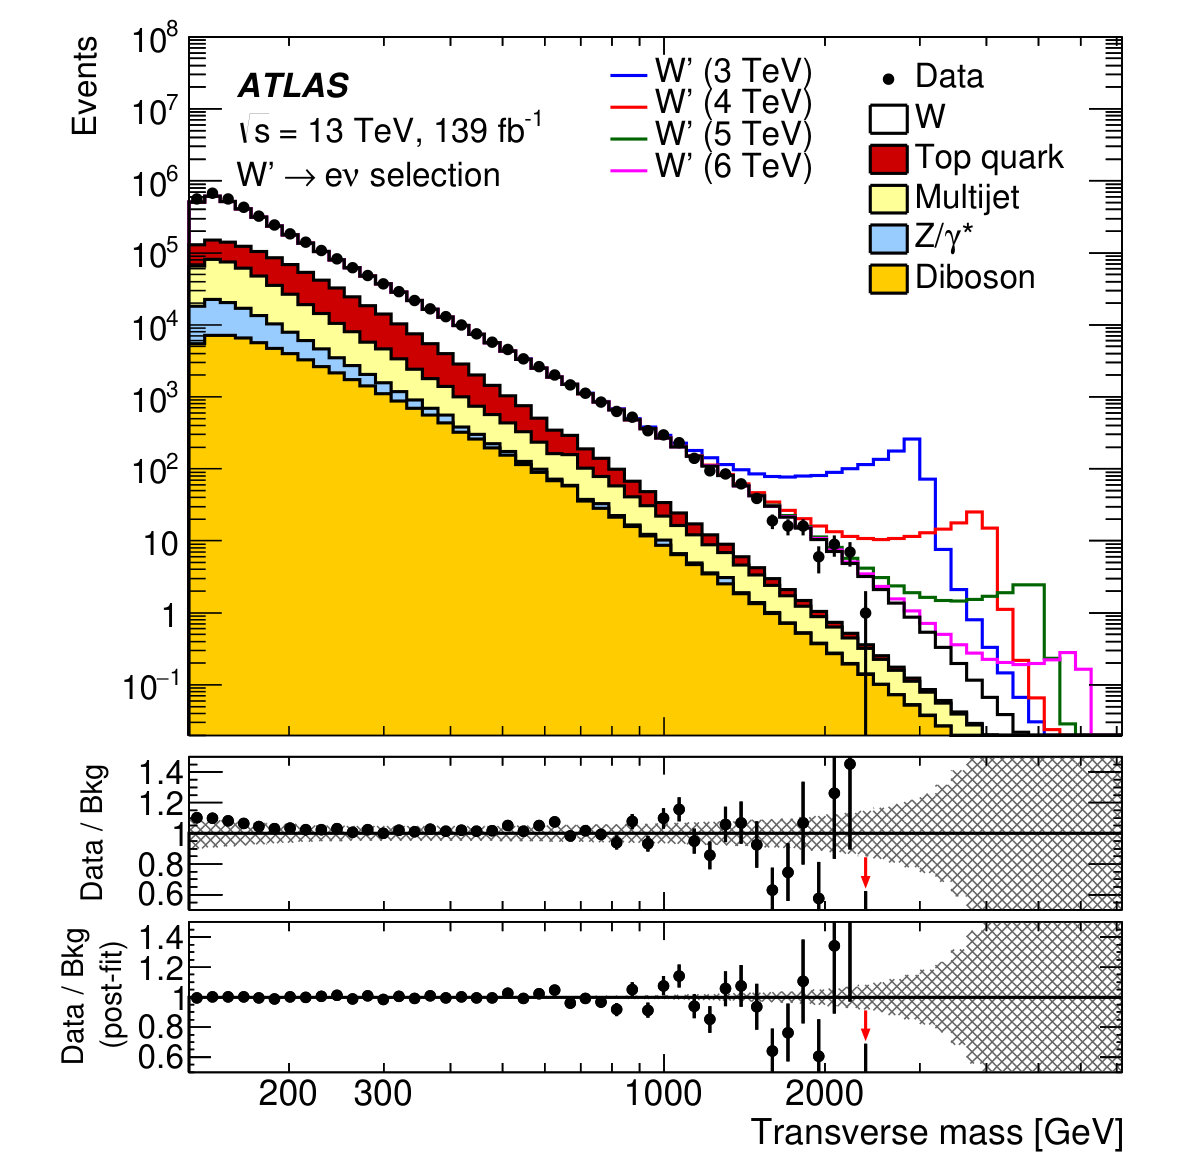 Figure 1
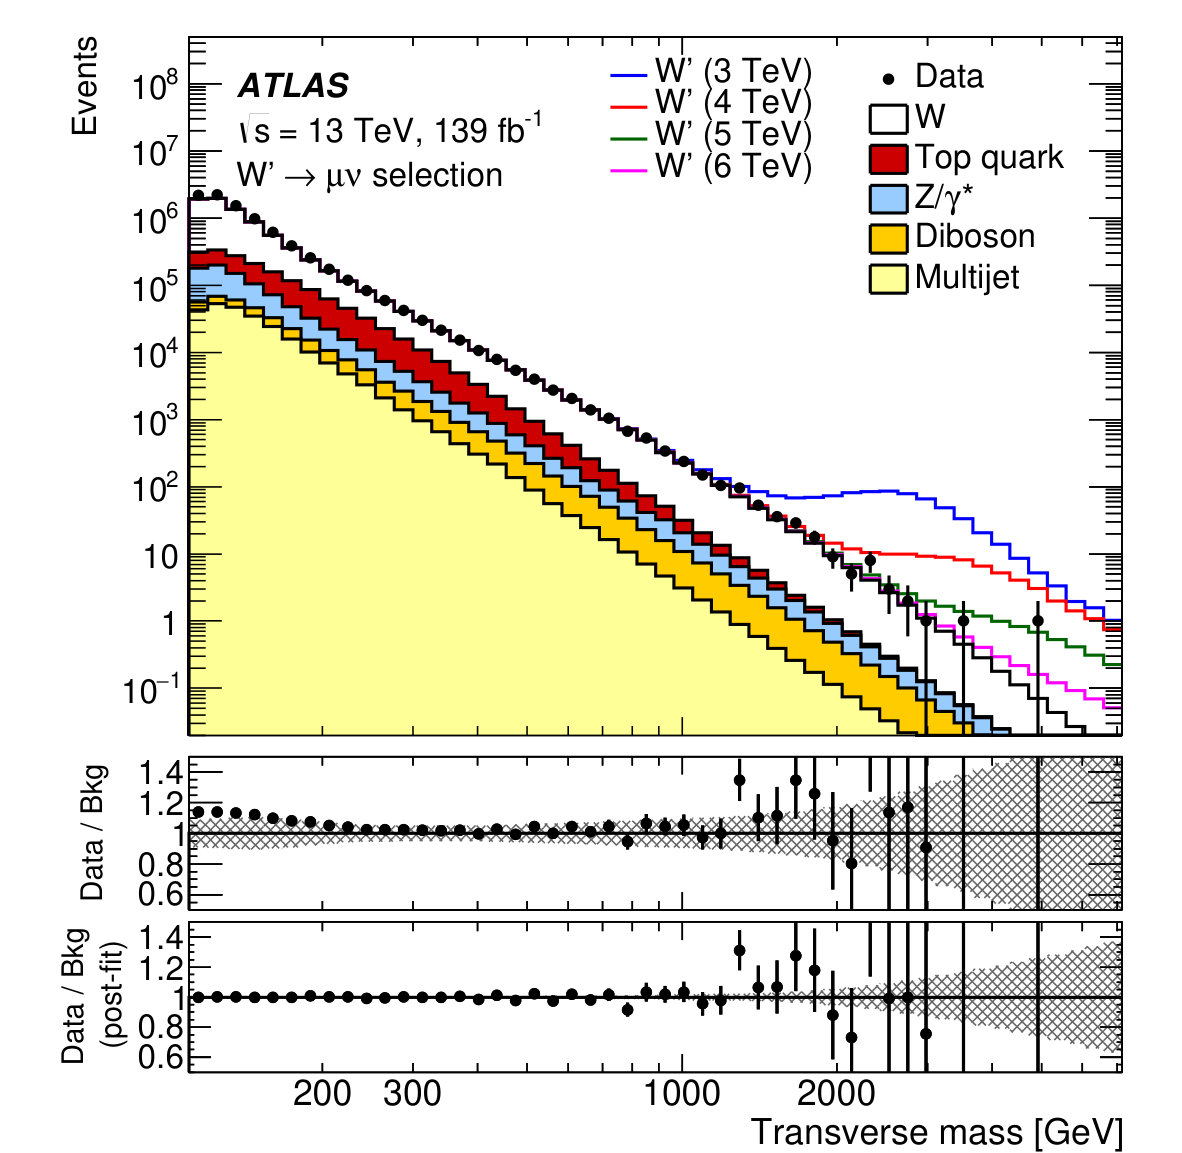 Figure 1
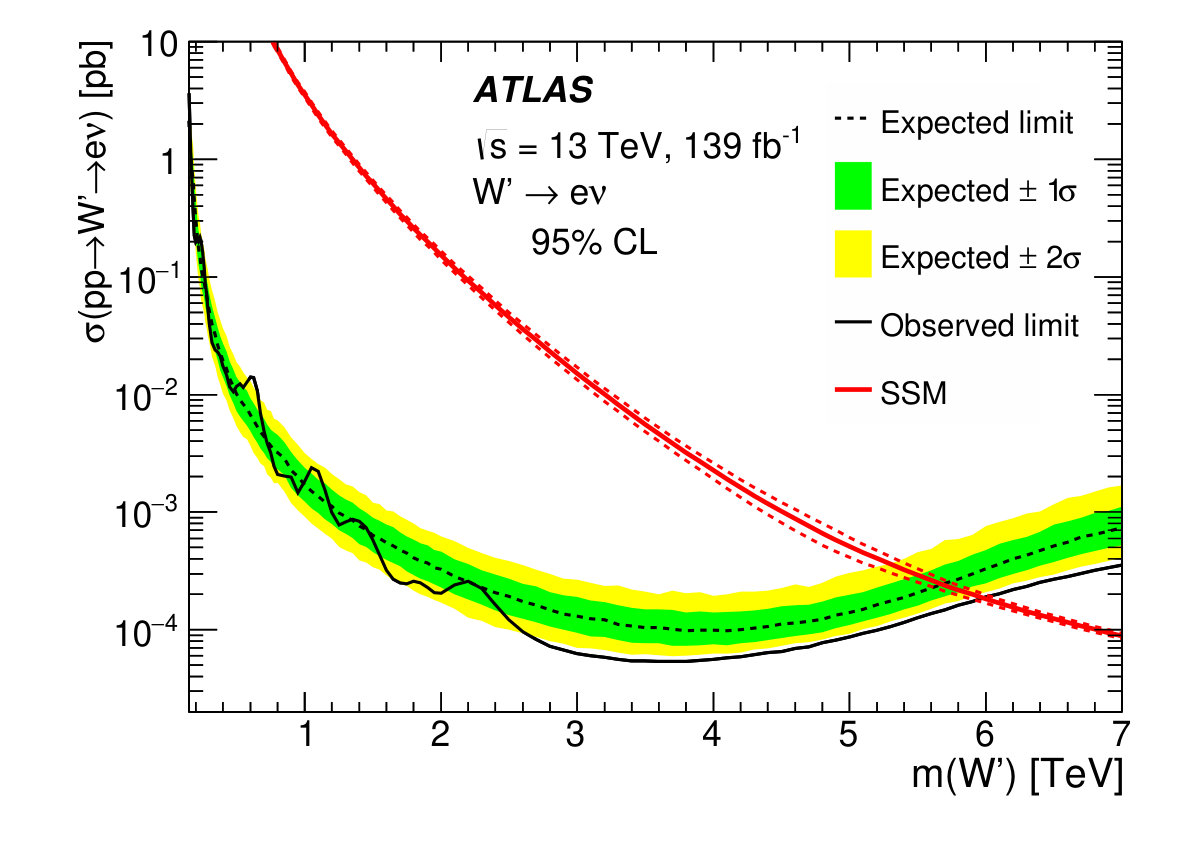 Figure 2
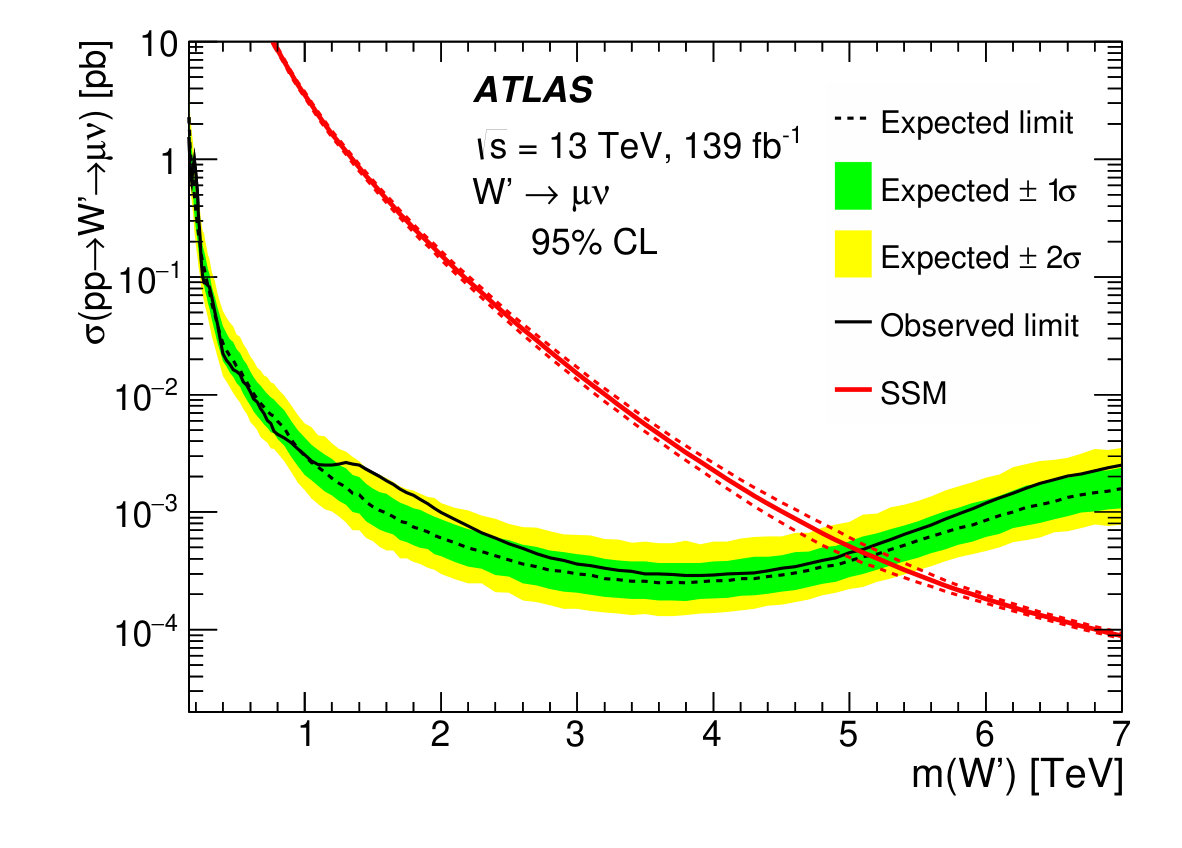 Figure 2
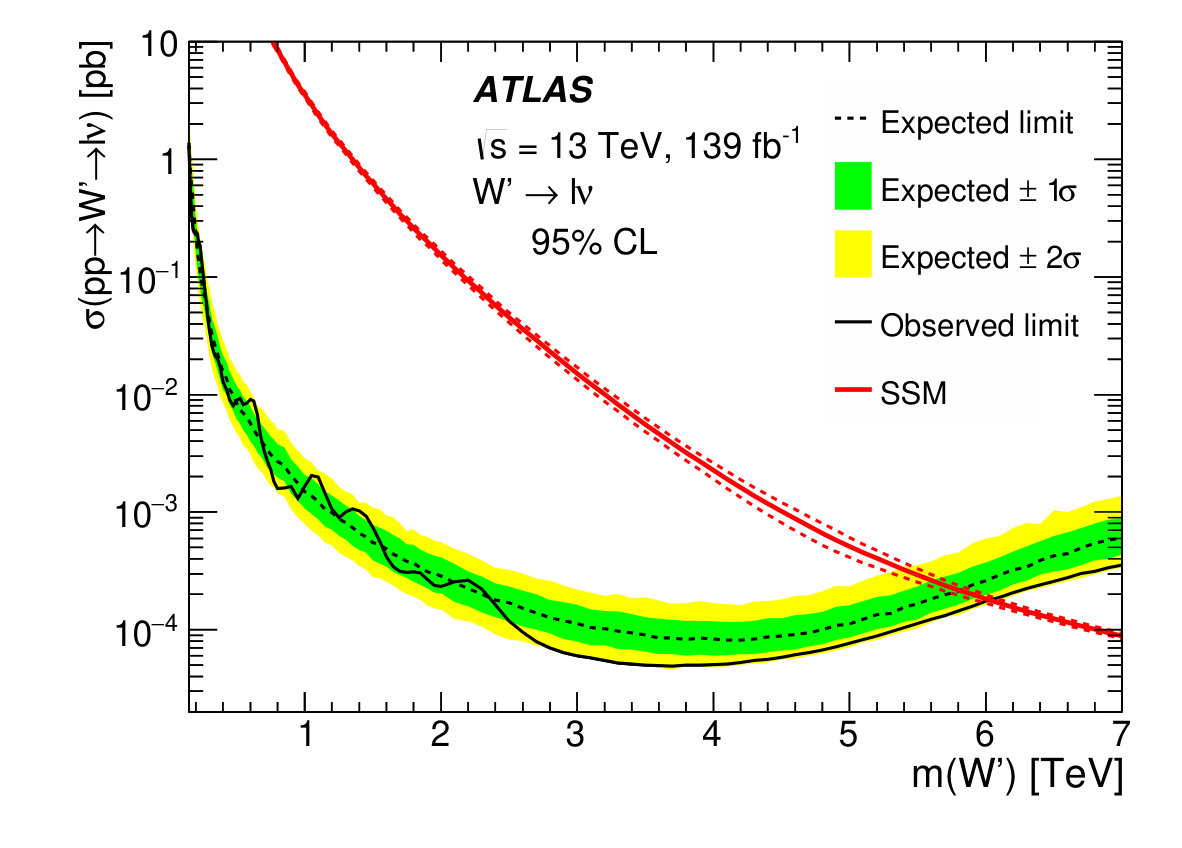 Figure 2
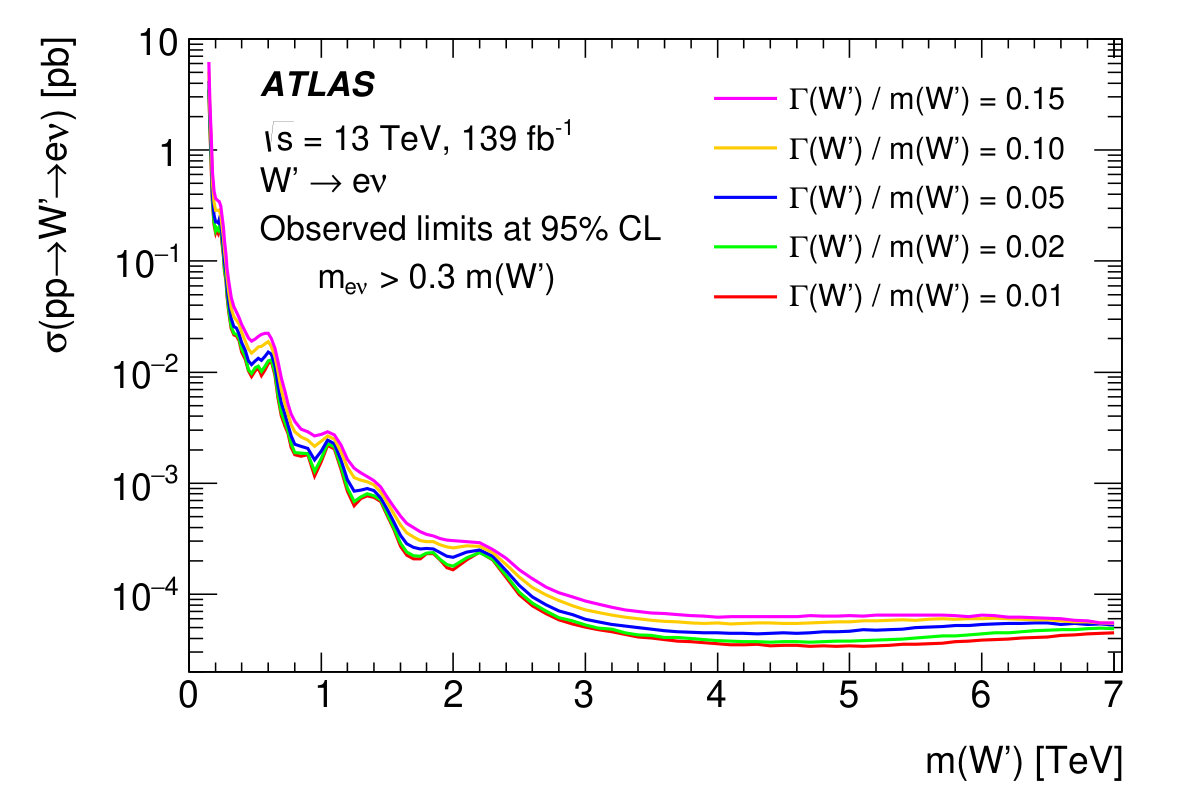 Figure 3
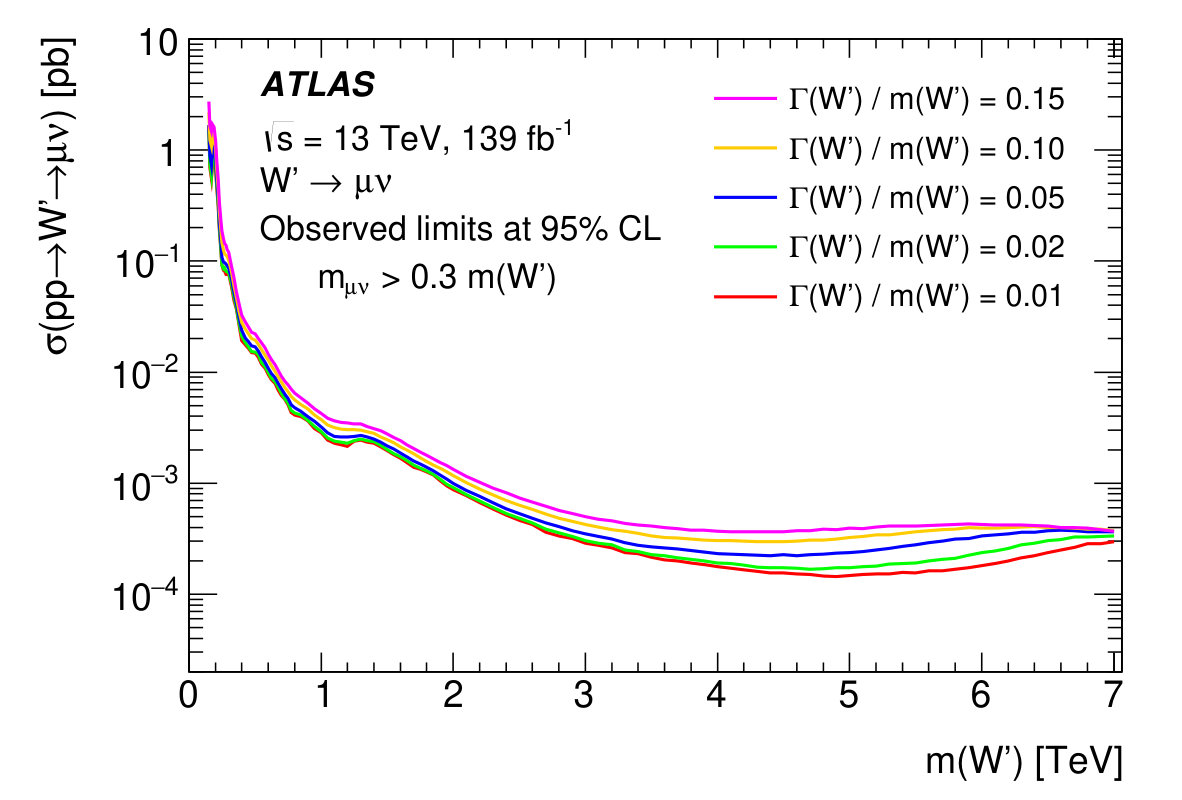 Figure 3
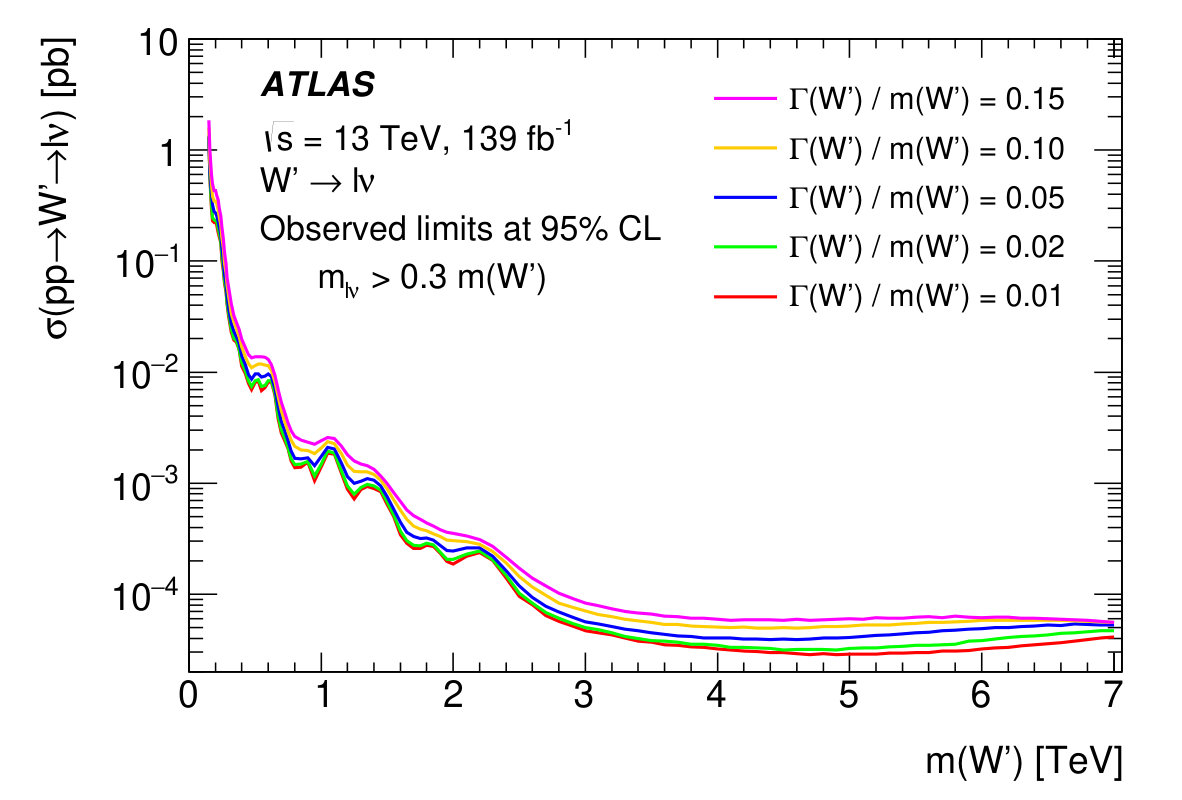 Figure 3
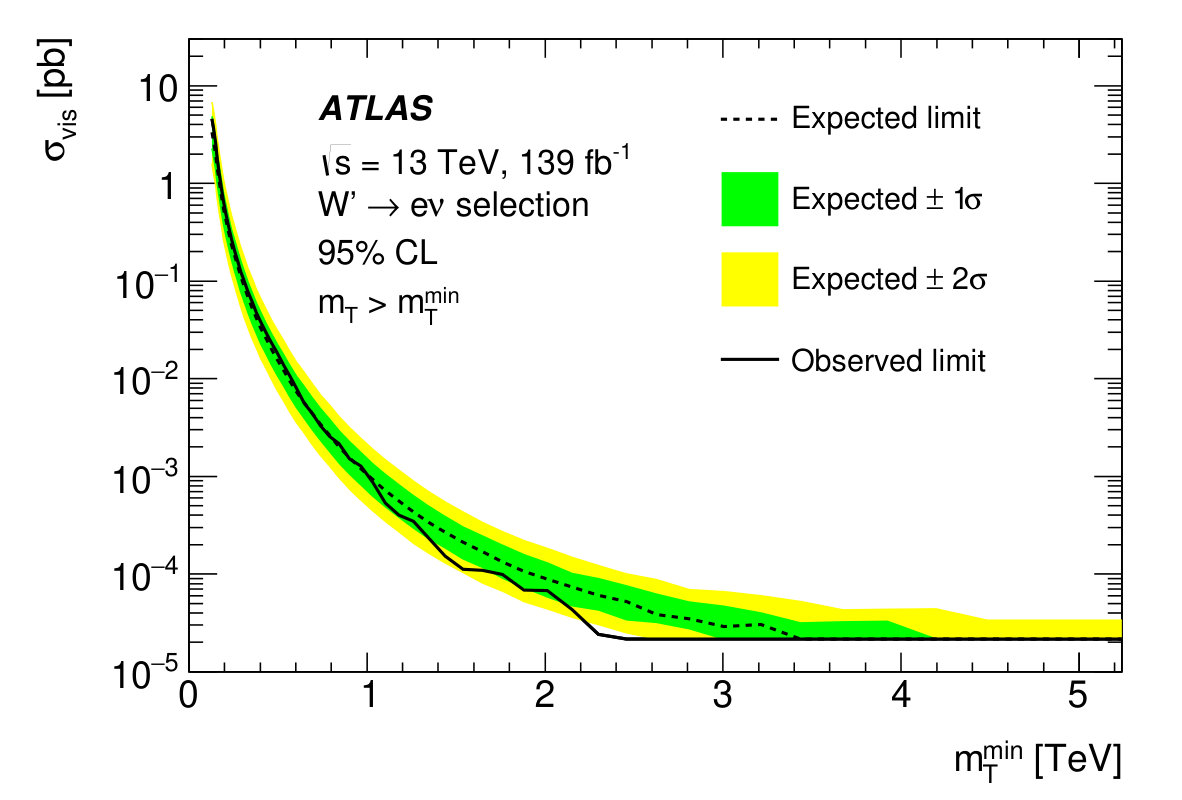 Figure 4
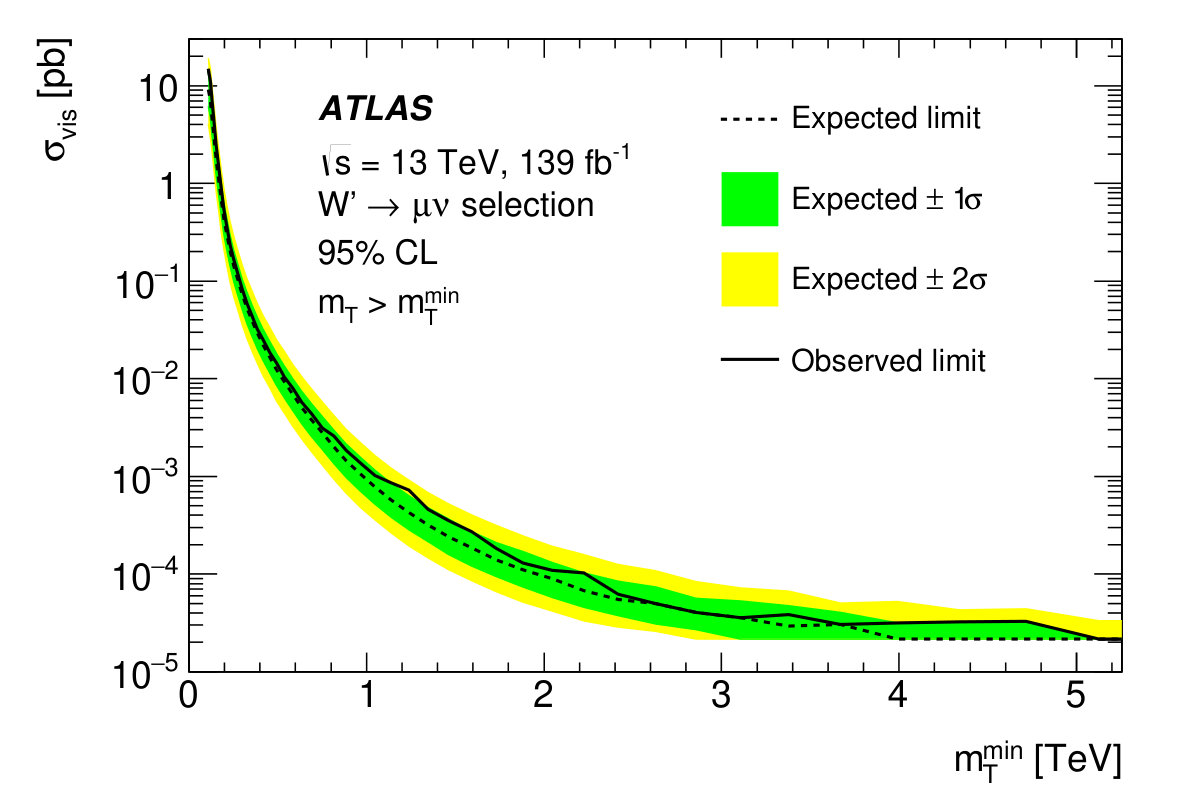 Figure 4
| Electron channel | ||||||||||||
|---|---|---|---|---|---|---|---|---|---|---|---|---|
| [GeV] | 130–400 | 400–600 | 600–1000 | 1000–2000 | 2000–3000 | 3000–10 000 | ||||||
| Data | 3 538 403 | 35 568 | 7358 | 818 | 17 | 0 | ||||||
| Background | 3 320 000 | 250 000 | 34 800 | 1500 | 7200 | 400 | 830 | 80 | 20.2 | 3.1 | 1.3 | 0.5 |
| (2 TeV) | 574 | 22 | 720 | 40 | 2190 | 120 | 12200 | 600 | 1130 | 290 | 3.20 | 0.25 |
| (3 TeV) | 68.4 | 1.9 | 58.6 | 2.6 | 127 | 7 | 448 | 22 | 860 | 40 | 87 | 23 |
| (4 TeV) | 19.6 | 0.5 | 13.2 | 0.5 | 22.1 | 1.1 | 44.3 | 2.2 | 49.2 | 2.3 | 86 | 4 |
| (5 TeV) | 7.85 | 0.19 | 4.99 | 0.18 | 7.26 | 0.35 | 9.9 | 0.5 | 5.82 | 0.28 | 13.6 | 0.7 |
| (6 TeV) | 3.76 | 0.09 | 2.35 | 0.08 | 3.28 | 0.16 | 3.82 | 0.18 | 1.41 | 0.07 | 2.01 | 0.10 |
| Muon channel | ||||||||||||
| [GeV] | 110–400 | 400–600 | 600–1000 | 1000–2000 | 2000–3000 | 3000–10 000 | ||||||
| Data | 8 751 095 | 26 225 | 5393 | 622 | 22 | 2 | ||||||
| Background | 7 800 000 | 700 000 | 25 800 | 1400 | 5300 | 400 | 570 | 50 | 18 | 4 | 2.3 | 0.9 |
| (2 TeV) | 490 | 14 | 594 | 26 | 1680 | 90 | 6700 | 500 | 1520 | 210 | 70 | 50 |
| (3 TeV) | 58.1 | 1.4 | 45.5 | 1.9 | 102 | 6 | 322 | 31 | 380 | 50 | 160 | 40 |
| (4 TeV) | 16.3 | 0.4 | 9.64 | 0.34 | 15.9 | 0.8 | 32.2 | 3.4 | 34 | 5 | 44 | 13 |
| (5 TeV) | 6.50 | 0.15 | 3.55 | 0.12 | 4.98 | 0.22 | 6.7 | 0.6 | 3.9 | 0.6 | 7.2 | 2.3 |
| (6 TeV) | 3.11 | 0.07 | 1.67 | 0.06 | 2.22 | 0.10 | 2.45 | 0.17 | 0.88 | 0.12 | 1.09 | 0.35 |
| Source | Electron channel | Muon channel | ||||||
|---|---|---|---|---|---|---|---|---|
| Background | Signal | Background | Signal | |||||
| TeV | TeV | TeV | TeV | |||||
| Trigger | negl. | (negl.) | negl. | (negl.) | 1.1% | (1.0%) | 1.2% | (1.2%) |
| Lepton reconstruction | 4.1% | (1.4%) | 4.3% | (4.3%) | 8.9% | (37%) | 6.6% | (38%) |
| and identification | ||||||||
| Lepton momentum | 3.9% | (2.7%) | 2.7% | (4.5%) | 12% | (47%) | 13% | (20%) |
| scale and resolution | ||||||||
| resolution and scale | <0.5% | (<0.5%) | <0.5% | (<0.5%) | <0.5% | (<0.5%) | <0.5% | (<0.5%) |
| Jet energy resolution | <0.5% | (<0.5%) | <0.5% | (<0.5%) | <0.5% | (0.6%) | <0.5% | (<0.5%) |
| Multijet background | 4.4% | (420%) | n/a | (n/a) | 0.8% | (1.5%) | n/a | (n/a) |
| Top-quark background | 0.8% | (1.9%) | n/a | (n/a) | 0.7% | (<0.5%) | n/a | (n/a) |
| Diboson extrapolation | 1.5% | (47%) | n/a | (n/a) | 1.3% | (9.7%) | n/a | (n/a) |
| PDF choice for DY | 1.0% | (10%) | n/a | (n/a) | <0.5% | (1.0%) | n/a | (n/a) |
| PDF variation for DY | 8.1% | (13%) | n/a | (n/a) | 7.4% | (14%) | n/a | (n/a) |
| EW corrections for DY | 4.2% | (4.5%) | n/a | (n/a) | 3.7% | (7.0%) | n/a | (n/a) |
| Luminosity | 1.6% | (1.1%) | 1.7% | (1.7%) | 1.7% | (1.7%) | 1.7% | (1.7%) |
| Total | 12% | (430%) | 5.4% | (6.4%) | 17% | (62%) | 15% | (43%) |
| lower limit [TeV] | ||
| Decay | Observed | Expected |
| 6.0 | 5.7 | |
| 5.1 | 5.1 | |
| 6.0 | 5.8 | |
| [GeV] | Upper limit at 95% CL | ||||||
|---|---|---|---|---|---|---|---|
| [pb] | [pb] | ||||||
| [GeV] | Upper limit at 95% CL | ||||||
|---|---|---|---|---|---|---|---|
| [pb] | [pb] | ||||||
Peer Reviews
No public reviews on file for this paper yet. If you reviewed it on a platform where reviews are public (OpenReview, ICLR, NeurIPS, ICML), you can paste yours below so the community can read it here.
Videos
No videos yet. Explain this paper in a talk, walkthrough, or lecture? Add one.
\AtlasTitle
Search for a heavy charged boson in events with a charged lepton and missing transverse momentum from collisions at TeV with the ATLAS detector \AtlasAbstract A search for a heavy charged-boson resonance decaying into a charged lepton (electron or muon) and a neutrino is reported. A data sample of 139 fb*-1* of proton–proton collisions at TeV collected with the ATLAS detector at the LHC during 2015–2018 is used in the search. The observed transverse mass distribution computed from the lepton and missing transverse momenta is consistent with the distribution expected from the Standard Model, and upper limits on the cross section for are extracted ( or ). These vary between 1.3 pb and 0.05 fb depending on the resonance mass in the range between 0.15 and 7.0 TeV at 95% confidence level for the electron and muon channels combined. Gauge bosons with a mass below 6.0 TeV and 5.1 TeV are excluded in the electron and muon channels, respectively, in a model with a resonance that has couplings to fermions identical to those of the Standard Model boson. Cross-section limits are also provided for resonances with several fixed values in the range between 1% and 15%. Model-independent limits are derived in single-bin signal regions defined by a varying minimum transverse mass threshold. The resulting visible cross-section upper limits range between 4.6 (15) pb and 22 (22) ab as the threshold increases from 130 (110) GeV to 5.1 (5.1) TeV in the electron (muon) channel.
\AtlasRefCodeEXOT-2018-30 \PreprintIdNumberCERN-EP-2019-100 \AtlasJournalRefPhys. Rev. D 100 (2019) 052013 \AtlasDOI10.1103/PhysRevD.100.052013 \AtlasCoverSupportingNoteSupporting documentationhttps://cds.cern.ch/record/2640567 \AtlasCoverSupportingNoteAnalysis updates since draft 1https://cds.cern.ch/record/2640567/files/draft2updates.pdf \AtlasCoverCommentsDeadline16 May 2019 \AtlasCoverAnalysisTeamM. K. Bugge, J. Catmore, K. Choi, D. Hayden, U. Klein, M. W. O’Keefe, F. Ould-Saada, S. Willocq \AtlasCoverEdBoardMemberS. Angelidakis, F. Ledroit-Guillon (chair), C. Lee \[email protected] \AtlasCoverEgroupEdBoardatlas-EXOT-2018-30-editorial-board@cern.ch
1 Introduction
One of the main goals of the Large Hadron Collider (LHC) remains the search for physics beyond the Standard Model (SM). Much progress has been made in this search thanks to a broad program that encompasses many different final states. Leptonic final states provide a low-background and efficient experimental signature that brings excellent sensitivity to new phenomena at the LHC. In this article, the results of a search for resonances decaying into a charged lepton and a neutrino are presented, based on 139 fb*-1* of proton–proton () collisions at a center-of-mass energy of 13 TeV. The data were collected with the ATLAS detector during the 2015–2018 running period of the LHC, referred to as Run 2.
The search results are interpreted in terms of the production of a heavy spin-1 boson with subsequent decay into the final state ( or ). Such production is predicted in many models of physics beyond the SM as in Grand Unified Theory models, Left–Right symmetry models [1, 2], Little Higgs models [3], or models with extra dimensions [4, 5], most of which aim to solve the hierarchy problem. The interpretation in this article uses a simplified model, referred to as the Sequential Standard Model (SSM) [6], in which the boson couples to fermions with the same strength as the boson in the SM but with suppressed coupling to SM bosons. Alternative interpretations in terms of generic resonances with different fixed widths ( between 1% and 15%) are also provided for possible reinterpretation in the context of other models. Finally, results are also presented in terms of model-independent upper limits on the number of signal events and on the visible cross section.
Previous searches for bosons have been carried out at the LHC in leptonic, semileptonic, and hadronic final states by the ATLAS and CMS collaborations. The most sensitive searches for bosons are those in the and channels [7, 8], with the most stringent limits to date being set by ATLAS and CMS in the analysis of about 36 fb*-1* of collisions at TeV. A lower limit of 5.2 TeV is set on the boson mass in the electron channel [7] and 4.9 TeV in the muon channel [8], at the 95% confidence level (CL) in the SSM.
The search relies on events collected using single-electron or single-muon triggers with high transverse momentum thresholds. The dominant background source originates from Drell–Yan (DY) production of bosons. Discrimination between signal and background events relies on the transverse mass computed from the charged-lepton transverse momentum and the missing transverse momentum (whose magnitude is denoted ) in the event:
[TABLE]
where is the angle between the charged lepton and missing transverse momentum directions in the transverse plane.111 ATLAS uses a right-handed coordinate system with its origin at the nominal interaction point (IP) in the center of the detector and the -axis along the beam pipe. The -axis points from the IP to the center of the LHC ring, and the -axis points upwards. Cylindrical coordinates are used in the transverse plane, being the azimuthal angle around the -axis. The pseudorapidity is defined in terms of the polar angle as . Angular distance is measured in units of . Final interpreted results are based on a statistical analysis in which the shape of the signal and both the shape and normalization of the background expectations are derived from Monte Carlo (MC) simulation, except for the background contribution arising from jets misidentified as leptons or from hadron decays. The results presented in this article, compared with those from Ref. [7], benefit from: an increase in the integrated luminosity by a factor of four; several upgrades in reconstruction software, including a new algorithm for electron reconstruction [9] and an improved treatment of the relative alignment between the inner tracker and the muon spectrometer; and several interpretations with reduced or no model dependence.
2 ATLAS detector
The ATLAS experiment [10] at the LHC is a multipurpose particle detector with a forward–backward symmetric cylindrical geometry and a near coverage in solid angle. It consists of an inner detector for tracking surrounded by a thin superconducting solenoid providing a axial magnetic field, electromagnetic (EM) and hadronic calorimeters, and a muon spectrometer. The inner detector covers the pseudorapidity range . It consists of silicon pixel, silicon microstrip, and transition radiation tracking detectors. An additional innermost pixel layer [11, 12] inserted at a radius of 3.3 cm has been used since 2015. Liquid-argon (LAr) sampling calorimeters provide EM energy measurements with high granularity. A hadronic scintillator-tile calorimeter covers the central pseudorapidity range (). The endcap and forward regions are instrumented with LAr calorimeters for both the EM and hadronic energy measurements up to . The muon spectrometer surrounds the calorimeters and features three large air-core toroidal superconducting magnet systems with eight coils each. The field integral of the toroids ranges between and 6.0\text{\,}\leavevmode\nobreak\Tm across most of the detector. The muon spectrometer includes a system of precision tracking chambers and fast detectors for triggering. A two-level trigger system [13] is used to select events. The first-level trigger is implemented in hardware and uses a subset of the detector information to reduce the accepted rate to at most . This is followed by a software-based trigger level that reduces the accepted event rate to on average.
3 Data and Monte Carlo simulation samples
The data for the analysis were collected during Run 2 at the LHC at TeV and correspond to an integrated luminosity of 139 fb*-1* after the requirement that beams were stable, all detector systems were functional, and the data satisfied a set of quality criteria. Single-electron triggers required that electron candidates satisfy either medium identification criteria [9] and have a transverse energy GeV or loose identification criteria and have GeV. For the 3.2 fb*-1* collected in 2015, the thresholds were 24 and 120 GeV, respectively. Single-muon triggers required the presence of at least one muon reconstructed in both the inner detector and the muon spectrometer with GeV. The trigger efficiency for DY boson events (relative to the full event selection described in Section 4) is estimated to be 99% in the electron channel and 85% in the muon channel, with little dependence on the value.
Signal MC events with and decays in the SSM were produced at leading order (LO) with the Pythia v8.183 event generator [14] and the NNPDF23LO parton distribution function (PDF) set [15]. The A14 set of tuned parameters (i.e. the A14 tune) [16] was used for the parton showering and hadronization process. In the SSM, the couplings of the boson to SM fermions are chosen to be identical to those of the SM boson, whereas the couplings to SM bosons are set to zero. The corresponding branching fraction for boson decays into leptons of one generation is 10.8% for GeV and decreases above the threshold to a nearly constant value of 8.2% for above 1 TeV. Similarly, the ratio of the boson width to its mass varies from 2.7% for GeV to 3.5% above the threshold. Decays into the final state with subsequent leptonic decay of the -lepton are not included as they were found to add negligible signal acceptance in previous studies [17]. Interference between and boson production is not included in this analysis.
The dominant background due to DY production of bosons decaying into , , and final states was simulated at next-to-leading order (NLO) with the Powheg-Box v2 event generator [18, 19, 20, 21] using the CT10 PDF set [22]. Background events from DY production of bosons decaying into , , and final states were also simulated with the same event generator and PDF set. In both cases, Pythia v8.186 was used for the parton showering and hadronization process with the AZNLO tune [23]. The DY processes were generated separately in different or mass ranges to guarantee that sufficiently large numbers of events remain after event selection in the full mass range relevant to the analysis. Cross sections calculated by Powheg-Box for both DY processes were corrected via mass-dependent -factors to account for QCD effects at next-to-next-to-leading order (NNLO) and electroweak (EW) effects at NLO. The QCD corrections were computed with VRAP v0.9 [24] and the CT14 NNLO PDF set [25]. These corrections increased the cross section by about 5% for TeV and 15% for TeV. The EW corrections were computed with MCSANC [26] in the case of QED effects due to initial-state radiation, interference between initial- and final-state radiation, and Sudakov logarithm single-loop corrections. These corrections were added to the NNLO QCD cross-section prediction in the so-called additive approach (see Section 6) because of a lack of calculations of mixed QCD and EW terms. As a result, the cross section decreased by about 10% for TeV and 20% for TeV. The effects due to QED final-state radiation were already included in the event generation using PHOTOS++ [27]. The QCD corrections based on VRAP and the CT14 NNLO PDF set were also applied to the signal samples. No electroweak corrections, beyond those already accounted for with PHOTOS++, were applied to the signal samples as those are model-dependent.
Additional background sources from diboson (, , and ) production were simulated with the Sherpa v2.2.1 event generator [28] and the NNPDF30 NNLO PDF set [29]. These processes were computed at NLO for up to one additional parton and at LO for up to three partons. The production of top-quark pairs and single top quarks (in the - and -channels) was performed at NLO with Powheg-Box [30, 31, 32] and the NNPDF30 NLO PDF set, interfaced with Pythia v8.183 and the A14 tune. Single top-quark production in the -channel was performed in the same way except for the use of the NNPDF3.04f NLO PDF set. The cross sections used to normalize the diboson MC samples are computed with Sherpa, and the top-quark pair cross section is taken to be pb for a top-quark mass of 172.5 GeV. This value is calculated at NNLO in QCD, including the summation of next-to-next-to-leading logarithmic soft gluon terms, with Top++2.0 [33, 34, 35, 36, 37, 38, 39]. A correction depending on the top-quark value is applied to account for shape effects due to NNLO QCD and NLO EW corrections according to Ref. [40]. The cross sections for single top-quark production are computed at approximate NNLO accuracy [41, 42, 43].
For all MC samples, except those produced with Sherpa, -hadron and -hadron decays were handled by EvtGen v1.2.0 [44]. Inelastic events generated using Pythia v8.186 with the A3 tune [45] and the NNPDF23LO PDF set were added to the hard-scattering interaction in such a way as to reproduce the effects of additional interactions in each bunch crossing during data collection (pileup). The detector response was simulated with Geant 4 [46, 47], and the events were processed with the same reconstruction software as for the data. Energy/momentum scale and efficiency corrections are applied to the results of the simulation to account for small differences between the simulation and the performance measured directly from the data [9, 48].
4 Event reconstruction and selection
The analysis relies on the reconstruction and identification of electrons and muons, as well as the missing transverse momentum in each event. Collision vertices are reconstructed with inner detector tracks that satisfy GeV, and the primary vertex is chosen as the vertex with the largest for the tracks associated with the vertex.
Electron candidates are reconstructed by matching inner detector tracks to clusters of energy deposited in the EM calorimeter. Electrons must lie within , excluding the barrel–endcap transition region defined by , and satisfy calorimeter energy cluster quality criteria. The cluster must have GeV, and the associated track must have a transverse impact parameter significance relative to the beam axis . Successful candidates are identified with a likelihood method and need to satisfy the tight identification criteria [9]. The likelihood relies on the shape of the EM shower measured in the calorimeter, the quality of the track reconstruction, and the quality of the match between the track and the cluster. To suppress electron candidates originating from photon conversions, hadron decays, or jets misidentified as electrons (hereafter referred to as fake electrons), electron candidates are required to satisfy the gradient isolation criteria [9] based on both tracking and calorimeter measurements. The reconstruction and identification efficiency rises from approximately 80% at GeV to 90% above 500 GeV, and the isolation efficiency is slightly higher than 99% for values above 200 GeV. The electron energy resolution for TeV can be characterized by , with varying between 0.007 and 0.012 [9] in the range which dominates the high-mass part of the search. The corresponding resolution ranges from approximately 1.3% at values near 2 TeV to 1.0% near 6 TeV.
Muon candidates are reconstructed by matching inner detector tracks with muon spectrometer tracks and by reconstructing a final track combining the measurements from both detector systems while taking the energy loss in the calorimeter into account. The candidates must satisfy quality selection criteria optimized for high- performance [48] by requiring the candidate tracks to have associated measurements in the three different chamber layers of the muon spectrometer. The tracks must also have consistent charge-to-momentum ratio measurements in the inner detector and muon spectrometer, have sufficiently small relative uncertainty in the charge-to-momentum ratios for the combined tracks, and be located in detector regions with high-quality chamber alignment. Candidates must have , GeV, , and mm, where is the longitudinal impact parameter relative to the primary vertex. The reconstruction and identification efficiency is 69% for TeV and decreases to 57% for TeV. Muon candidates from hadron decays are suppressed by imposing a track-based isolation [48] that achieves an efficiency higher than 99% for the full range of interest. The muon resolution at TeV can be described as , with varying between 0.08 and 0.20 TeV*-1* depending on the detector region [48]. This resolution dominates the resolution in the muon channel.
Jets are reconstructed from topological clusters of energy deposits in calorimeter cells [49] with the anti- clustering algorithm [50] implemented in FastJet [51]. A radius parameter equal to 0.4 is used, and the clusters are calibrated at the EM scale [52]. Jets are required to have (30) GeV for smaller (greater) than 2.4. To remove jets originating from pileup, jet-vertex-tagging is applied [53].
The event’s missing transverse momentum is computed as the vectorial sum of the transverse momenta of leptons, photons, and jets. The overlap between these is resolved according to Ref. [54]. Electrons and muons must pass the selection requirements described above. In addition to the above particles and jets, the calculation includes a soft term [54] accounting for the contribution from tracks associated with the primary vertex but not associated with leptons, converted photons, or jets already included in the calculation.
Events are required to have a primary vertex. They are rejected if any of the jets fail to pass a cleaning procedure designed to suppress non-collision background and calorimeter noise [55].
In the electron channel, events must have exactly one electron passing the selection described above. Events are vetoed if they contain any additional electron candidate satisfying the medium selection criteria and having GeV. Events are also vetoed if they contain any muon candidate satisfying the medium selection criteria and having GeV. The missing transverse momentum must satisfy GeV, and the transverse mass must satisfy GeV. In the muon channel, events must have exactly one selected muon as detailed above, and the same veto on additional electron and muon candidates is applied, except that electron candidates close to the muon () are assumed to arise from photon radiation from the muon and are thus not considered as additional electron candidates. Events are required to satisfy GeV and GeV in the muon channel. The event selection described above defines the signal regions in the electron and muon channels. In these regions, the acceptance times efficiency for signal events decreases from 79% (52%) to 64% (44%) as the boson mass increases from 2 to 7 TeV in the electron (muon) channel. The decrease at high is generally due to the combined effect of a growing low-mass tail at larger and the kinematic selection thresholds. In the case of the muon channel, it also originates from a decrease in the identification efficiency at higher values due to the requirements on the charge-to-momentum measurement.
5 Background estimation and event yields
The background from DY production of and bosons as well as from top-quark pair, single top-quark, and diboson production is modeled with the MC samples described in Section 3. To compensate for the limited number of events at high , the smoothly falling distributions for top-quark (corresponding to both pair and single production) and diboson samples are fitted and extrapolated to high with the following functions commonly used in dijet searches (e.g. Refs. [56, 57]):
[TABLE]
[TABLE]
Function is the nominal extrapolation function for the top-quark background in both the electron and muon channels as well as for the diboson background in the electron channel. Function is the nominal function for the diboson background in the muon channel. In all cases, checks are performed to guarantee that the function reproduces the event yields at lower values and that its cumulative distribution (starting from the highest values) is consistent with the small integrated event yields available in the MC samples.
The background contribution from events with fake electrons or muons mostly originates from multijet production and is extracted from the data using the same matrix method as used in previous analyses and described in Ref. [58]. This method relies on data samples in which the electron or muon selection is loosened (referred to as the loose selection). The efficiency for those lepton candidates to pass the nominal lepton selection (tight) is measured to derive an estimate of the background from fake leptons. The loose selection is close to that applied by the trigger requirements. The fraction of fake leptons passing the loose selection that also pass the nominal lepton selection is estimated from the data in background-enriched control regions that are orthogonal to the signal regions. These control regions are built by requiring that there are no candidates formed by combining the selected lepton with a loose lepton in the event and that the value is less than 60 (55) GeV in the electron (muon) channel. Additional requirements are placed on the minimum impact parameter, the presence of at least one jet, and the proximity of the missing transverse momentum vector to the lepton in the muon channel to reduce the contribution from prompt muons. The remaining contributions from prompt electrons and muons in these control regions are subtracted using MC simulation. The number of jets misidentified as leptons () in the signal regions is computed as
[TABLE]
where is the number of fake leptons that pass the loose lepton selection, is the number of lepton candidates that pass the loose lepton selection but fail the nominal lepton selection, and is the number of lepton candidates that pass the nominal lepton selection. The numbers and are extracted from the signal regions. In addition, the quantity , corresponding to the fraction of real leptons satisfying the nominal selection in the sample of loose candidates, is computed from the DY boson MC samples. Like for the top-quark and diboson background sources, the distribution is extrapolated to high values by using a function with the same form as in Eq. (1) in the electron channel and the function in the muon channel. The same set of checks concerning the quality of the extrapolation are performed as for the top-quark and diboson backgrounds.
The distributions in data and simulation are shown in Figure 1, and the numbers of events in several ranges are presented in Table 1. No event is observed beyond values of 10 TeV in either channel. The features observed in these distributions are discussed in Section 7. The DY boson contribution dominates the total background with a fraction varying between approximately 69% (72%) and 95% (88%) in the electron (muon) channel. Other background contributions arise mostly from DY boson, top-quark, and diboson production. The contribution from multijet events in the electron channel decreases from approximately 10% at the lowest values to less than 5% at high , and in the muon channel it is less than 3.2% (1.7%) for values below (above) 600 GeV.
6 Systematic uncertainties
Systematic uncertainties arise from experimental sources affecting the lepton reconstruction and identification as well as the missing transverse momentum, from the data-driven multijet background estimate, from theoretical sources affecting the shape and normalization of background processes, and from the extrapolation of background estimates to high values.
Experimental uncertainties in the electron trigger, reconstruction, identification, and isolation efficiencies are extracted individually from studies of and decays in the data using a tag-and-probe method [9]. These studies also yield uncertainties in the electron energy scale and resolution [9]. Uncertainties in the muon trigger, reconstruction, identification, and isolation efficiencies are derived from studies of and decays in the data [48]. The muon momentum scale and resolution uncertainties are extracted from those studies as well as from special chamber-alignment datasets with the toroidal magnetic field turned off [48]. Extrapolation uncertainties toward higher are based on the above studies as well as on the simulation. The impact of those uncertainties is generally small due to the limited dependence of the efficiencies, except for the high- muon reconstruction and identification efficiency. The latter is estimated from differences between data and simulation in the fraction of muons passing the requirement on the maximum allowed relative error in the charge-to-momentum ratio measurement. This uncertainty grows with the muon up to 35% (55%) for () at the highest values probed in this analysis; it becomes a dominant source of uncertainty at the highest values. Uncertainties in the reconstruction and calibration of jets are taken into account since those are input to the calculation. Finally, all uncertainties affecting electrons, muons, jets, and the soft term are propagated to the calculation. The jet energy resolution and soft term contributions have the largest impact at low , and their uncertainties are treated as fully correlated between the electron and muon channels. Uncertainties in the simulation of pileup contributions have little impact on the distribution and are thus neglected.
The uncertainty in the multijet background estimate includes the effect of varying the criteria used in the background-enriched sample selection, and changes in the fractions are propagated. As this background estimate is extrapolated with a functional fit at high values, the uncertainty includes the additional impact of variations in the fit range. In the electron channel, the uncertainty also includes a contribution from the variation of the functional form due to the larger multijet contribution at high in this channel. This extrapolation uncertainty dominates the overall background uncertainty at values above 3 TeV in the electron channel.
No theory uncertainty is applied to the signal. Uncertainties in the theory inputs used for the background estimation are evaluated as follows. One of the largest uncertainties affecting the dominant DY background comes from the use of 90% CL eigenvector variations for the CT14 NNLO PDF set. This uncertainty range encompasses the predictions based on the ABM12 [59], CT10 [22], MMHT14 [60], and JR14 [61] PDF sets. It also allows for a sufficiently robust range of predictions in the very high mass region (i.e. at high Bjorken-). In addition, a reduced set of CT14 NNLO PDF eigenvectors that preserves the potential mass-dependent shape changes is used in the limit-setting procedure. The PDF uncertainty is enlarged in specific mass regions to encompass the DY prediction based on the alternative NNPDF30 PDF set if this prediction lies outside the range from the CT14 NNLO eigenvector variations. A smaller PDF choice uncertainty is obtained in the muon channel at high values than in the electron channel because the significantly worse muon resolution causes migration of events from low values (where the PDF uncertainty is small) to high values. The uncertainty in the mass-dependent -factors used to correct the mass distributions to predictions at NNLO accuracy in is evaluated by simultaneously varying the renormalization and factorization scales up and down by factors of two. The largest change (up or down) at each mass value is then applied as a symmetric scale uncertainty. The EW correction uncertainty is taken to be the difference between the predictions obtained with either the multiplicative scheme or the additive scheme for the combination of higher-order EW () and QCD () effects. The DY cross-section prediction accounts for varying the strong coupling constant according to , a variation that corresponds to a 90% CL uncertainty range [25] that nevertheless has a small impact on the analysis. Although the cross-section uncertainty is only about 6% [62] and the corresponding impact on the total background is small, it is accounted for in the statistical analysis due the characteristic distribution shape for this background source. An -dependent uncertainty in the shape is also included. It corresponds to the remaining level of disagreement between the data and the simulation after the correction described in Section 3. This uncertainty is evaluated in a control region consisting of events with both an electron and a muon candidate, which is a region dominated by events. The diboson cross-section uncertainty is neglected due to its small impact on the analysis. However, the extrapolation uncertainty for the diboson background is included in the statistical analysis as it grows to become significant at higher values. This uncertainty is estimated by varying the range of values over which the fit is performed and by changing the functional form. The extrapolation uncertainty for the top-quark background is neglected due to its small impact.
The uncertainty in the integrated luminosity is 1.7% [63].
Table 2 summarizes the systematic uncertainties for the total background and signal in the electron and muon channels at values near 2 and 6 TeV. The values in Table 2 correspond to the uncertainties that are incorporated as input to the statistical analysis described in Section 7. Large uncertainties in the background yields near values of 6 TeV are obtained but those have little impact on the statistical analysis due to the small background expectation at such high values (e.g., the number of background events for TeV is 0.02 in the electron channel and 0.11 in the muon channel).
7 Results
The distributions in the electron and muon channels (Figure 1) provide the input data to the statistical analysis. This analysis proceeds as a multibin counting experiment with a likelihood accounting for the Poisson probability to observe a number of events in data given the expected number of background and signal events in each bin. The uncertainties are taken into account via nuisance parameters implemented as log-normal constraints on the expected event yields. The parameter of interest is the cross section . The combined fits to the electron and muon channels are performed taking correlations between the two channels into account.
The compatibility of the observed data with the background-only model is tested by computing a frequentist -value based on the profile likelihood ratio as the test statistic [64]. The -value corresponds to the probability for the background to yield an excess equal to or larger than that observed in data. In the electron channel, the lowest -value is obtained for GeV with a local significance of 2.8 standard deviations, corresponding to a global significance of 1.3 standard deviations when taking the look-elsewhere effect into account. In the muon channel, the lowest -value is obtained for GeV with local and global significances of 2.1 and 0.4 standard deviations, respectively. For the combination of the two channels, the lowest -value occurs for GeV with local significance of 1.8 standard deviations, and the corresponding global significance is standard deviations (i.e. the fluctuation in the data is smaller than the median of the distribution obtained with background-only pseudoexperiments). In all cases, the interpretation is performed in the context of the SSM.
Given that no significant deviation from the background expectation is observed, upper limits are set on following a Bayesian approach with a uniform and positive prior for the cross section. This choice of prior is the same as that used in previous searches [7, 8]. The marginalization of the posterior probability is performed using Markov Chain sampling with the Bayesian Analysis Toolkit [65]. Upper limits set at the 95% CL in the context of the SSM are presented in Figure 2 for the electron and muon channels individually as well as for their combination, assuming universal boson couplings to leptons. The combined results are provided in terms of boson decays into leptons of a single generation. The corresponding lower limits on the boson mass are summarized in Table 3. Weaker limits are obtained in the muon channel due to the lower signal acceptance times efficiency and the worse momentum resolution at high .
The lower panels of Figure 1 show the ratio of the data to the background prediction before (middle panel) and after (lower panel) marginalization of the nuisance parameters, with the latter resulting from the combined fit to the electron and muon channels. A difference in event yields is observed at low values for both the electron and muon channels, although it remains within the range of uncertainty before marginalization. This difference decreases after marginalization, with the largest deviations from nominal values occurring for the jet energy resolution and track soft term nuisance parameters. The latter includes a significant model dependence found by comparing the predictions from the Powheg-Box, MadGraph5_aMC@NLO [66], and Sherpa event generators, with the first two interfaced with Pythia 8 for parton showering and hadronization.
The results displayed in Figure 2 are obtained with the full signal line shape from the SSM with no interference between the signal and the SM DY background. If the signal line shape is restricted to the peak region by the requirement , the interference effects in the low-mass tail of the distributions are largely suppressed and the observed (expected) mass limits become weaker by 270 (100) GeV in the electron channel and 30 (90) GeV in the muon channel, relative to the mass limits shown in Table 3. The requirement is applied at the event generator level, considering charged leptons before final-state radiation.
Limits are provided for the production of a generic resonance with a fixed value. For these results, fiducial cross-section limits are obtained with a requirement that removes the low-mass tail: . The region below coincides with the lower- region where the background is large and the sensitivity to signal contributions is reduced. The observed 95% CL upper limits on the fiducial cross section for with different choices of from 1% to 15% are shown in Figure 3. Less stringent limits are obtained for larger resonance widths since a larger fraction of the signal occurs in the low- tail where the background is higher. The cross section upper limits obtained in the fiducial region are lower than the ones obtained in the full phase space, in particular at high where the total cross section has a large contribution from outside the fiducial region due to the low- tail. The lower values of the cross section limits do not indicate that the fiducial limits exclude a broader set of models, as corresponding theoretical predictions are also lower in the fiducial than in the total phase space.
To facilitate further interpretations of the results, model-independent upper limits are also provided for the number of signal events in single-bin signal regions obtained by varying the minimum value in the range between 130 (110) GeV and 5127 (5127) GeV in the electron (muon) channel. These limits are translated into limits on the visible cross section computed as , where is the integrated luminosity. The visible cross section corresponds to the product of cross section times acceptance times efficiency and the observed 95% CL upper limits vary from 4.6 (15) pb at (110) GeV to 22 (22) ab at high in the electron (muon) channel as shown in Figure 4. Further details about these model-independent limits are available in the Appendix.
8 Conclusion
A search for a heavy resonance decaying into a charged lepton and a neutrino is carried out in events with an isolated electron or muon and missing transverse momentum. The data sample corresponds to 139 fb*-1* of collisions at TeV collected in 2015–2018 with the ATLAS detector at the LHC. Events are selected with single-electron and single-muon triggers, and the transverse mass computed from the lepton and the missing transverse momentum is used as the discriminating variable between signal and background contributions. The latter is dominated by Drell–Yan production of bosons. Monte Carlo simulation is used to estimate the normalization and shape of the distributions for signal and background events, except for the multijet background, which is derived from the data.
The observed distributions are found to be consistent with the background expectations, and upper limits are set on the cross section for , where the charged lepton is either an electron or a muon. Limits are also provided for the combination of the electron and muon channels. Lower limits of 6.0 TeV and 5.1 TeV on the boson mass are set at 95% CL in the electron and muon channels, respectively, in the context of the Sequential Standard Model. Fiducial cross-section limits are set on the production of resonances with different values ranging from 1% to 15%. To allow for further interpretations of the results, a set of model-independent upper limits are presented for the number of signal events and for the visible cross section above a given transverse mass threshold. These vary from 4.6 (15) pb at (110) GeV to 22 (22) ab at high in the electron (muon) channel.
Acknowledgments
We thank CERN for the very successful operation of the LHC, as well as the support staff from our institutions without whom ATLAS could not be operated efficiently.
We acknowledge the support of ANPCyT, Argentina; YerPhI, Armenia; ARC, Australia; BMWFW and FWF, Austria; ANAS, Azerbaijan; SSTC, Belarus; CNPq and FAPESP, Brazil; NSERC, NRC and CFI, Canada; CERN; CONICYT, Chile; CAS, MOST and NSFC, China; COLCIENCIAS, Colombia; MSMT CR, MPO CR and VSC CR, Czech Republic; DNRF and DNSRC, Denmark; IN2P3-CNRS, CEA-DRF/IRFU, France; SRNSFG, Georgia; BMBF, HGF, and MPG, Germany; GSRT, Greece; RGC, Hong Kong SAR, China; ISF and Benoziyo Center, Israel; INFN, Italy; MEXT and JSPS, Japan; CNRST, Morocco; NWO, Netherlands; RCN, Norway; MNiSW and NCN, Poland; FCT, Portugal; MNE/IFA, Romania; MES of Russia and NRC KI, Russian Federation; JINR; MESTD, Serbia; MSSR, Slovakia; ARRS and MIZŠ, Slovenia; DST/NRF, South Africa; MINECO, Spain; SRC and Wallenberg Foundation, Sweden; SERI, SNSF and Cantons of Bern and Geneva, Switzerland; MOST, Taiwan; TAEK, Turkey; STFC, United Kingdom; DOE and NSF, United States of America. In addition, individual groups and members have received support from BCKDF, CANARIE, CRC and Compute Canada, Canada; COST, ERC, ERDF, Horizon 2020, and Marie Sklodowska-Curie Actions, European Union; Investissements d’ Avenir Labex and Idex, ANR, France; DFG and AvH Foundation, Germany; Herakleitos, Thales and Aristeia programmes co-financed by EU-ESF and the Greek NSRF, Greece; BSF-NSF and GIF, Israel; CERCA Programme Generalitat de Catalunya, Spain; The Royal Society and Leverhulme Trust, United Kingdom.
The crucial computing support from all WLCG partners is acknowledged gratefully, in particular from CERN, the ATLAS Tier-1 facilities at TRIUMF (Canada), NDGF (Denmark, Norway, Sweden), CC-IN2P3 (France), KIT/GridKA (Germany), INFN-CNAF (Italy), NL-T1 (Netherlands), PIC (Spain), ASGC (Taiwan), RAL (UK) and BNL (USA), the Tier-2 facilities worldwide and large non-WLCG resource providers. Major contributors of computing resources are listed in Ref. [67].
Appendix
Model-independent upper limits are derived by applying the full event selection in a set of single-bin signal regions defined by the minimum value in the range between 130 (110) GeV and 5127 (5127) GeV, in the electron (muon) channel. These minimum values correspond to the bin boundaries of the distributions shown in Figure 1. The single-bin signal regions are defined in Tables 4 and 5. These tables also show the numbers of events observed in data and the expected numbers of background events.
The reference list from the paper itself. Each links out to its DOI / PubMed record.
- 1[1] Rabindra N. Mohapatra and Jogesh C. Pati “Left-right gauge symmetry and an “isoconjugate” model of CP violation” In Phys. Rev. D 11 , 1975, pp. 566 DOI: 10.1103/Phys Rev D.11.566 · doi ↗
- 2[2] G. Senjanovic and Rabindra N. Mohapatra “Exact left-right symmetry and spontaneous violation of parity” In Phys. Rev. D 12 , 1975, pp. 1502 DOI: 10.1103/Phys Rev D.12.1502 · doi ↗
- 3[3] N. Arkani-Hamed, A.. Cohen, E. Katz and A.. Nelson “The littlest Higgs” In JHEP 07 , 2002, pp. 034 DOI: 10.1088/1126-6708/2002/07/034 · doi ↗
- 4[4] Thomas Appelquist, Hsin-Chia Cheng and Bogdan A. Dobrescu “Bounds on universal extra dimensions” In Phys. Rev. D 64 , 2001, pp. 035002 DOI: 10.1103/Phys Rev D.64.035002 · doi ↗
- 5[5] Kaustubh Agashe et al. “LHC signals for warped electroweak charged gauge bosons” In Phys. Rev. D 80 , 2009, pp. 075007 DOI: 10.1103/Phys Rev D.80.075007 · doi ↗
- 6[6] Guido Altarelli, B. Mele and M. Ruiz-Altaba “Searching for new heavy vector bosons in p p ¯ 𝑝 ¯ 𝑝 p\bar{p} colliders” In Z. Phys. C 45 , 1989, pp. 109 DOI: 10.1007/BF 01556677 · doi ↗
- 7[7] ATLAS Collaboration “Search for a new heavy gauge-boson resonance decaying into a lepton and missing transverse momentum in 36 fb − 1 36 superscript fb 1 36\,\text{fb}^{-1} of p p 𝑝 𝑝 pp collisions at s = 13 Te V 𝑠 13 Te V \sqrt{s}=13\,\text{Te V} with the ATLAS experiment” In Eur. Phys. J. C 78 , 2018, pp. 401 DOI: 10.1140/epjc/s 10052-018-5877-y · doi ↗
- 8[8] CMS Collaboration “Search for high-mass resonances in final states with a lepton and missing transverse momentum at s = 13 Te V 𝑠 13 Te V \sqrt{s}=13\,\text{Te V} ” In JHEP 06 , 2018, pp. 128 DOI: 10.1007/JHEP 06(2018)128 · doi ↗