Next-to-leading order QCD corrections for single top-quark production in association with two jets
Stefan M\"olbitz, Le Duc Ninh, Peter Uwer

TL;DR
This paper calculates the next-to-leading order QCD corrections for single top-quark production with two jets at proton-proton colliders, providing improved theoretical predictions and distribution analyses.
Contribution
It presents the first detailed NLO QCD correction calculations for this process, including distribution results and scale uncertainty analysis.
Findings
QCD corrections increase cross sections by about 28% for top and 22% for anti-top at 13 TeV.
Theoretical uncertainties are around 5% due to scale variations.
QCD corrections exhibit non-trivial phase-space dependence.
Abstract
In this article we calculate the next-to-leading order (NLO) QCD corrections for single on-shell top-quark production in association with two jets at proton-proton colliders. The tW channel is assumed to be measured independently. The QCD corrections to the inclusive cross section are about 28 (22)\% for top (anti-top) quark production at the 13 TeV LHC. Theoretical errors are dominated by scale uncertainties, which are found to be around 5\% at NLO. Results for various kinematical distributions are also provided using a well-motivated dynamical scale. The QCD corrections are found to have a non-trivial dependence on the phase-space.
Click any figure to enlarge with its caption.
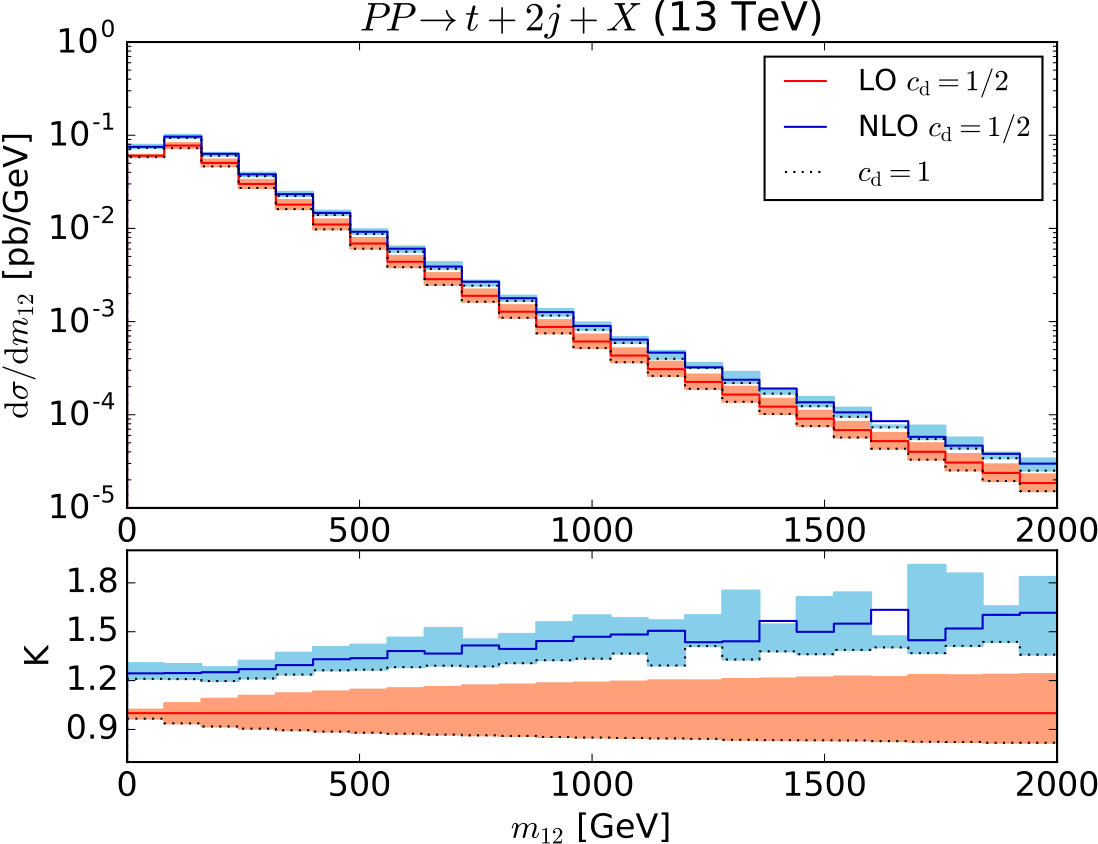 Figure 1
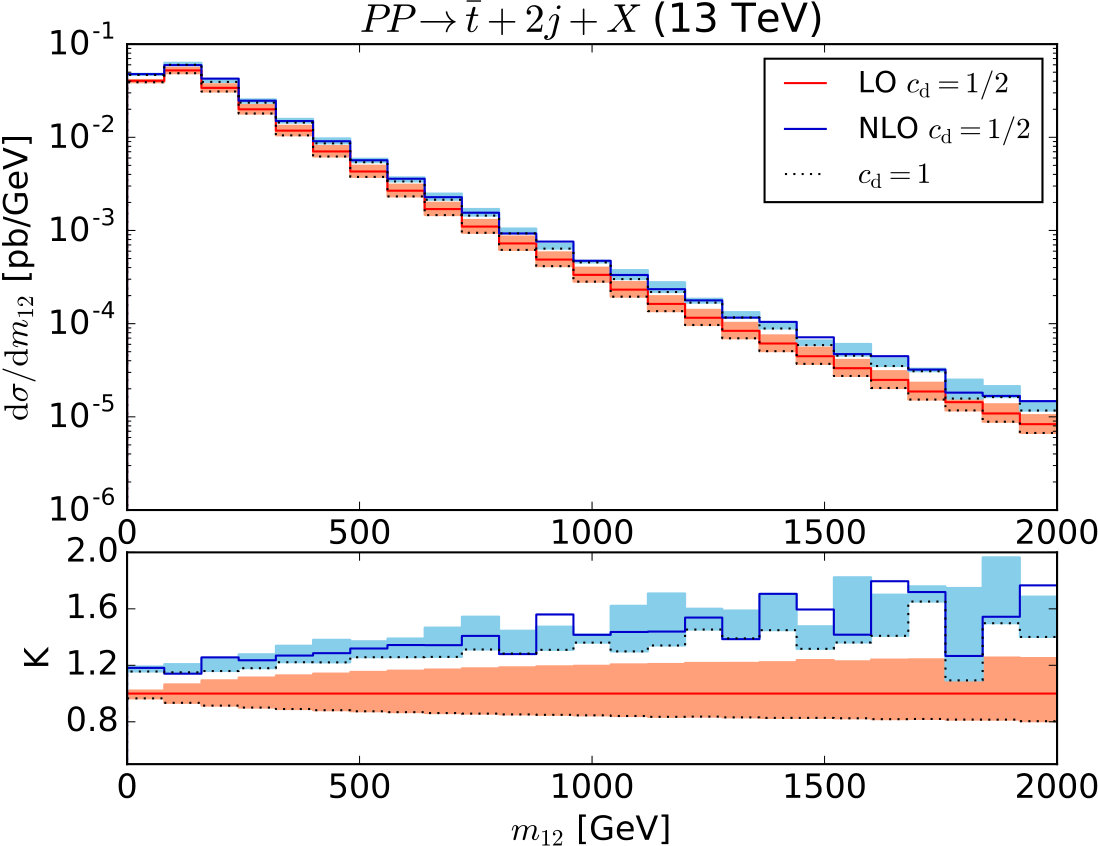 Figure 2
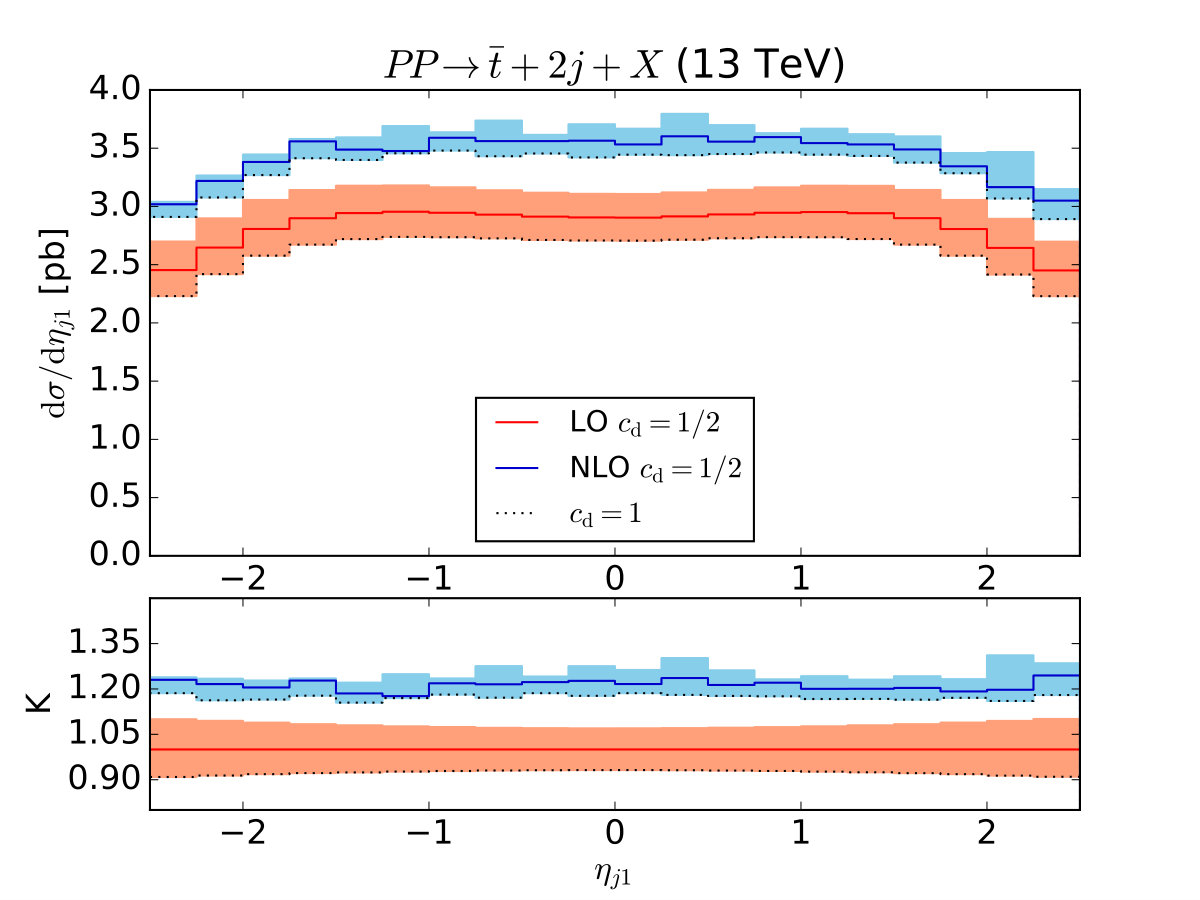 Figure 3
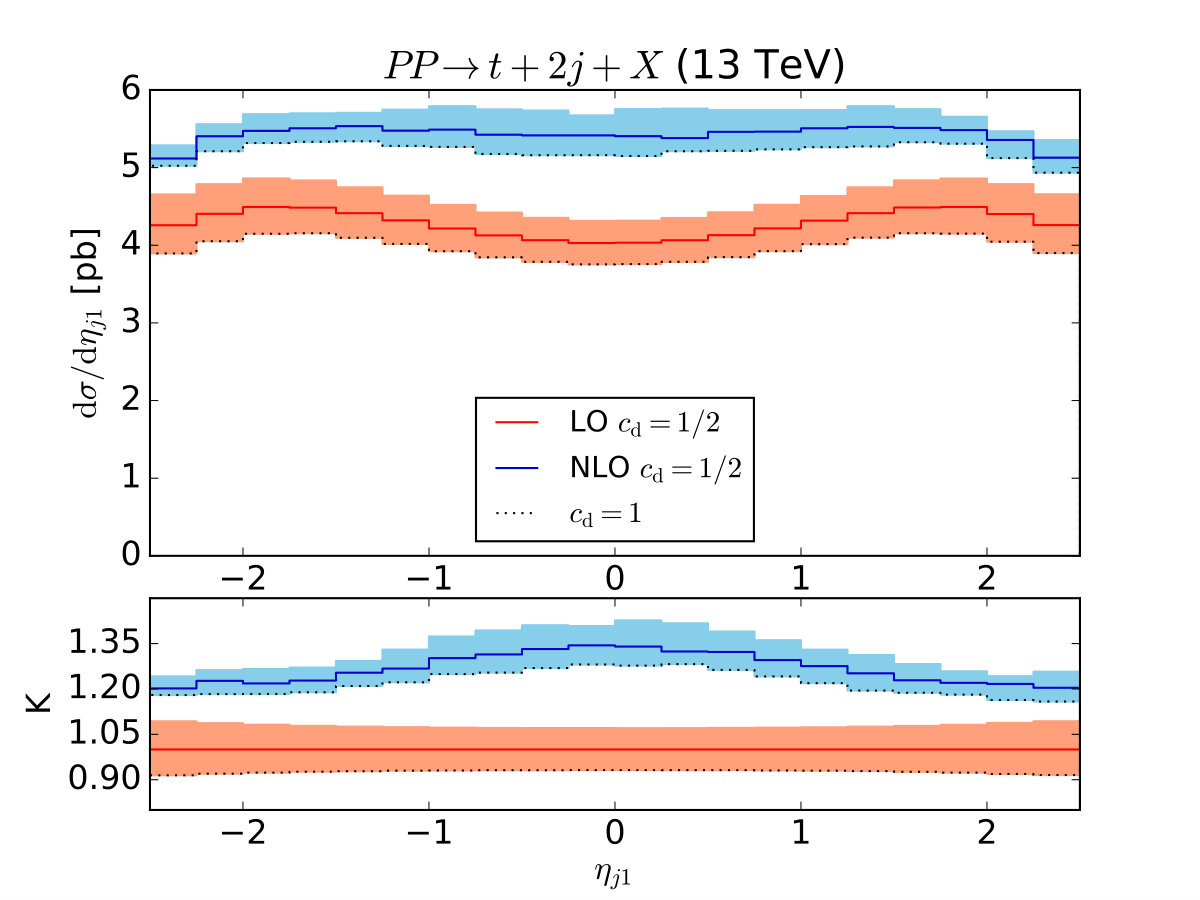 Figure 4
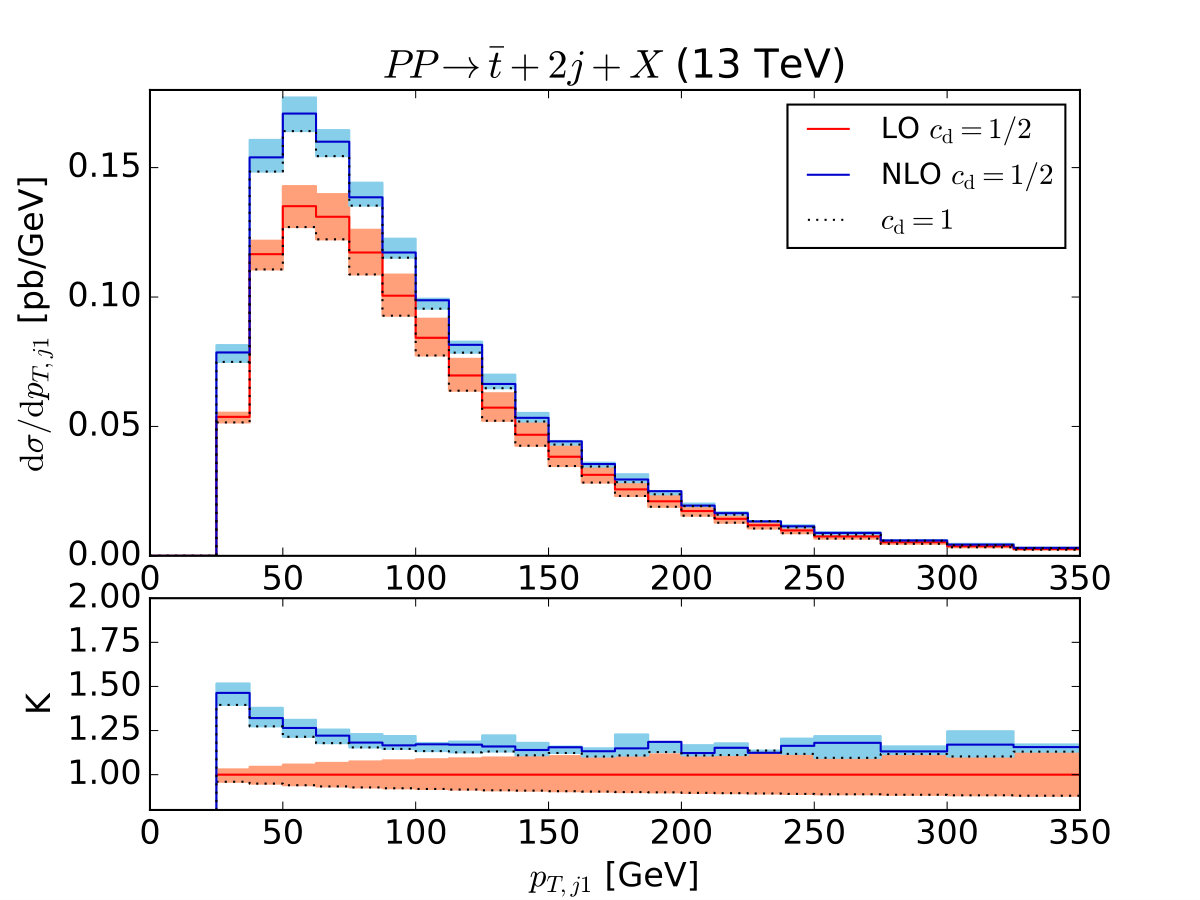 Figure 5
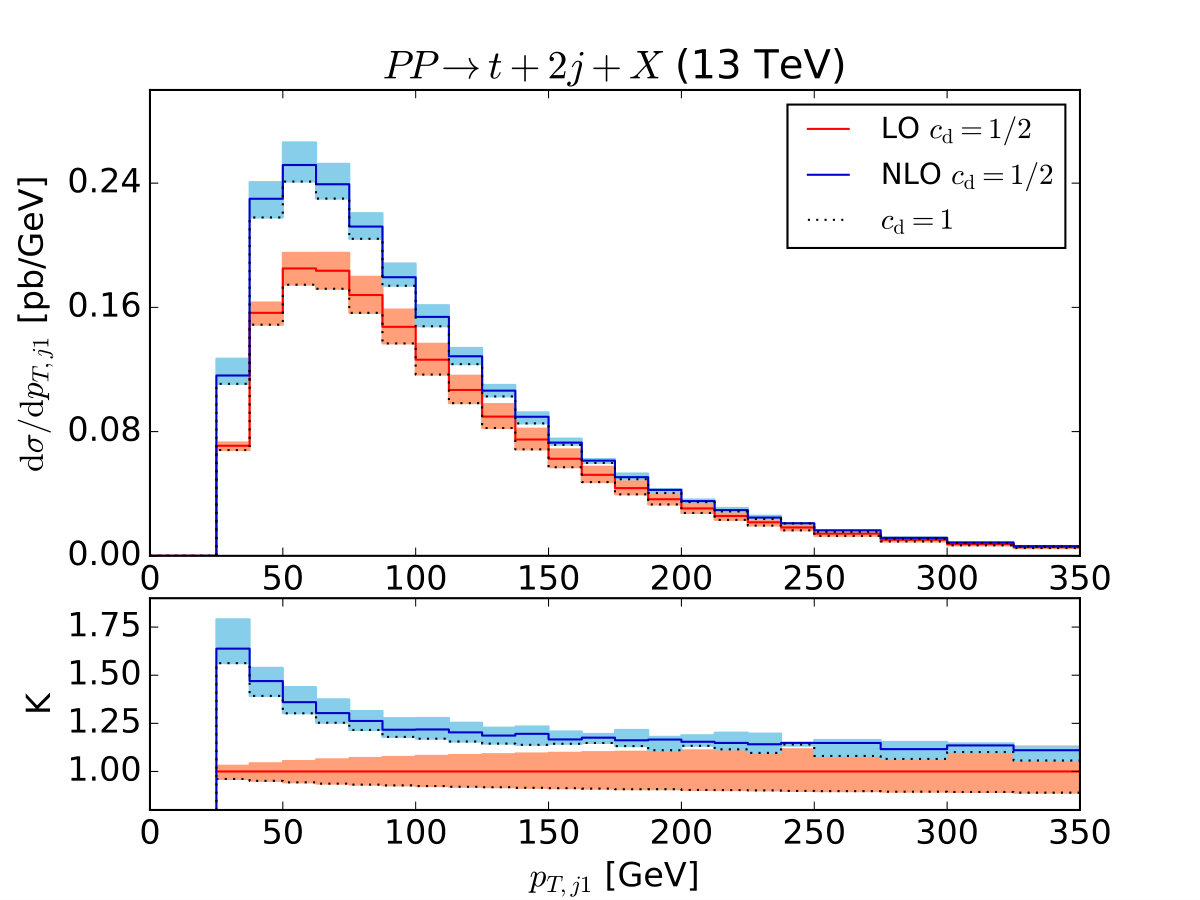 Figure 6
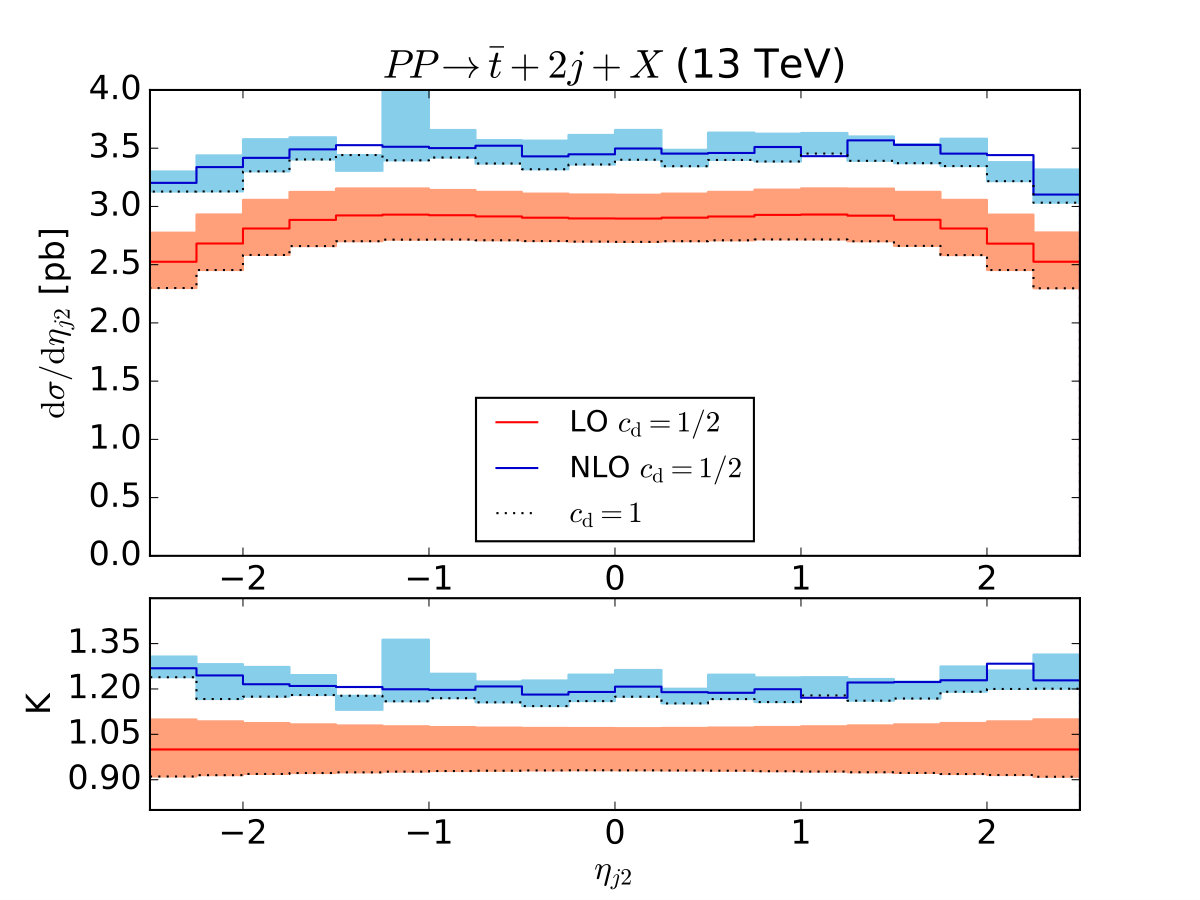 Figure 7
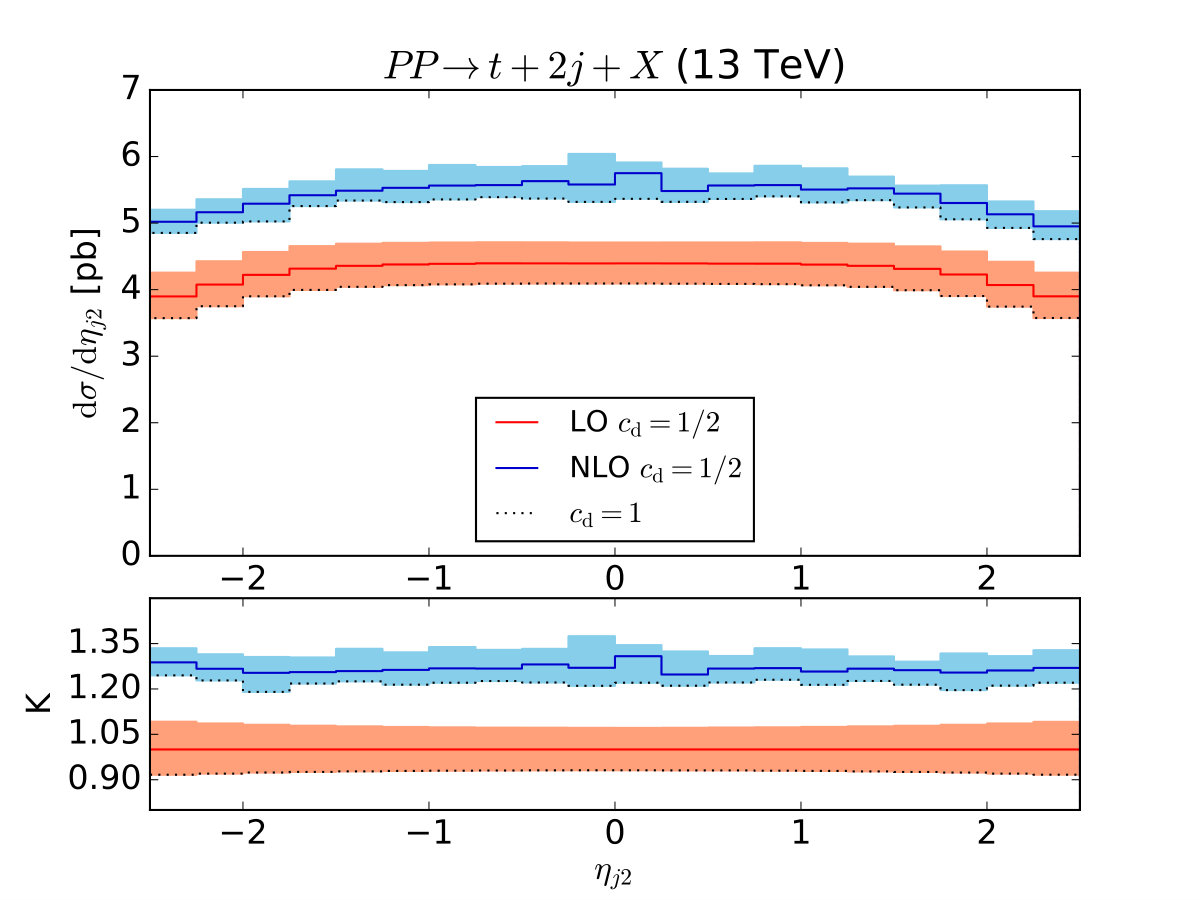 Figure 8
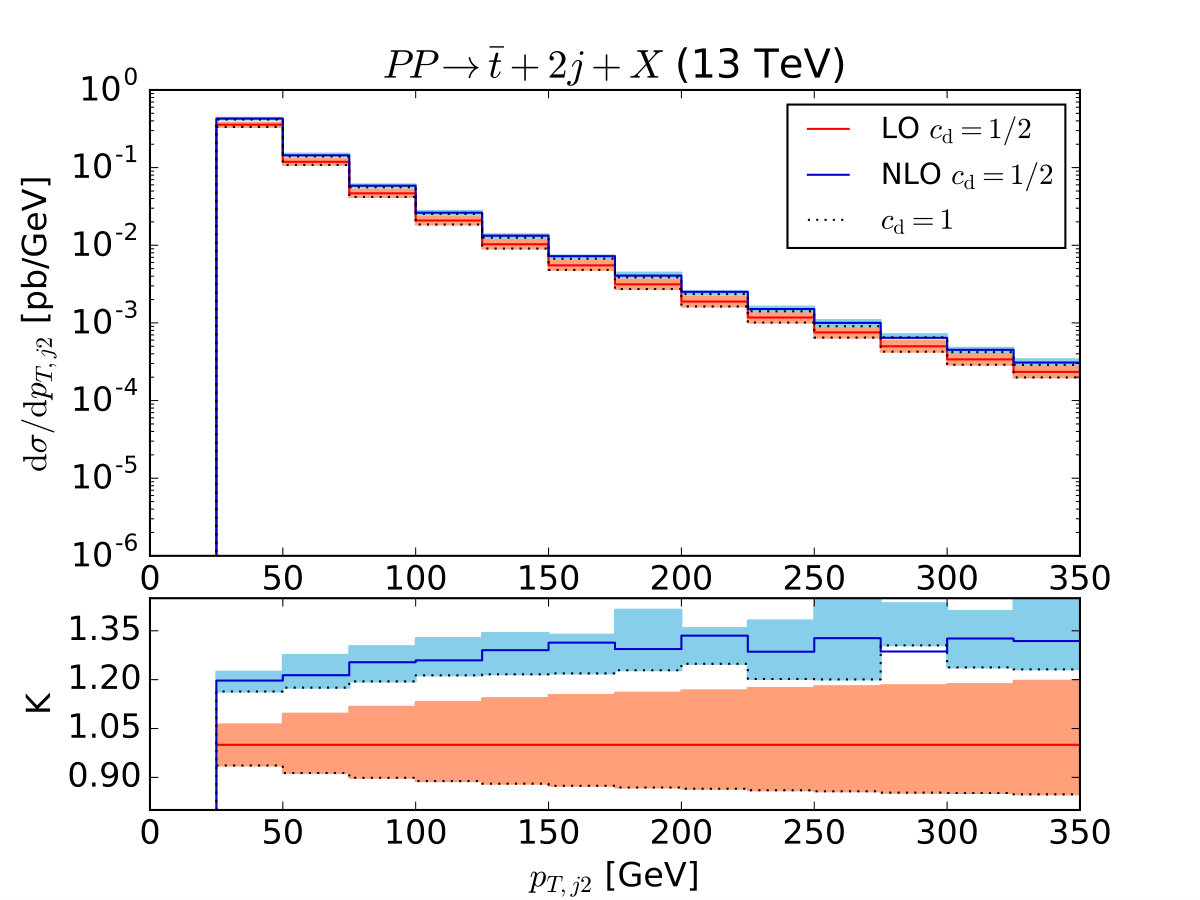 Figure 9
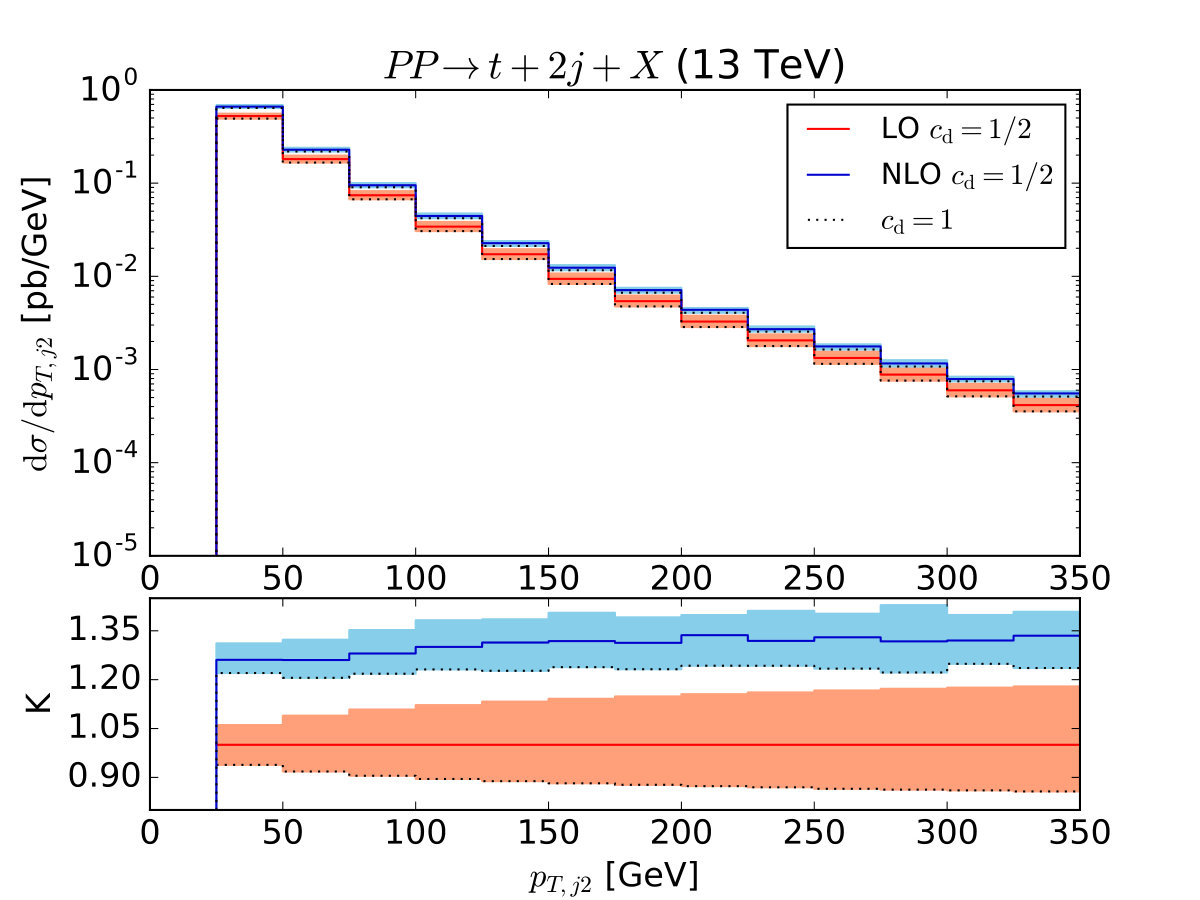 Figure 10
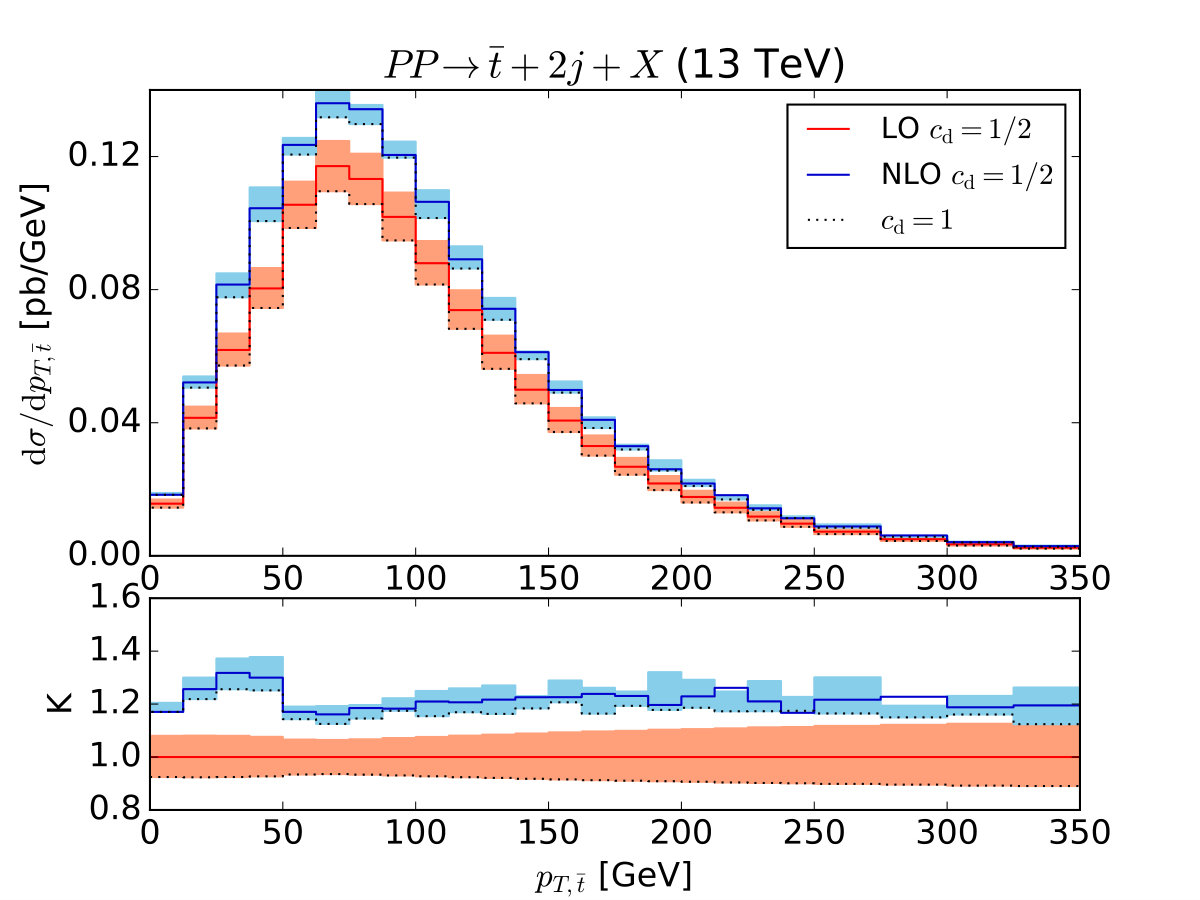 Figure 11
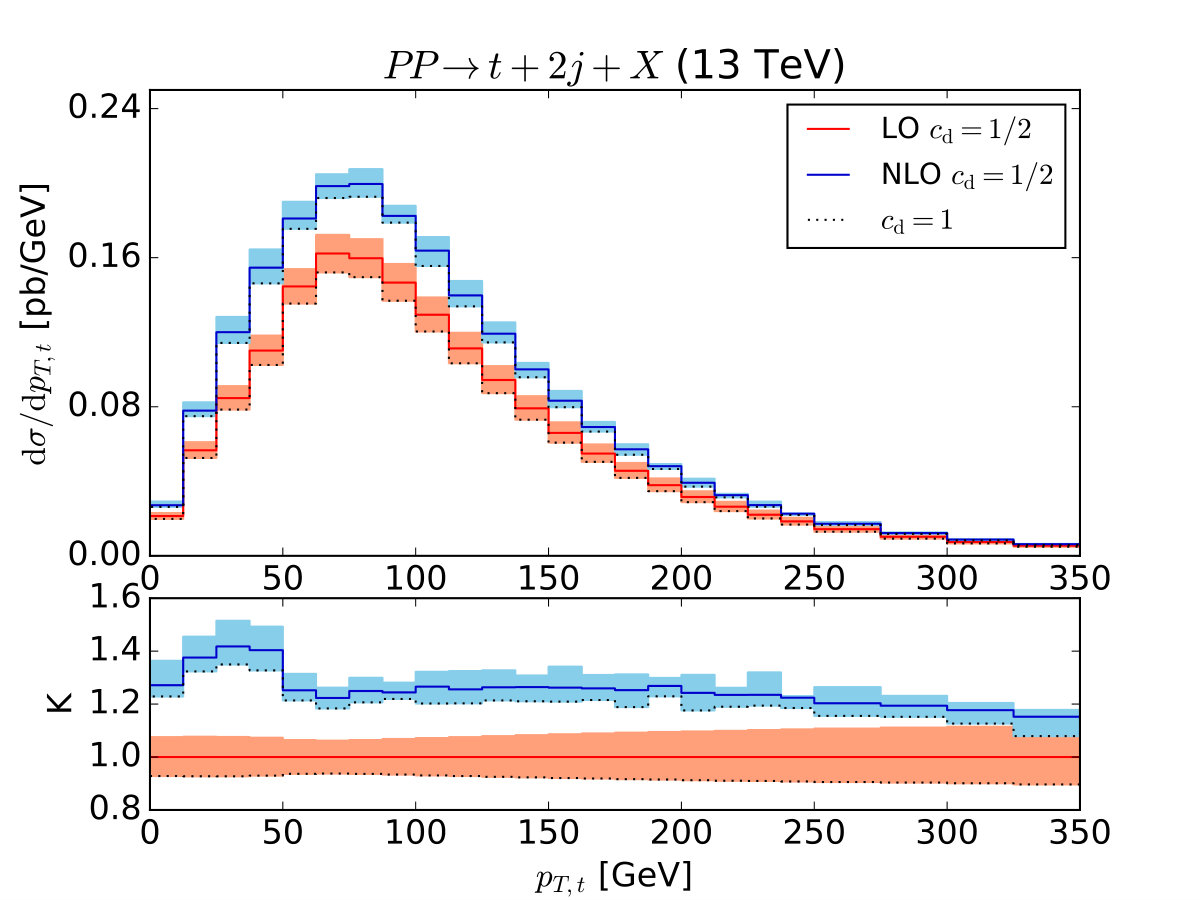 Figure 12
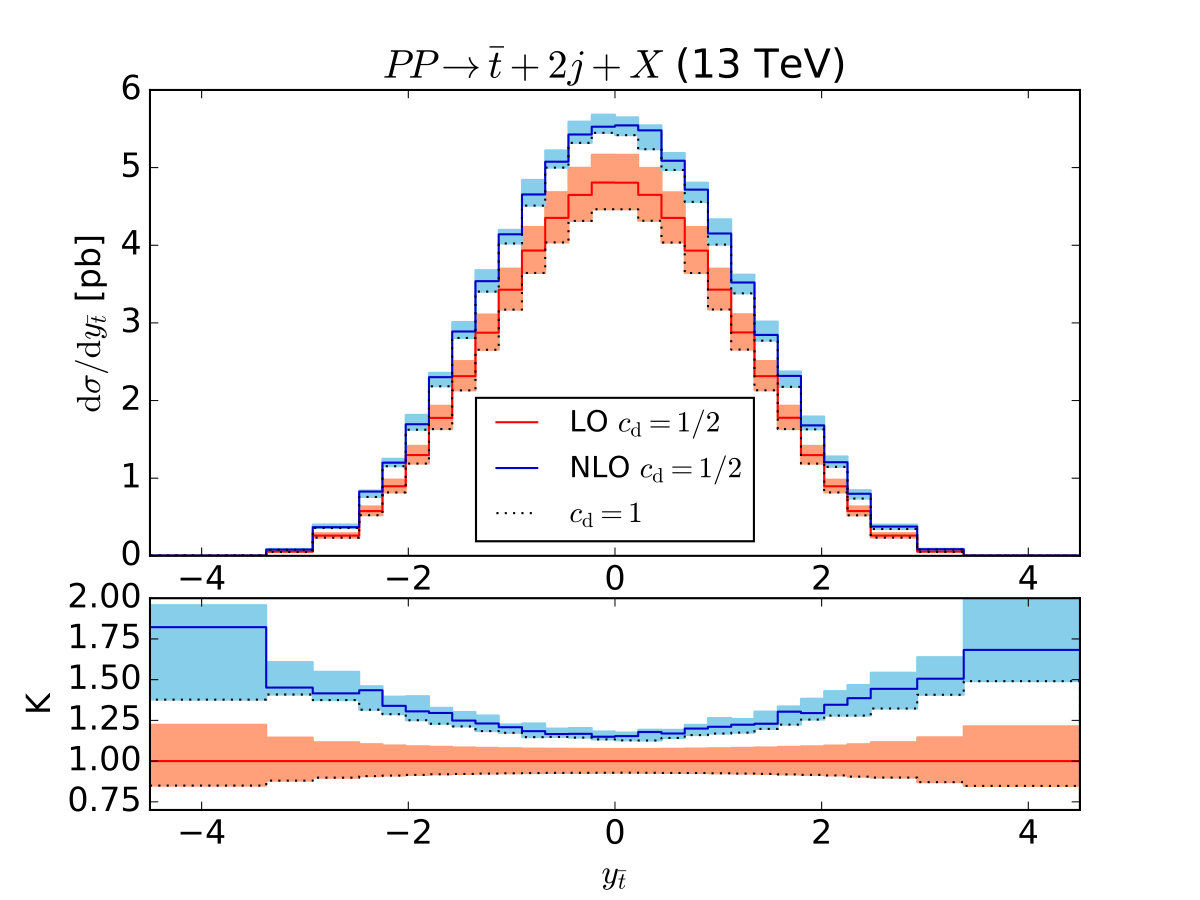 Figure 13
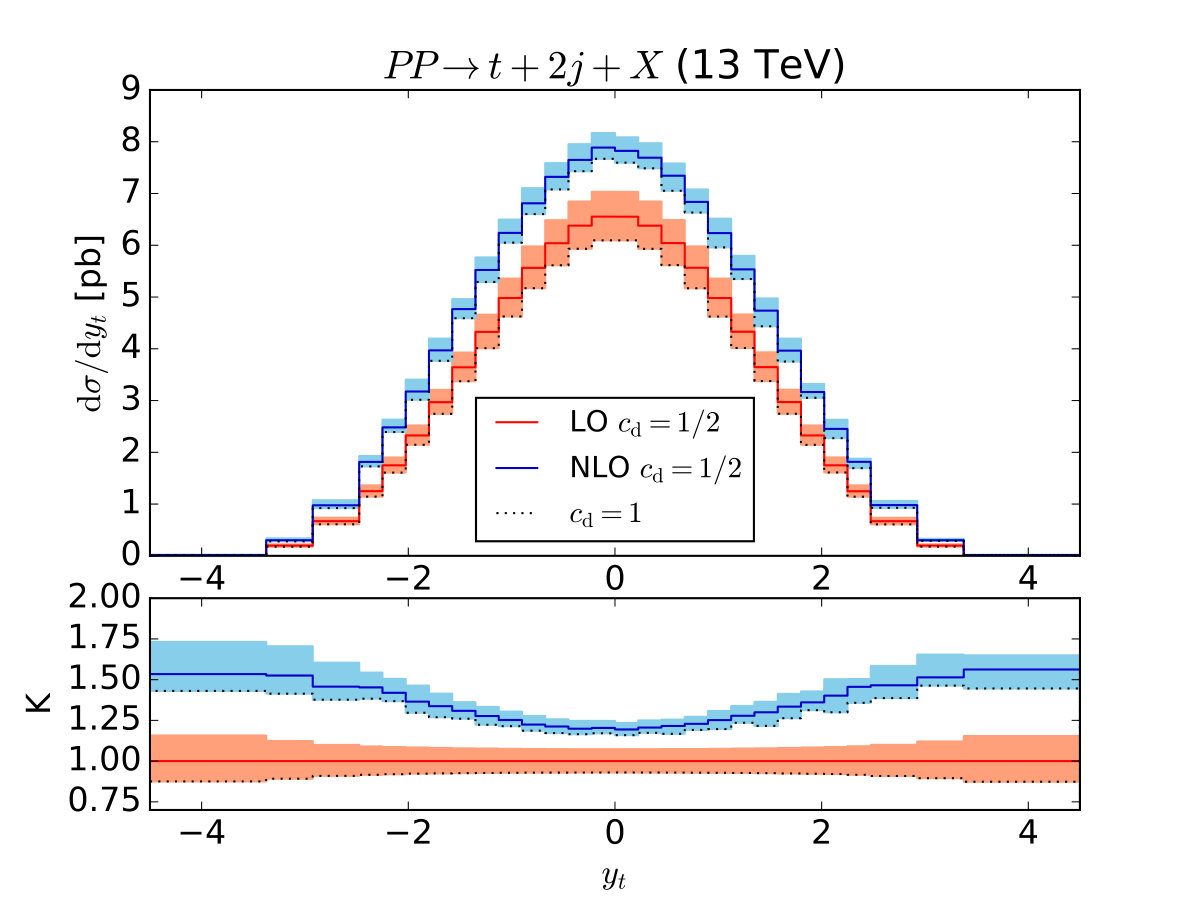 Figure 14
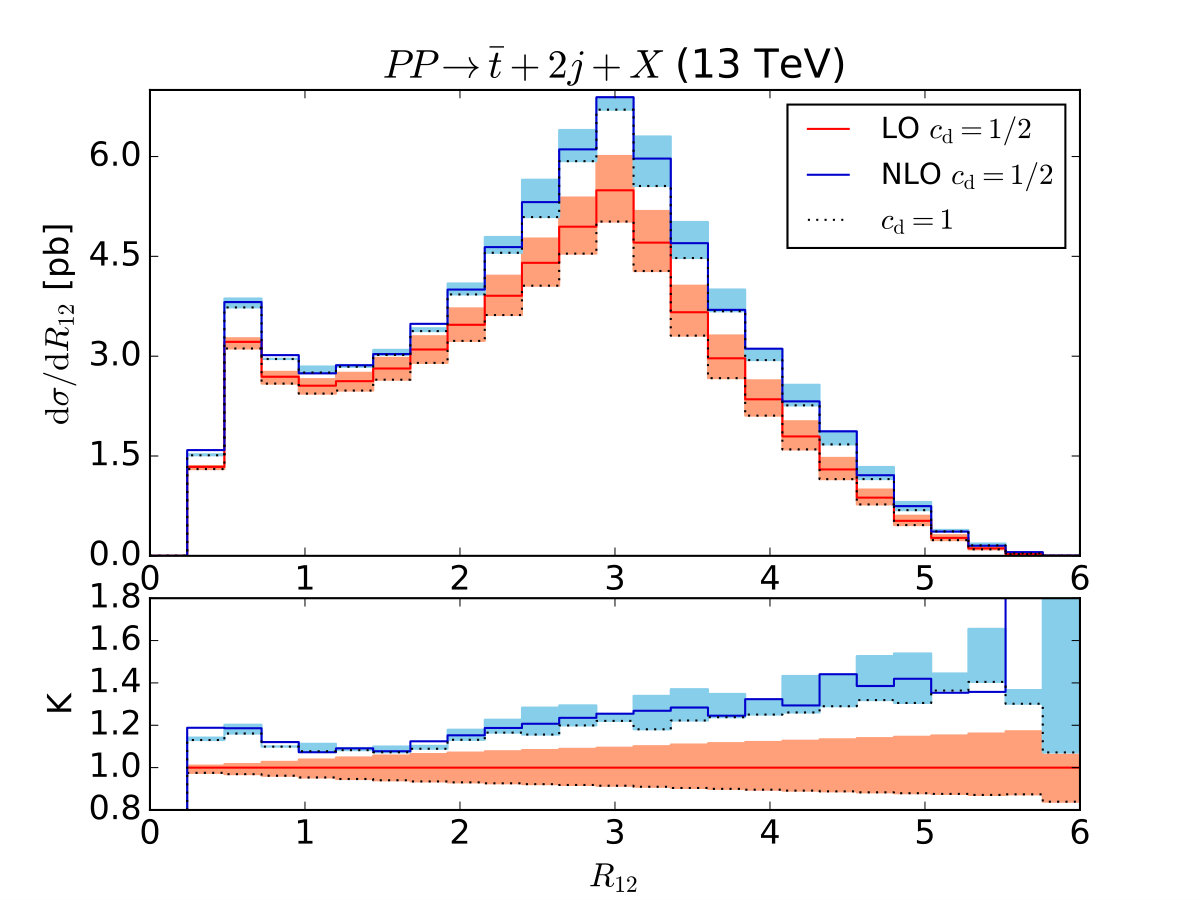 Figure 15
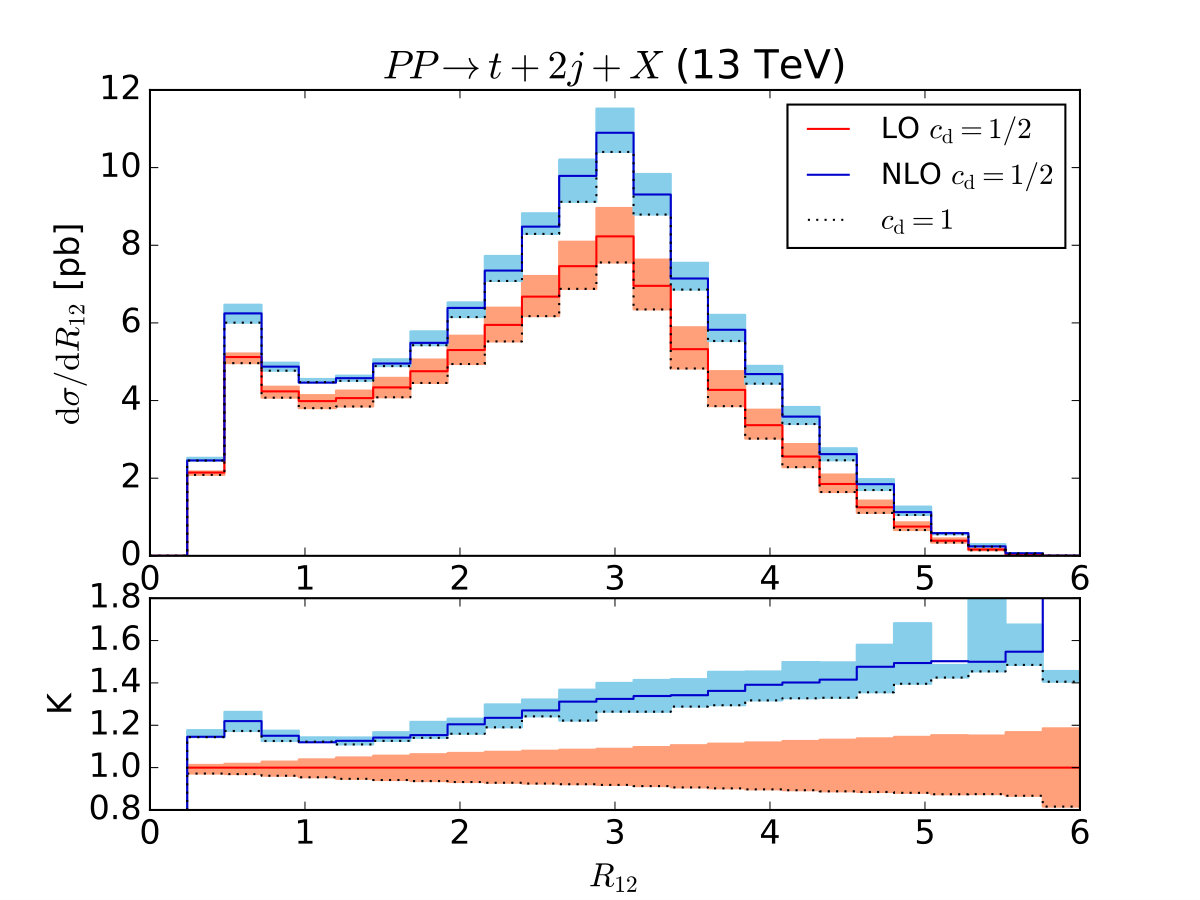 Figure 16
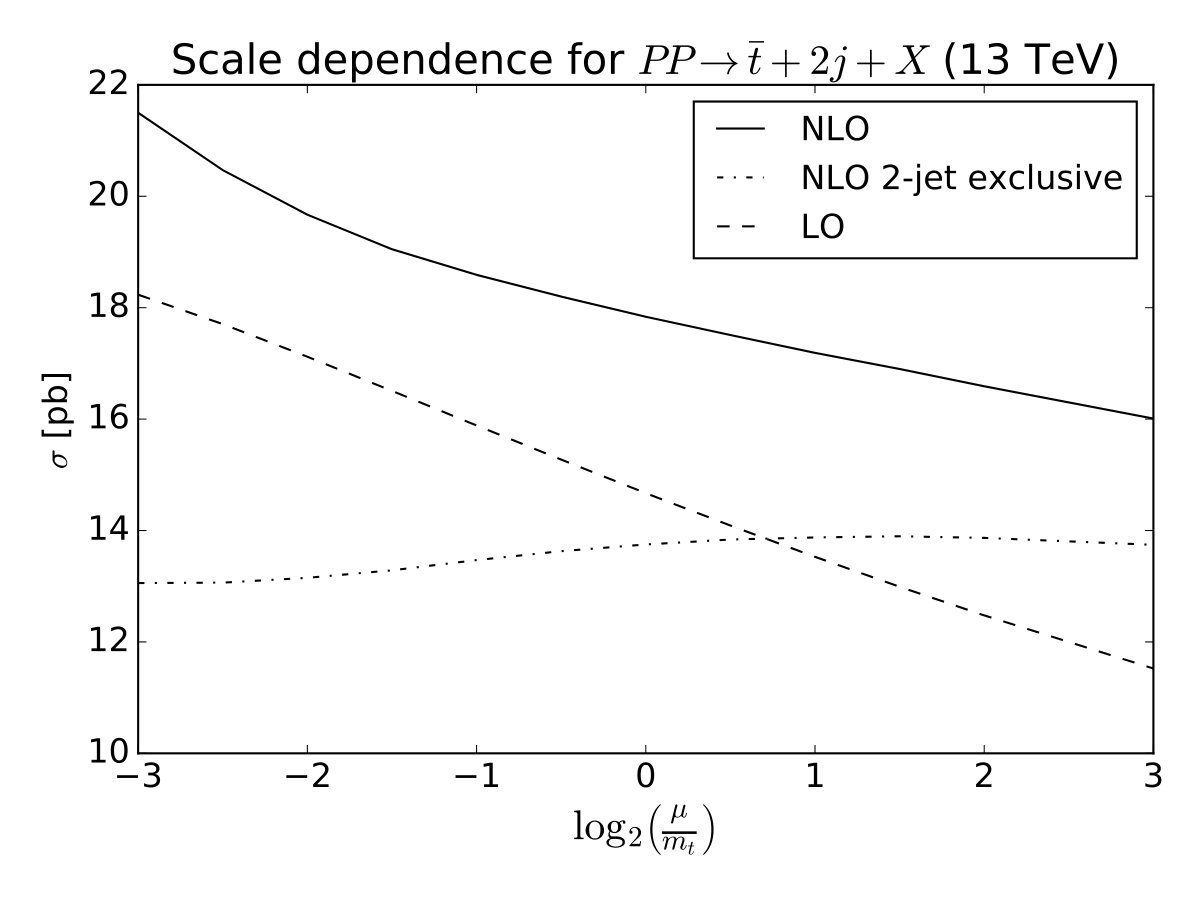 Figure 17
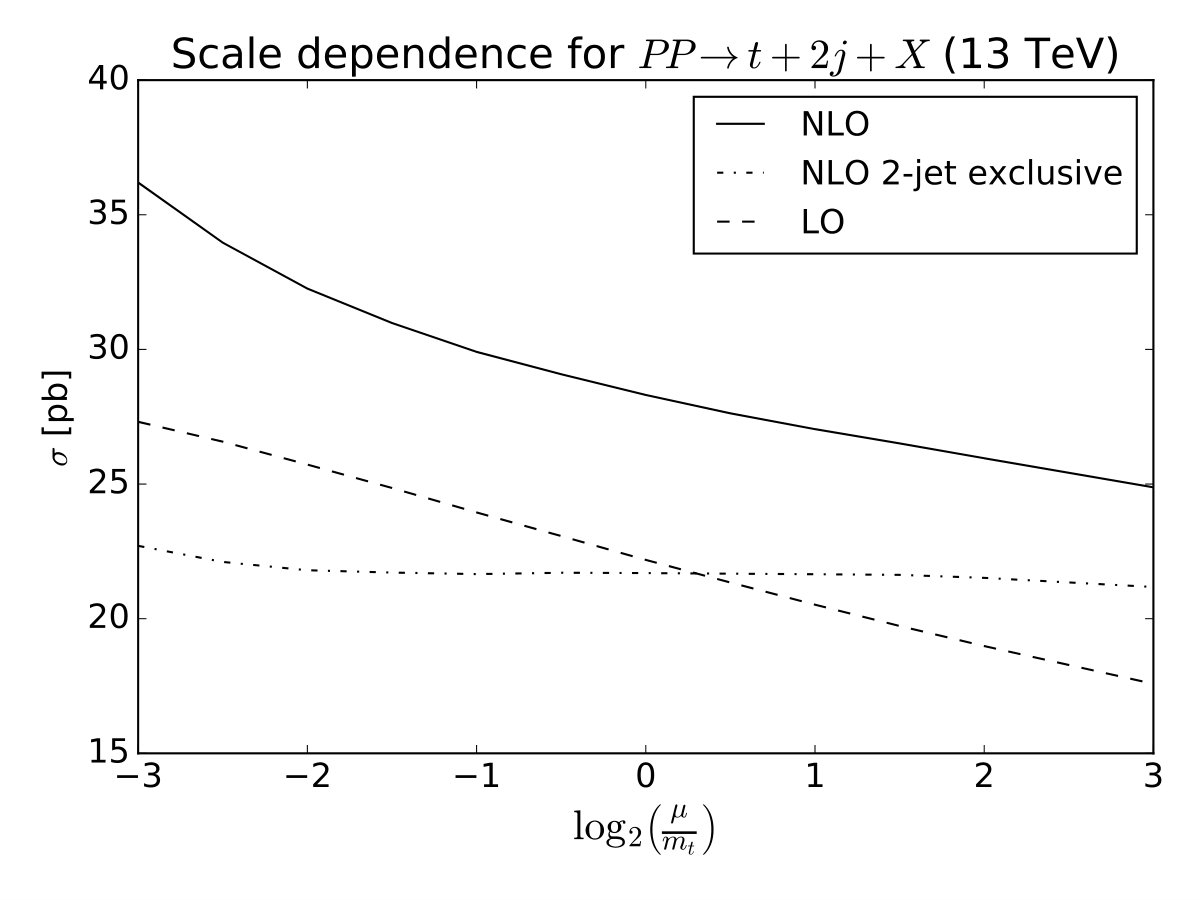 Figure 18
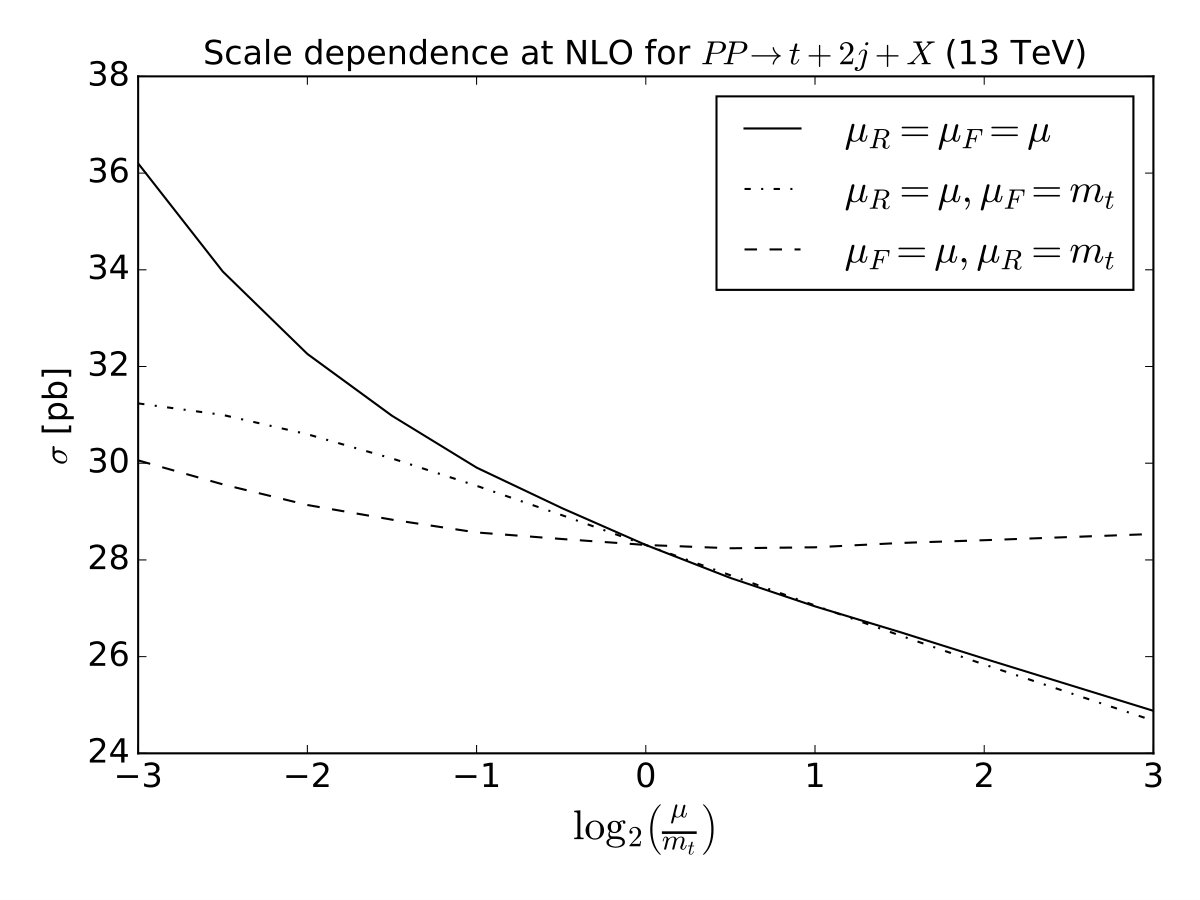 Figure 19
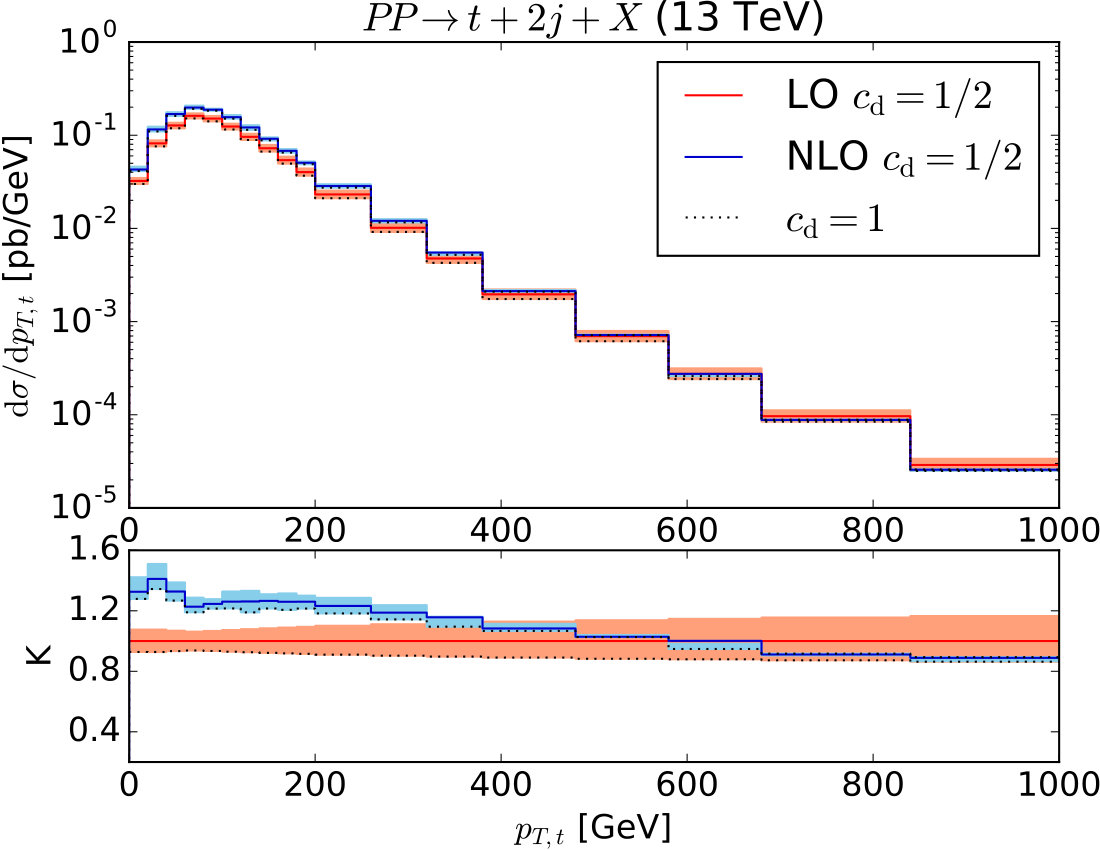 Figure 20
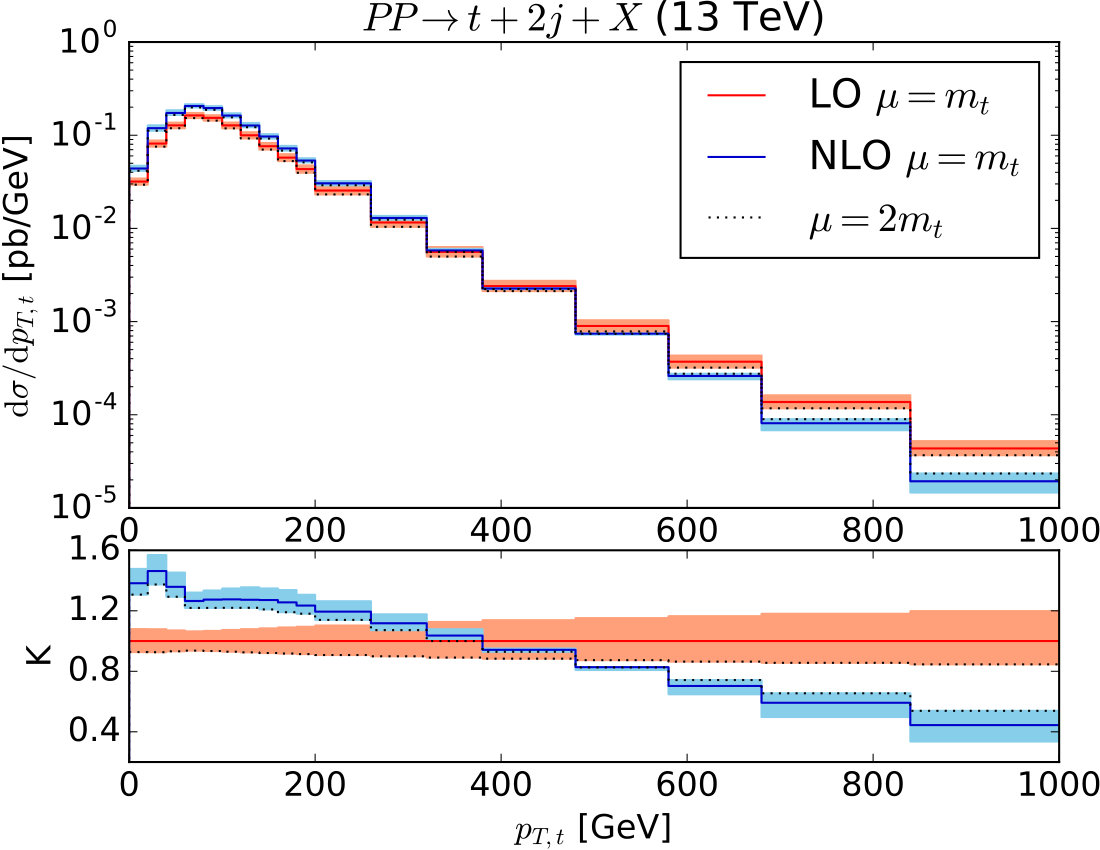 Figure 21
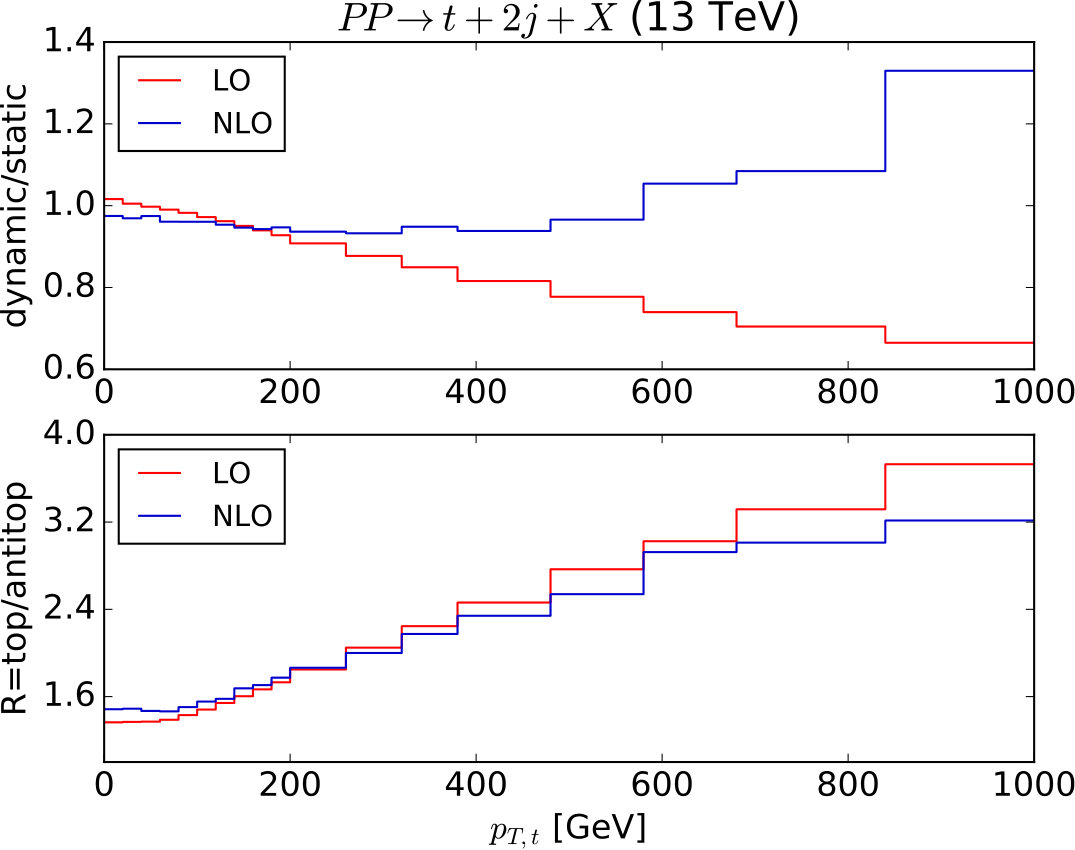 Figure 22
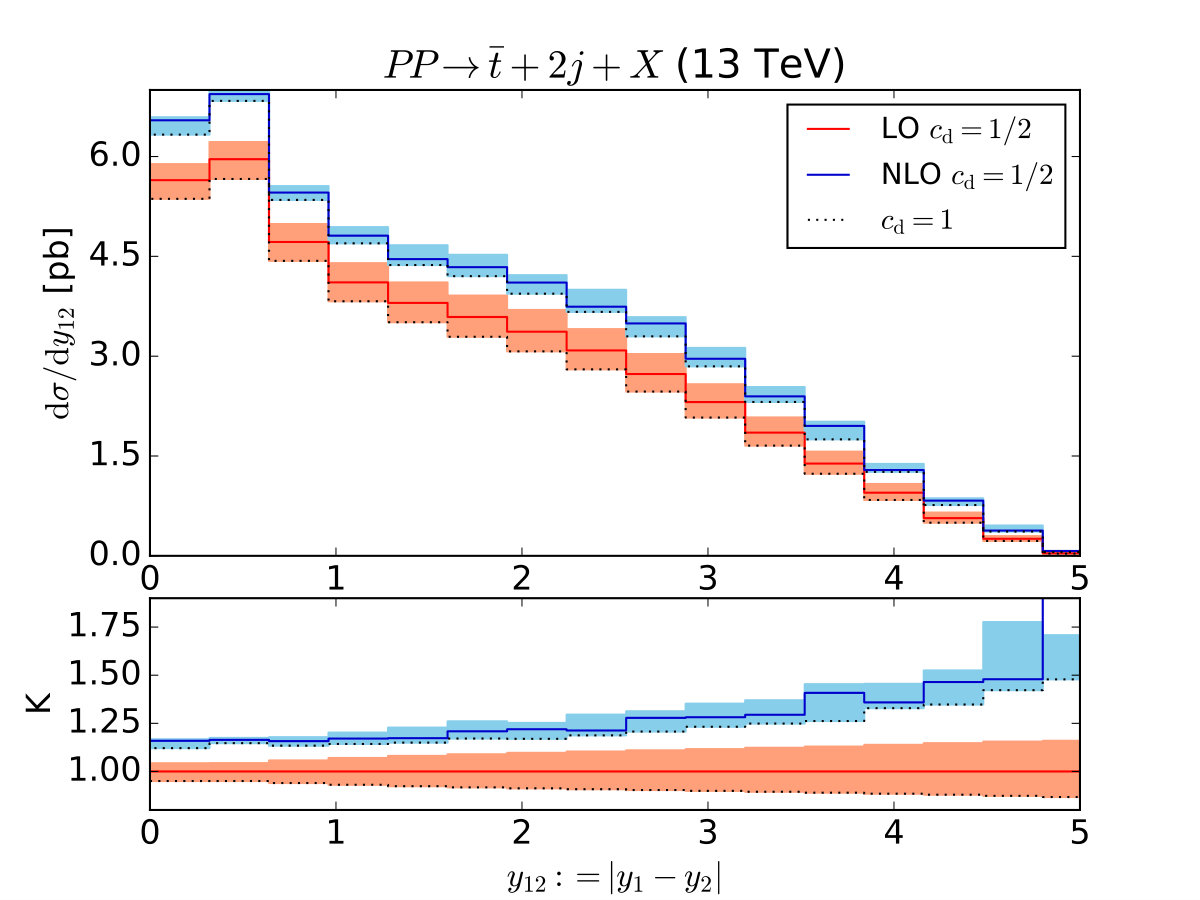 Figure 23
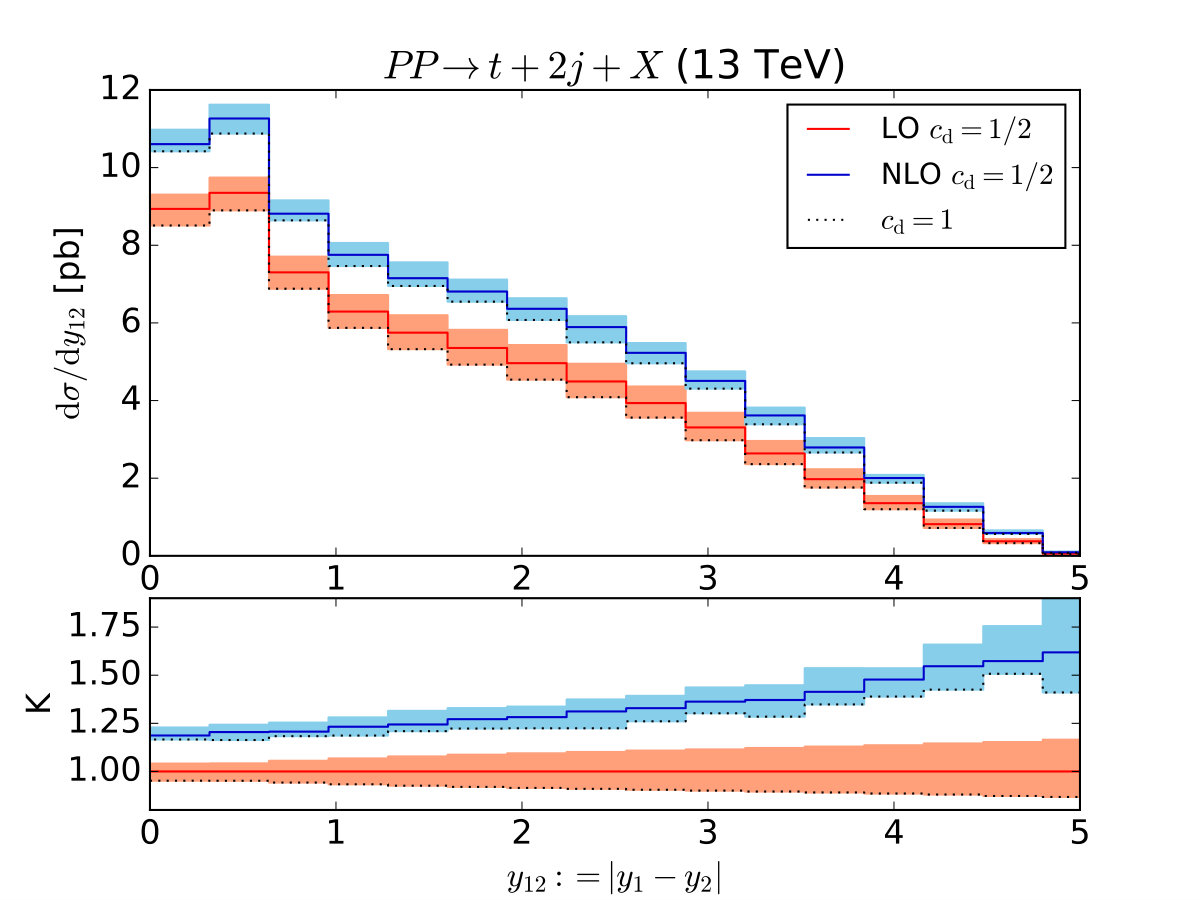 Figure 24
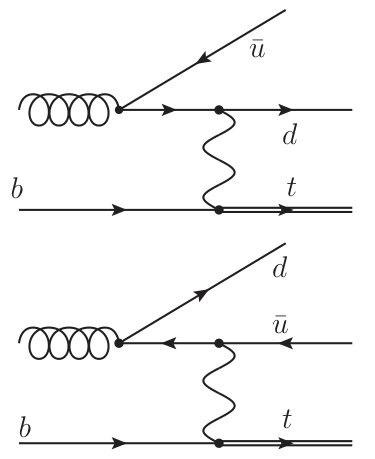 Figure 25
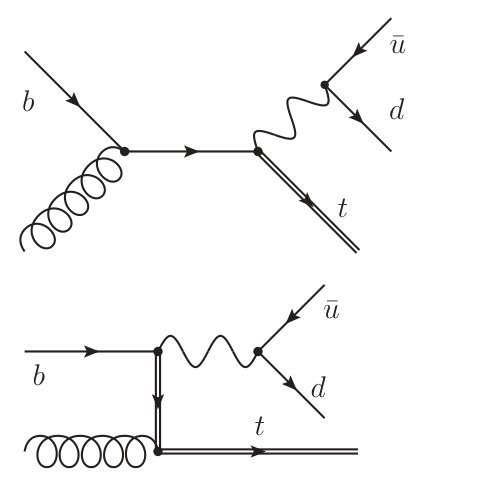 Figure 26
 Figure 27
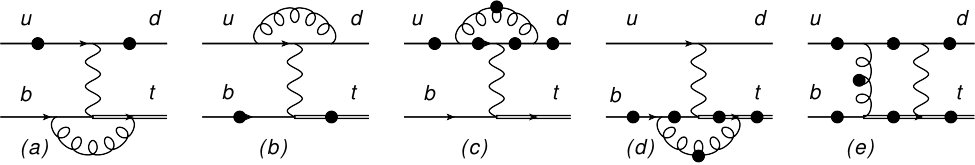 Figure 28
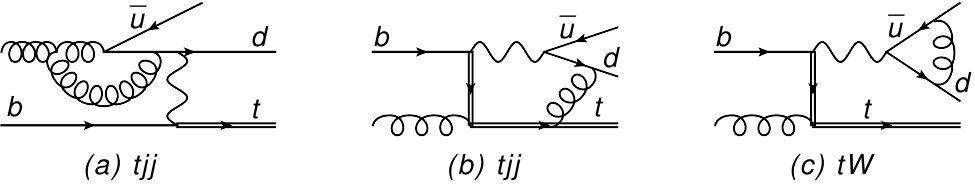 Figure 29
| [pb] | [%] | [%] | [%] | |
|---|---|---|---|---|
| 22.2 | ||||
| 14.7 | ||||
| 36.9 |
| [pb] | [%] | [pb] | [pb] | [%] | [pb] | |||
|---|---|---|---|---|---|---|---|---|
| 1.28 | ||||||||
| 1.22 | ||||||||
| 1.25 |
| [TeV] | [pb] | [pb] | [pb] | [pb] |
|---|---|---|---|---|
| 1 | |||||||
|---|---|---|---|---|---|---|---|
| [pb] | 18.38 | 19.83 | 21.40 | 23.06 | 24.74 | 26.26 | 22.20 |
| [pb] | 12.12 | 13.12 | 14.20 | 15.34 | 16.49 | 17.56 | 14.67 |
| [pb] | [%] | [pb] | [pb] | [%] | [pb] | |||
|---|---|---|---|---|---|---|---|---|
| 1.27 | ||||||||
| 1.21 | ||||||||
| 1.25 |
Peer Reviews
No public reviews on file for this paper yet. If you reviewed it on a platform where reviews are public (OpenReview, ICLR, NeurIPS, ICML), you can paste yours below so the community can read it here.
Videos
No videos yet. Explain this paper in a talk, walkthrough, or lecture? Add one.
aainstitutetext: Humboldt-Universität zu Berlin, Institut für Physik,
Newtonstraße 15, D-12489 Berlin, Germanybbinstitutetext: Institute For Interdisciplinary Research in Science and Education,
ICISE, 590000 Quy Nhon, Vietnam
Next-to-leading order QCD corrections for single top-quark
production in association with two jets
Stefan Mölbitz b
Le Duc Ninh a
Peter Uwer
Abstract
In this article we calculate the next-to-leading order (NLO) QCD corrections for single on-shell top-quark production in association with two jets at proton-proton colliders. The channel is assumed to be measured independently. The QCD corrections to the inclusive cross section are about 28 (22)% for top (anti-top) quark production at the 13 TeV LHC. Theoretical errors are dominated by scale uncertainties, which are found to be around 5% at NLO. Results for various kinematical distributions are also provided using a well-motivated dynamical scale. The QCD corrections are found to have a non-trivial dependence on the phase-space.
††preprint: HU-EP-19/16, IFIRSE-TH-2019-3
1 Introduction
Twenty-five years after its discovery many questions related to the top quark are still open, despite the tremendous progress made in recent years concerning the measurement of its mass and its interactions. Why is the top-quark the only quark with a natural Yukawa coupling to the Higgs boson of order one ? Why is it almost 35 times heavier than the next heavy quark, the -quark ? Are the top-quark’s weak interactions as in the Standard Model or does the top-quark play a special rôle in the electroweak symmetry breaking as predicted in many extensions of the Standard Model ?
The hadronic production of single top quarks allows to shed light on these questions. In particular, singly produced top-quarks provide an ideal laboratory to study the top-quark weak interactions. This is a major difference to top-quark pair production—with a roughly three times larger cross section, the dominant process for top-quark production in hadronic collisions—where the weak couplings are only accessible through the top-quark decay. Since most of the experimental effort in recent years was devoted to pair production, the top quark’s weak interactions are currently experimentally much less constrained through direct measurements than the top-quark strong interactions. A detailed study of single top-quark production offers the opportunity to fill this gap and to search for new physics. Furthermore, single top-quark production provides complementary information compared to top-quark pair production and allows studies not possible in top-quark pair production. While top quarks produced in pairs are to good approximation unpolarized (a tiny polarization is generated by QCD absorptive parts and weak corrections Bernreuther:1995cx ; Dharmaratna:1989jr ; Bernreuther:2010ny ), singly produced top quarks are highly polarized. Single top-quark production presents thus a unique source of polarized top quarks which can be used for detailed tests of the structure of the coupling to the boson and to constrain potential new physics. In addition, single top-quark production offers a direct handle to measure the Cabibbo-Kobayashi-Maskawa (CKM) matrix element —providing complementary information to indirect determinations based on unitarity.
Single top-quark production was first observed in proton–anti-proton collisions at the Tevatron Aaltonen:2009jj ; Abazov:2009ii . According to the virtuality of the boson occurring in the Born approximation, three different channels are distinguished: -channel production with ( denotes the four momentum of the boson), -channel production with , and the channel where the boson occurs in the final state. The -channel production is the dominant production process at the Tevatron and the LHC. At the Tevatron -channel production is the second important channel. The channel is suppressed at the Tevatron because of the limited collider energy of only 1.96 TeV. At the LHC the situation is reversed. The channel represents the second important channel while the -channel production is suppressed. Because of the challenging experimental environment and large backgrounds so far only evidence for -channel production has been reported by the ATLAS experiment Aad:2015upn .
For all three production channels the next-to-leading order (NLO) QCD corrections have been calculated Bordes:1994ki ; Stelzer:1997ns ; Stelzer:1998ni ; Harris:2002md ; Sullivan:2004ie ; Sullivan:2005ar ; Giele:1995kr ; Zhu:2002uj ; Smith:1996ij . While initially only the inclusive cross sections have been analyzed, later works include also results for differential cross sections. In addition, the effects of the top-quark decay and the parton shower were analyzed Campbell:2004ch ; Cao:2004ky ; Cao:2005pq ; Frixione:2005vw ; Campbell:2005bb ; Frixione:2008yi ; Re:2010bp ; Cao:2004ap . Based on soft gluon resummation, approximate next-to-next-to-leading order (NNLO) results have been published in Refs. Mrenna:1997wp ; Zhu:2002uj ; Kidonakis:2006bu ; Kidonakis:2007ej ; Kidonakis:2010ux ; Kidonakis:2010dk ; Kidonakis:2011wy . An important step towards full NNLO results has been made for -channel production in Refs. Brucherseifer:2014ama ; Berger:2016oht where NNLO results within the leading-color approximation are presented. Restricting the analysis to the leading-color contribution, the calculation of the NNLO corrections is significantly simplified, since the double box contributions, notoriously difficult to calculate, drop out. As a step beyond this approximation the reduction of the double-box topologies to master integrals has been performed in Assadsolimani:2014oga . However, the occurring master integrals are still unknown, although progress towards their evaluation has been made in Meyer:2016slj , where some of the integrals are studied as sample applications. Recently, the studies within the leading color approximation have been extended to include also the top-quark decay allowing to study single top-quark production fully differentially at the level of the decay products Berger:2017zof .
Already at next-to-leading order, real corrections with an additional jet in the final state start to contribute. In fact, a detailed study shows that a significant fraction of single top-quark events is produced with additional jet activity. Demanding a minimal of 25 GeV, about 30 % of singly produced top-quark events are produced in association with two jets. To make optimal use of the data collected at the LHC, precise predictions for single top-quark production in association with two jets are mandatory. For reliable theory predictions at least NLO QCD corrections are required. Furthermore, the NLO QCD corrections to single top-quark production in association with two jets contribute to single top-quark production at NNLO QCD and are thus required to extend the existing leading-color results. In this article, we present the NLO corrections to single top-quark production in association with two additional light jets. In principle, the NLO corrections can be produced with publicly available tools like for example MadGraph5_aMC@NLO MG5 or GoSam Cullen:2014yla . However, similar to single top-quark production the -channel production needs to be separated from the production, which requires to remove some of the Feynman diagrams contributing to the full amplitude. Furthermore, the NLO corrections to single top-quark production in association with two additional jets contribute to the NNLO corrections to the inclusive single top-quark production. With this application in mind, where a highly optimized execution might be crucial, we have decided to do the calculation by a direct evaluation of the Feynman diagrams and use GoSam only to partially cross check the results.
Let us mention that during the work on this project, similar results have been published in Ref. Carrazza:2018mix . In this article, the authors work in the leading color approximation which is for the concrete process equivalent to the so-called structure function approximation. The key ingredient is that the QCD corrections are studied independently for the two incoming quark lines. At the same time this approximation gives also a clear separation from other single top-quark processes since interference terms are color suppressed. In addition to the fixed order calculation within the leading-color approximation, the results are further improved using the MINLO approach Hamilton:2012np . We consider the results presented in Ref. Carrazza:2018mix as complementary to the ones presented here.
The outline of the article is as follows. In Section 2 we summarize the calculation and present some technical details. In Section 3 we describe the numerical input and present results for inclusive cross sections and various kinematical distributions. In addition we discuss the main uncertainties. We present a detailed discussion of the scale uncertainties and show the improvements using a dynamical scale. In Section 4 conclusions are given. In Appendix A we show additional results for the production of anti top quarks.
2 Calculation
We consider on-shell production of a single top quark in association with two jets in proton-proton collisions. We work in the five flavor scheme. The bottom quark is thus treated as massless and considered as part of the proton. We neglect the generation mixing terms in the CKM matrix since these contributions are further suppressed by the parton distribution functions. Employing the unitarity of the CKM matrix this approximation is equivalent to replace the CKM matrix by the identity matrix. Using the identity matrix for the CKM matrix leads to a CP invariant theory. It is thus sufficient to study top-quark production since the results for anti–top-quark production can be obtained from CP invariance.
Care must be taken to separate top-quark production in association with two jets from from the channel with subsequent hadronic decay of the -boson. The latter process leads to the same final state but is measured separately by the experiments. This issue is well known from single top-quark production. In leading-order the interference term between the two contributions vanishes and the individual contributions are gauge invariant. We assume that these contributions are small in next-to-leading order—in particular, when experimental cuts to separate the channel are applied. For a similar discussion we refer to Ref. Carrazza:2018mix where this approximation is used to justify the structure function approximation. Whenever we refer to the channel in the following, the contribution from on-shell production and subsequent decay is removed. More details will be given below.
2.1 Leading order
At LO, all subprocesses can be classified into two groups: with or without in the final state, where for the first two generations and capital letters are used to denote the generic up- or down-type light quarks. All subprocesses without in the final state belong to the channel.
For the remaining subprocesses, a light quark can either come from the initial gluon (see Fig. 1(a)) or from an intermediate boson (see Fig. 1(b)). The former diagrams belong to the channel, while the latter diagrams belong to the channel. As mentioned before the interference between the two contributions vanishes due to the different color structures. Moreover, since each group is separately gauge invariant, the -channel diagrams can be completely removed. Note that similar diagrams but with vertex (see Fig. 1(c)) are classified as part of the channel.
Technically, all amplitudes can be obtained via crossing of one sub-process, say . For the crossed channel , care must be taken to select only the diagrams which belong to the channel as explained above.
2.2 Next to leading order QCD
NLO QCD contributions include virtual and real-emission corrections. The real-emission processes have one additional parton in the final state. Because of this additional QCD emission, color factors of the and amplitudes become more involved and allow interference between the two contributions. Moreover, the channel, where a top quark decays into a boson and a bottom quark, can lead to the same final state of . Furthermore, the interference between the and the channels is also non-vanishing. Similar to what has been done for single top-quark production, these contributions have to be treated separately to account for the experimental analysis in which the three processes are analyzed independently. This can be done in a gauge invariant way by performing a pole expansion and keeping only non-resonant contributions. Assuming that experimental cuts will highly suppress these contributions, this corresponds in practice to dropping resonant diagrams like Fig. 2 (c). Care must be taken when additional radiation can lead in general to off-shell contributions and when on-shell contributions are only generated in certain phase space regions like for example in Fig. 2 (b). In this case the on-shell contributions can be extracted using the soft-gluon approximation Fadin:1993dz ; Melnikov:1995fx ; Beenakker:1997ir ; Dittmaier:2014qza in combination with the complex mass scheme Denner:1999gp ; Denner:2005fg ; Nowakowski:1993iu . It is well known that because of soft-collinear factorization real and virtual corrections cancel each other in the soft limit for sufficiently inclusive quantities (see for example Ref. Bernreuther:2015fts where this is shown for a concrete example). To approximate the non-resonant part of this contribution, we have combined the respective virtual corrections with the corresponding real corrections approximated through the -operator within the Catani-Seymour subtraction method. Even without applying further experimental cuts to suppress the channel, we find that this contribution gives only a tiny correction at the sub permille level and it can be safely dropped within the uncertainties of the final result. For the final results presented in Section 3 and Appendix A, this correction is nevertheless included.
We note that all Feynman diagrams for every subprocess can be classified in gauge-invariant groups. At LO, there are always two quark lines connected by a boson exchange. The two gauge-invariant groups correspond therefore to two cases: either the additional gluon is connected to the heavy-quark line (i.e. with the top quark) or to the light-quark line. When a virtual gluon exchange is added, five gauge-invariant groups arise. The virtual gluon can be attached exclusively to the light-quark line as in Fig. 3 (b,c) or to the heavy-quark line as in Fig. 3 (a,d). This makes four gauge-invariant groups. The remaining group corresponds to the case when there is color exchange between the two quark lines as in Fig. 3 (e) (see also Fig. 2 (b)). This group contains one-loop five-point integrals and is thus the most complicated one to calculate. Numerically, this group of diagrams is strongly suppressed and gives only a tiny contribution to the full result.
We have performed two independent calculations. For both calculations, the dipole subtraction method Catani:1996vz ; Catani:2002hc is used. The real-emission amplitudes are IR divergent in soft and collinear limits. These singularities have to be regularized and subtracted using subtraction terms before being integrated over the phase space in four dimensions. In this step, the and resonant diagrams are removed, hence interference effects with the channels are neglected. The subtraction terms are built from the reduced amplitudes keeping only the diagrams as for the LO contribution. These subtraction terms have to be added back in the form of integrated dipole contributions called and operators. The IR singularities in these operators are canceled by the corresponding ones in the PDF counterterms and in the virtual corrections.
The analytic results have been implemented in two different computer codes, one written in C++, the other in Fortran. Extensive cross-checks have been done. We have compared results at the amplitude level as well as results for the integrated cross sections and distributions. Within the numerical uncertainties perfect agreements between the two calculations have been obtained. Details about these comparisons are provided in Ref. Moelbitz2019QCD .
Before presenting the results we would like to provide further details of the calculation. In the C++ program, the scalar one-loop integrals are calculated using the libraries QCDLoop Ellis:2007qk and FF vanOldenborgh:1990yc . The -point tensor integrals are reduced to scalar integrals using the Passarino-Veltman method Passarino:1978jh for and the tensor-reduction library PJFRY Fleischer:2011zz for the cases . The library PJFRY uses the methods presented in Ref. Fleischer:2010sq . This calculation has been cross-checked with a reduction using Ref. Giele:2004iy and with GoSam GOSAM2014 . The amplitudes for the real corrections are obtained using MadGraph5_aMC@NLO MG5 . The phase space integration has been done using the Monte-Carlo integrator VEGAS Lepage:1978 .
In the Fortran program, scalar one-loop integrals are calculated using an in-house library LoopInts based on the techniques of Refs. tHooft:1978jhc ; Nhung:2009pm ; Denner:2010tr . -point tensor integrals are reduced to scalar integrals using the Passarino-Veltman method Passarino:1978jh for and Ref. Denner:2005nn for . LoopInts uses by default double precision, but will automatically switch to quadruple precision if numerical instabilities occur in the tensor-reduction. Helicity amplitudes are generated using the programs FormCalc Hahn:1998yk , FeynArts Hahn:2000kx , MadGraph-v4 Stelzer:1994ta which uses HELAS routines Murayama:1992gi . The operators required in the Catani-Seymour subtraction algorithm are implemented with the help of AutoDipole Hasegawa:2009tx . The integrator BASES Kawabata:1995th is used for the phase-space integration.
3 Phenomenological results
For the input values we use
[TABLE]
The masses of all light quarks, i.e. all but the top-quark mass, are set to zero. Partons are combined into jets using the anti- algorithm Cacciari:2008gp with the radius set to . We treat the top-quark as a stable particle and do not include the top-quark decay. We assume that the top-quark is always tagged and do not apply the jet-algorithm to the top-quark momentum. The momentum of the jet containing the top-quark is thus identified with the top-quark momentum. In addition, we impose the following cuts on the remaining jets:
[TABLE]
where denotes the transverse momentum and the pseudo-rapidity of the jet. For the parton distribution functions (PDF), we use the PDF4LHC15_nlo_100_pdfas set Butterworth:2015oua ; Dulat:2015mca ; Harland-Lang:2014zoa ; Ball:2014uwa ; Gao:2013bia ; Carrazza:2015aoa ; Watt:2012tq via the library LHAPDF6 Buckley:2014ana . For the QCD coupling constant the value provided by the PDF set, corresponding to () for the chosen PDF, is taken. The same PDF set is used for both LO and NLO results. We produce results for the LHC running at a centre-of-mass energy of .
3.1 Inclusive cross sections
Using the aforementioned setup we find in leading order for for the production of a single (anti)top-quark in association with two additional jets the cross sections shown in Table 1. The cross section for top-quark production is about 1.5 times larger than the cross section for anti top-quark production. We also show in Table 1 the uncertainties due to an imperfect knowledge of the PDF’s, the QCD coupling constant , and the top-quark mass. The PDF and uncertainties are calculated as defined in Ref. Butterworth:2015oua . Estimating the PDF uncertainties using the error PDF’s provided by the PDF set, we find an uncertainty of 1.7 % for top-quark production and a slightly larger uncertainty of 2.1% for anti top-quark production. For the uncertainties due to we find in both cases an uncertainty of 1.6%. The uncertainty due to a variation of the top-quark mass within the bounds allowed by the uncertainty in Eq. (1), leads to an effect of 0.8–0.9%—consistent with the naive expectation based on the mass dependence of -channel single top-quark production Kant:2014oha . In conclusion the numerical input is thus sufficiently well known to allow precise predictions of the cross section.
In Table 2 results for the cross section in NLO accuracy are given. The quoted values are for where denotes the factorization scale and the renormalization scale. As central scale the top-quark mass is used. The NLO corrections enhance the cross section by 22% in case of anti top-quark production and almost 30% in case of top-quark production. In Table 2 we have also included the effects due to a change of the central scale by a factor two up and down. The uncertainty is estimated by varying independently the two scales and as with and . The constraint is used to avoid ‘extrem’ scale ratios and associated potentially large logarithms. This limits the number of possible scale choices to seven (‘seven-point method’). To estimate the uncertainty we determine the maximal and minimal value for the cross section. As far as the leading order cross sections are concerned, this leads to an uncertainty of about 10%. The NLO corrections are thus significantly larger than the range covered by the leading-order scale uncertainties, showing that the scale variation does not provide a reliable uncertainty estimate for the specific cross section. As expected, the inclusion of the NLO corrections lead to a significant reduction of the scale uncertainty by roughly a factor two. Compared to the aforementioned uncertainties related to uncertainties of the PDFs, and , missing higher orders thus provide the dominant source of uncertainty.
In Fig. 4 the scale dependence of the inclusive cross sections at LO and NLO for single top-quark production in association with at least two additional jets is shown for the case . The two-jet exclusive cross section at NLO, where any additional jet activity is vetoed, is also shown. The difference between the inclusive and the two-jet exclusive cross sections gives the contribution of the three-jet events. Note that the latter is only predicted in LO accuracy. The corresponding plot for anti-quark production shows a similar behavior, see Fig. 12 in Appendix A. As can be seen in Fig. 4 even in NLO the cross sections show a scale dependence typical for a leading-order calculation. In particular, the scale dependence is not flat.
This is because at NLO new channels occur, including in particular subprocesses with two gluons. These new channels are numerically large and dominate the scale dependence. To illustrate this effect, the two-jet cross section where additional jet activity is vetoed is given. The veto suppresses the contribution from the new channels and leads to a significantly improved scale dependence of the two-jet exclusive cross section. However, this does not necessarily mean that the theoretical predictions for this observable are more precise. It is well known that the jet veto introduces an additional scale and can lead to additional uncertainties in particular in differential distributions. This is because the veto scale can lead to large logarithmic corrections which may spoil the convergence of the perturbative expansion if not resummed. For more details we refer to Ref. Stewart:2011cf .
In Fig. 5 we show results where only one of the two scales , is changed while the other is kept fixed. In the range the renormalization scale gives the dominant contribution to the scale dependence. This is consistent with the aforementioned observation that the scale dependence is dominated by new channels which occur for the first time in NLO. Only at rather low scales the factorization scale becomes important.
In Table 3 we show the cross section for different collider energies. In case of anti–top-quark production the -factor is only weakly dependent on the collider energy. In contrast, for top-quark production a significant raise of the -factor can be observed. As a consequence also the ratio of the two cross sections depends on the collider energy. At high energies the number of produced anti–top quarks increases with respect to the number of produced top quarks. This is because top-quark and anti top-quark production probe different PDF’s with a different energy dependence.
3.2 Kinematical distributions
For the evaluation of the inclusive cross section we used a fixed renormalization and factorization scale. While this is appropriate for the total cross section which is dominated by events with moderate momentum transfer, this is no longer true when distributions at high momentum transfer are studied. In the latter case numerically rather different energy scales can occur which may lead to large logarithmic corrections invalidating the naive use of perturbation theory. It is well known that in such cases a dynamical scale often improves the situation. For the process at hand, we use
[TABLE]
as dynamical scale, where is a constant which still needs to be fixed to a certain value. The above scale choice may be seen as a modification of often used. The top-quark mass occurring in the dynamical scale prevents the scale from becoming too small for low energies, since in this case the top-quark mass provides a cut-off and should be the relevant energy scale.
To find a reasonable value for the constant , we require that the inclusive cross section matches the one calculated with . In Table 4 LO results are provided, varying from to . The results show that is a good choice and reproduces roughly the results obtained with the fixed scale. We will therefore use hereafter this value to define the central scale .
In Table 5 we present NLO cross sections together with the associated scale uncertainties using the dynamical scale with . The scale uncertainties are estimated using and varying the dynamical scale by a factor 2 up and down. The results for the inclusive cross section are in good agreement with the results obtained for a fixed scale evaluated at . Note that, differently from the scale uncertainties presented in Table 2 where the seven-point method is used, the values in Table 5 are obtained using the three-point method where we identify and the two scales are varied together. This is done to be consistent with the distributions, where we use the three-point method to reduce the required computing time. The uncertainties agree reasonably well with the ones in Table 2.
In Fig. 6 we compare for the case of the -distribution of the top-quark the two different scale choices. The left-hand plot shows the result obtained with a fixed scale as used in the previous section. The right hand plot shows the same distribution using the dynamical scale.
Using the fixed scale the absolute value of the corrections increases for large transverse momentum signaling a break down of perturbation theory due to the appearance of the aforementioned large logarithmic corrections. This is also partially reflected in the increasing uncertainty estimated through scale variation. Using the dynamical scale instead, we find a much improved behaviour. Even at high momentum transfer, the corrections amount only to %. As anticipated, using the dynamical scale leads thus to a significant improvement of the perturbative expansion. We stress that the scale choice affects only mildly the NLO corrections.
This is illustrated in the upper plot of Fig. 7. Independent of whether a dynamic scale or a fixed scale is chosen, the NLO corrections are roughly the same. The ratio of the two predictions is very close to one. Only beyond 800 GeV this is no longer true. In case the dynamical scale is used, the LO predictions give thus a better prescription of the full result.
The lower plot of Fig. 7 shows the ratio of the cross section for top-quark production and the cross section for anti–top-quark production. The red curve shows the LO result while the blue curve is the NLO one. The two curves are very close to each other. However, one can see that the ratio is highly dependent. At low we recover roughly the factor 1.5 observed for the total cross section. With increasing the ratio increases. This information can be used in the experimental analysis to compare for example top-quark and anti–top-quark tagging efficiencies.
In Fig. 8 we show the transverse momentum distribution for the top-quark, the first and the second jet. The jets are ordered in with the first jet having the largest transverse momentum. With exception of the low momentum region, one observes a flat -factor amounting to positive corrections of the order 20–30 %. Most of the jets have a transverse momentum below 100 GeV. In case of the second jet, the fraction of jets having a transverse momentum above 100 GeV is below 10%. The -distribution of the top-quark jet peaks at about 75 GeV. The -distribution of the leading light jet is narrower compared to the top-quark distribution and peaks at a slightly smaller value. The -distribution of the second light jet is a steeply falling function. The lower end is set by the minimal required by the jet definition. In case of the -distribution of the top quark the NLO corrections lead to an enhancement below 50 GeV. This is an effect of the real corrections. The total transverse momentum must add up to zero. In leading order, the of the top quark must be compensated by the total of the two additional jets with each having at least a minimal of 25 GeV to pass the cuts. A top-quark transverse momentum below 50 GeV thus restricts the two additional jets to a very special phase space region. In NLO the total transverse momentum can be balanced by the third jet. The real corrections thus lead to an additional positive contribution in the specific phase space region and the aforementioned enhancement of the -distribution below 50 GeV. The results for anti top-quark production are very similar and given in Fig. 13 in Appendix A.
In Fig. 9 we present the rapidity distribution of the top quark together with the pseudo-rapidity distributions of the two additional jets. For the top-quark, the corrections for small rapidity are about 25% and thus similar to the corrections of the inclusive cross section and of the -distribution at large transverse momentum. For large the corrections increase however and are of the order of 50%. The origin of this effect is similar to the effect observed in the -distribution of the top quark and is again a consequence of the real corrections. A large top-quark rapidity corresponds to a small value of the top-quark transverse momentum which requires in leading order again a very special phase space configuration for the two additional jets. The additional jet in the real corrections extends the available phase space and leads thus to a positive correction to the cross section. This is also reflected in the scale dependence. Since the effect is due to the real corrections, the results show a large scale dependence. As far as the NLO results for the pseudo-rapidity distribution of the two light jets are concerned, the results look very similar. Both jets show a rather flat distribution with a slight enhancement for small . In the case of the leading jet, a dip occurring for in leading-order is mostly washed out by the NLO corrections. At NLO only a minor depletion is visible for small . The origin of this effect has been traced back to the three-jet event contribution of the quark-gluon induced channels (quark ), with the subprocess being the dominant contribution. This is consistent with the observation that the NLO scale uncertainties are large around . Similar results for the anti top-quark production are shown in Fig. 14 in in Appendix A. We observe that there the dip in the LO distribution is much less pronounced compared to the top-quark production. This is most probably due to the difference in the and PDFs.
In Fig. 10 the distribution of the invariant mass of the two light jets is shown. For small one observes again positive corrections of about 20%. The corrections increase with increasing . At the same time the scale uncertainty—although reduced compared to the leading order results—becomes larger. The increasing corrections are due to the real corrections. We have checked that the virtual corrections ( operator included) are negative and are not responsible for that behaviour. Similar results for the anti top-quark production are provided in Fig. 15 in Appendix A.
To quantify the spacial separation between the two leading jets we define
[TABLE]
and
[TABLE]
In Fig. 11 the distributions of and are shown.
As one can see from the upper plot, a small rapidity difference between the two leading jets is the preferred configuration. The lower plot of Fig. 11 shows the distributions of the distance in the plane. The LO and NLO distributions peak around , which corresponds, for small rapidity differences, to the configuration that the two jets are back-to-back. There is a second less pronounced peak around 0.5. In this case the two jets recoil against the top quark. Note that, must be larger than 0.4 because of the jet definition. For moderate and the NLO corrections to the and distributions tend to be slightly larger than for the inclusive cross section. The corrections increase for large and large . As can be seen in Fig. 11 the scale uncertainties increase together with the size of the corrections. Again this is an effect of the real corrections. The corresponding distributions for the anti top-quark production show a similar behavior and is given in Fig. 16 in Appendix A.
4 Conclusions
We have presented a calculation of the NLO QCD corrections for single on-shell top-quark production in association with two jets at the LHC. It is assumed that the production mode is measured separately. At LO, the interference between the and the channels vanishes because of different color structures. At NLO, additional QCD radiation introduces interference effects between and , and also with the production with one top quark decaying into three jets. However, these production modes peak in different phase-space regions, hence interference effects are expected to be very small, in particular when experimental cuts to separate the different channels are applied. We have checked that within the soft-gluon approximation the contribution is indeed tiny. With this assumption, the contribution can be measured independently.
Using inclusive cuts of , and the anti- algorithm with a radius to define jets, the NLO QCD corrections for the cross section at 13 TeV are about 28 (22)% for top (anti-top) quark production. The theoretical uncertainties are dominated by missing higher order contributions, which are estimated, using a variation of the renormalization and factorization scales, to be about 5% at NLO. Uncertainties due to an imperfect knowledge of the PDFs and of the strong coupling constant are about 2% at LO.
Further predictions for various kinematical distributions have been provided. Using a well-motivated dynamical scale choice for the renormalization and factorization scales, in most cases moderate -factors are observed, showing similar corrections as the inclusive cross section. However, the QCD corrections have a non-trivial dependence on the phase-space leading to large corrections in specific phase-space regions. For example, for the distribution of the top quark, the correction is about in the region of , then drops to about for before decreasing steadily with high energies. Corresponding results for the anti top-quark production have also been presented, thereby allowing for comparisons between the two production modes.
The results presented here provide one of the missing building blocks towards the next-to-next-to-leading order QCD corrections for single top-quark production beyond the leading color approximation.
Acknowledgements.
The work has been partly supported by the German Ministry of Education and Research under contract no. 05H15KHCAA. The work of LDN is funded by the Vietnam National Foundation for Science and Technology Development (NAFOSTED) under grant number 103.01-2017.78.
Appendix A Results for anti top-quark production
In this appendix, results for anti top-quark production are provided. Namely, the scale dependence is shown in Fig. 12, the transverse momentum distributions of the anti top-quark and of the two leading jets are displayed in Fig. 13, the rapidity distribution of the anti top-quark and the pseudo-rapidity distributions of the two leading jets are in Fig. 14, the invariant mass distribution of the two leading jets is shown in Fig. 15, and finally the distributions of the rapidity and separation between the two leading jets as defined in Eq. (4) and Eq. (5), respectively, are presented in Fig. 16.
The reference list from the paper itself. Each links out to its DOI / PubMed record.
- 1(1) W. Bernreuther, A. Brandenburg and P. Uwer, Transverse polarization of top quark pairs at the Tevatron and the large hadron collider , Phys. Lett. B 368 (1996) 153 [ hep-ph/9510300 ]. · doi ↗
- 2(2) W. G. D. Dharmaratna and G. R. Goldstein, Gluon Fusion as a Source for Massive Quark Polarization , Phys. Rev. D 41 (1990) 1731 . · doi ↗
- 3(3) W. Bernreuther and Z.-G. Si, Distributions and correlations for top quark pair production and decay at the Tevatron and LHC. , Nucl. Phys. B 837 (2010) 90 [ 1003.3926 ]. · doi ↗
- 4(4) CDF collaboration, T. Aaltonen et al., First Observation of Electroweak Single Top Quark Production , Phys. Rev. Lett. 103 (2009) 092002 [ 0903.0885 ]. · doi ↗
- 5(5) D 0 collaboration, V. M. Abazov et al., Observation of Single Top Quark Production , Phys. Rev. Lett. 103 (2009) 092001 [ 0903.0850 ]. · doi ↗
- 6(6) ATLAS collaboration, G. Aad et al., Evidence for single top-quark production in the s 𝑠 s -channel in proton-proton collisions at s = 𝑠 absent \sqrt{s}= 8 Te V with the ATLAS detector using the Matrix Element Method , Phys. Lett. B 756 (2016) 228 [ 1511.05980 ]. · doi ↗
- 7(7) G. Bordes and B. van Eijk, Calculating QCD Corrections to Single Top Production in Hadronic Interactions , Nucl. Phys. B 435 (1995) 23 . · doi ↗
- 8(8) T. Stelzer, Z. Sullivan and S. Willenbrock, Single Top Quark Production via W-Gluon Fusion at Next-To-Leading Order , Phys. Rev. D 56 (1997) 5919 [ hep-ph/9705398 ]. · doi ↗