Mechanics of allostery: contrasting the induced fit and population shift scenarios
Riccardo Ravasio, Solange Flatt, Le Yan, Stefano Zamuner, Carolina, Brito, Matthieu Wyart

TL;DR
This study investigates the mechanical principles underlying allosteric regulation in proteins, contrasting induced fit and population shift models, and identifies optimal elastic properties that support cooperative binding and protein function.
Contribution
The paper provides empirical evidence and a mechanical model analysis showing how elastic modes influence allosteric mechanisms and their robustness to mutations.
Findings
Allosteric conformational change occurs along a soft elastic mode with high shear regions.
Optimal stiffness for cooperative binding scales as 1/N, where N is the number of residues.
Population shift scenario is more robust to mutations affecting stiffness.
Abstract
In allosteric proteins, binding a ligand can affect function at a distant location, for example by changing the binding affinity of a substrate at the active site. The induced fit and population shift models, which differ by the assumed number of stable configurations, explain such cooperative binding from a thermodynamic viewpoint. Yet, understanding what mechanical principles constrain these models remains a challenge. Here we provide an empirical study on 34 proteins supporting the idea that allosteric conformational change generally occurs along a soft elastic mode presenting extended regions of high shear. We argue, based on a detailed analysis of how the energy profile along such a mode depends on binding, that in the induced fit scenario there is an optimal stiffness for cooperative binding, where is the number of residues involved in the allosteric response.…
Click any figure to enlarge with its caption.
 Figure 1
 Figure 2
 Figure 3
 Figure 4
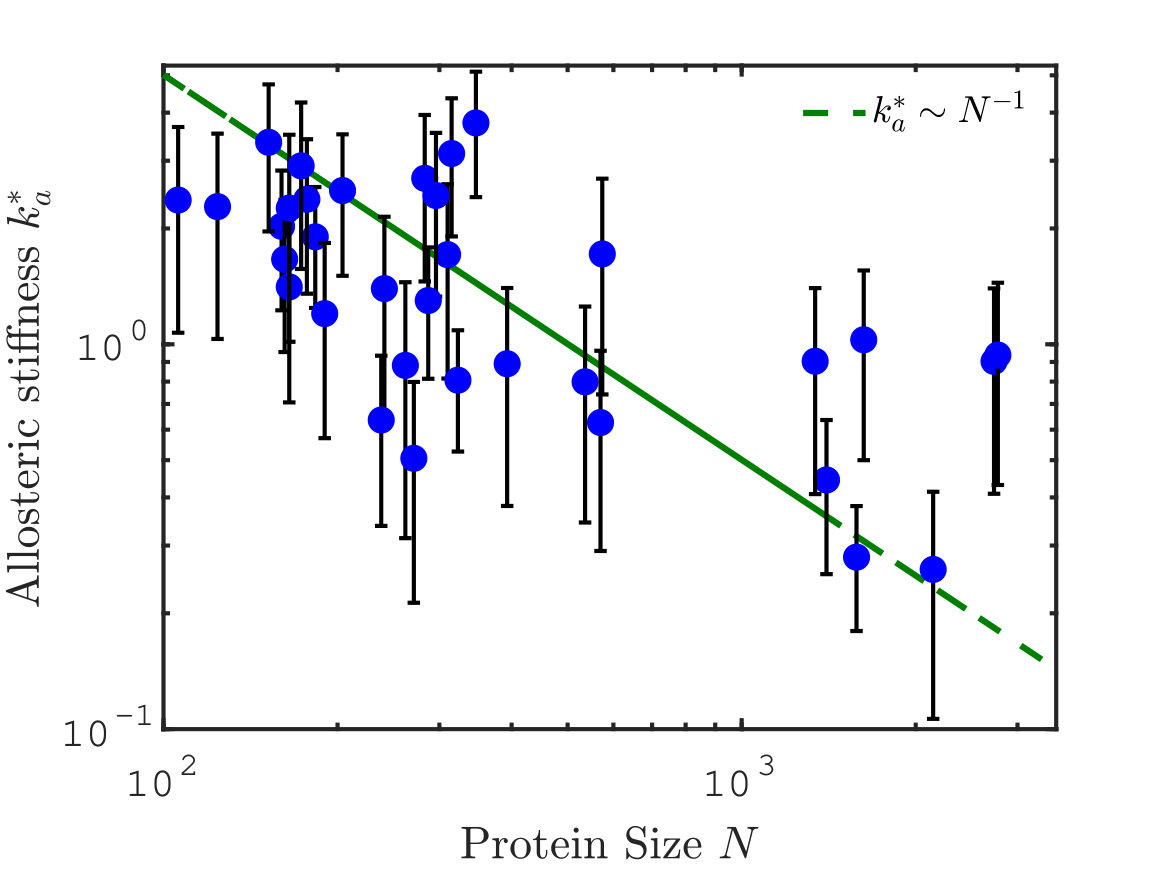 Figure 5
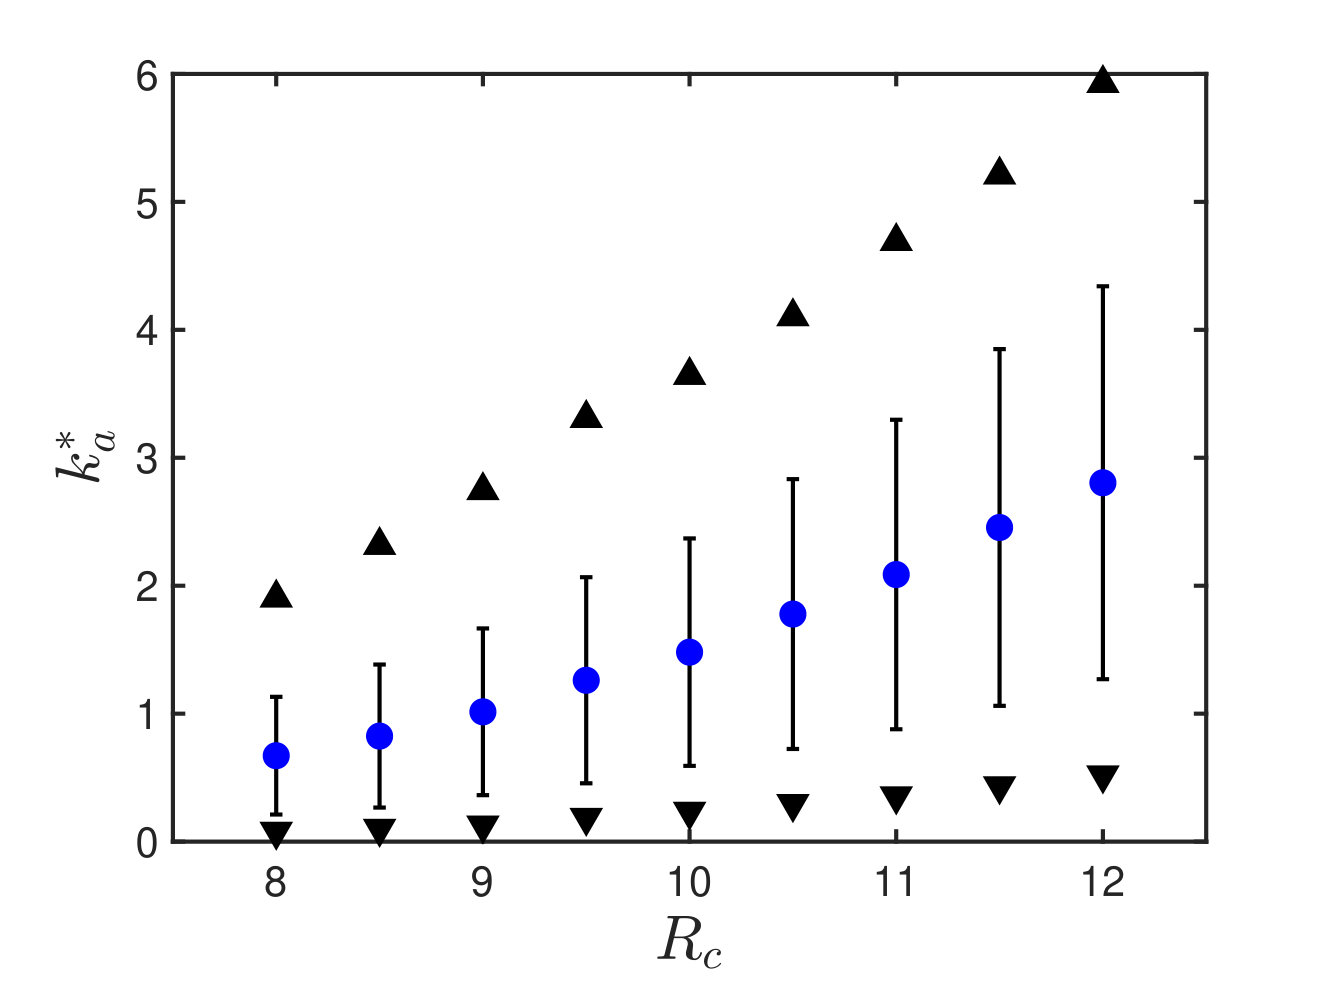 Figure 6
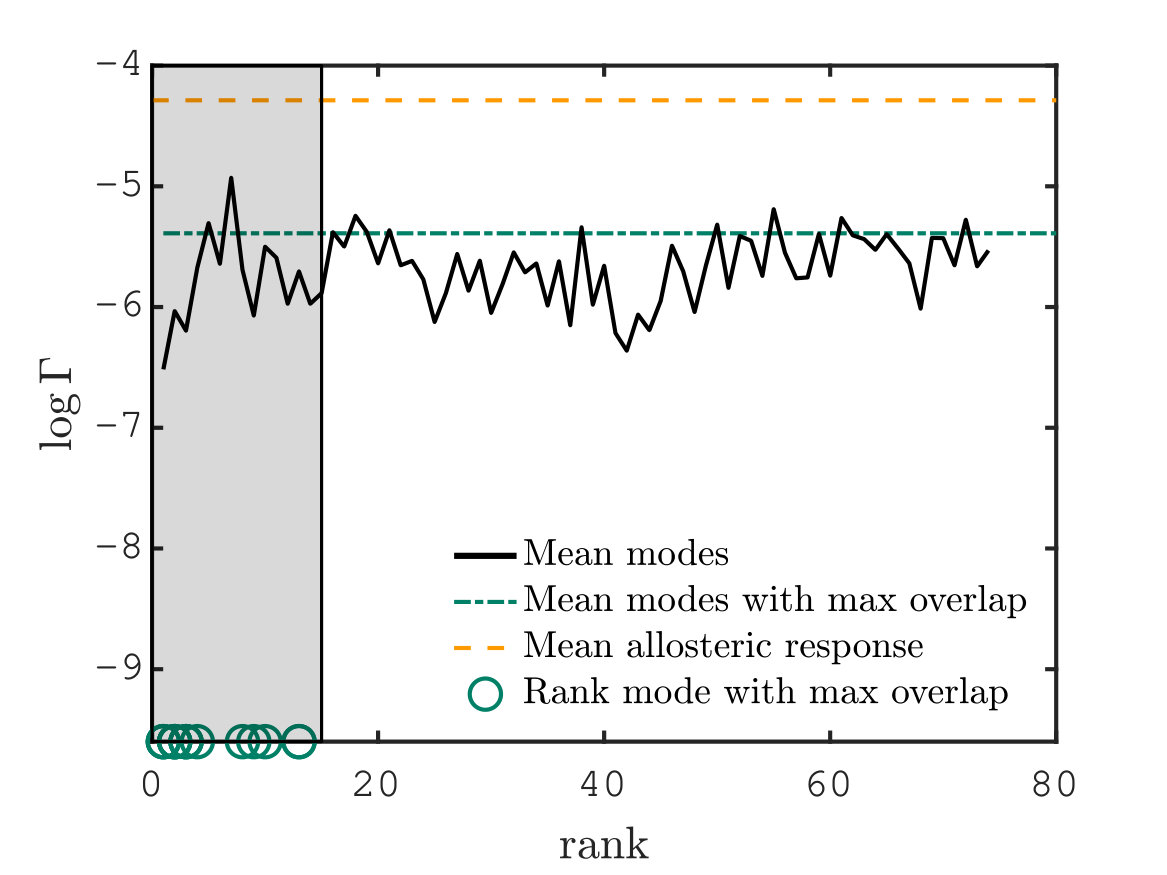 Figure 7
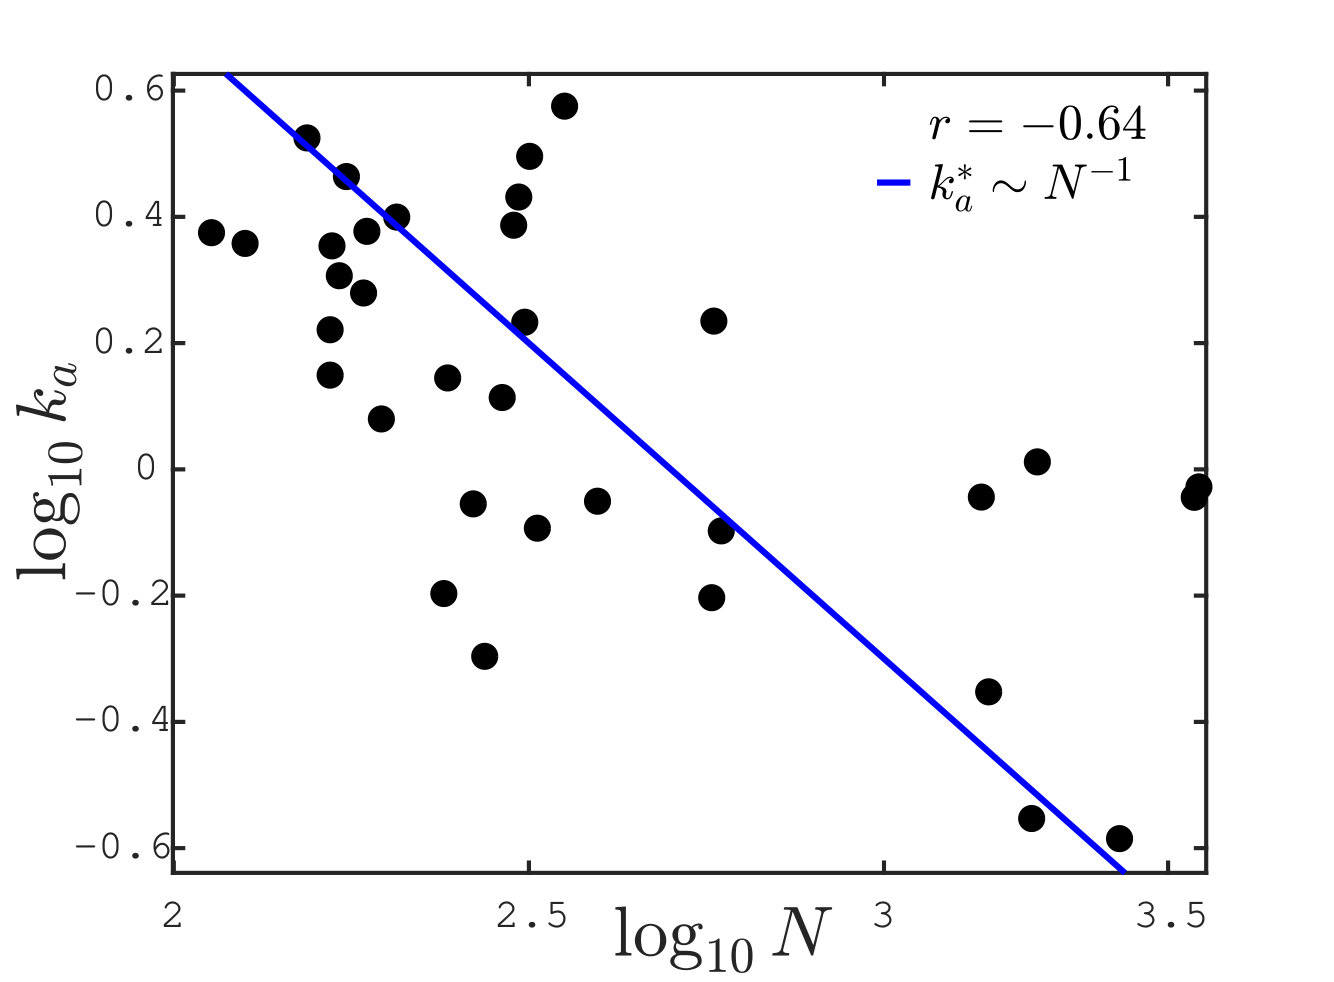 Figure 8
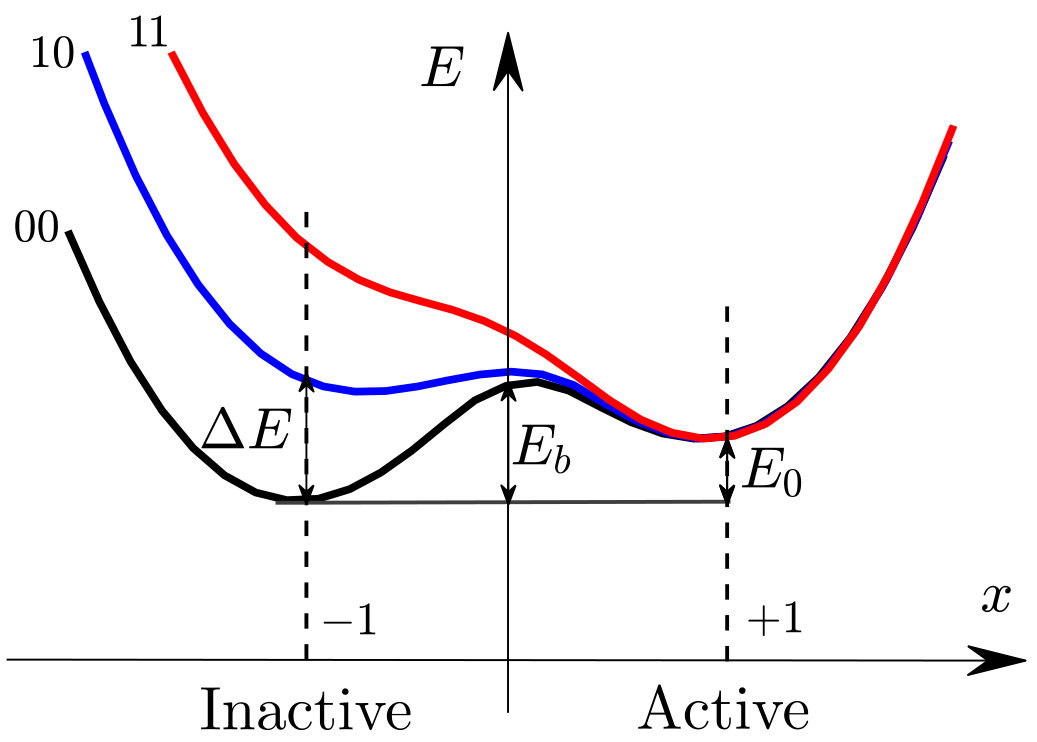 Figure 9
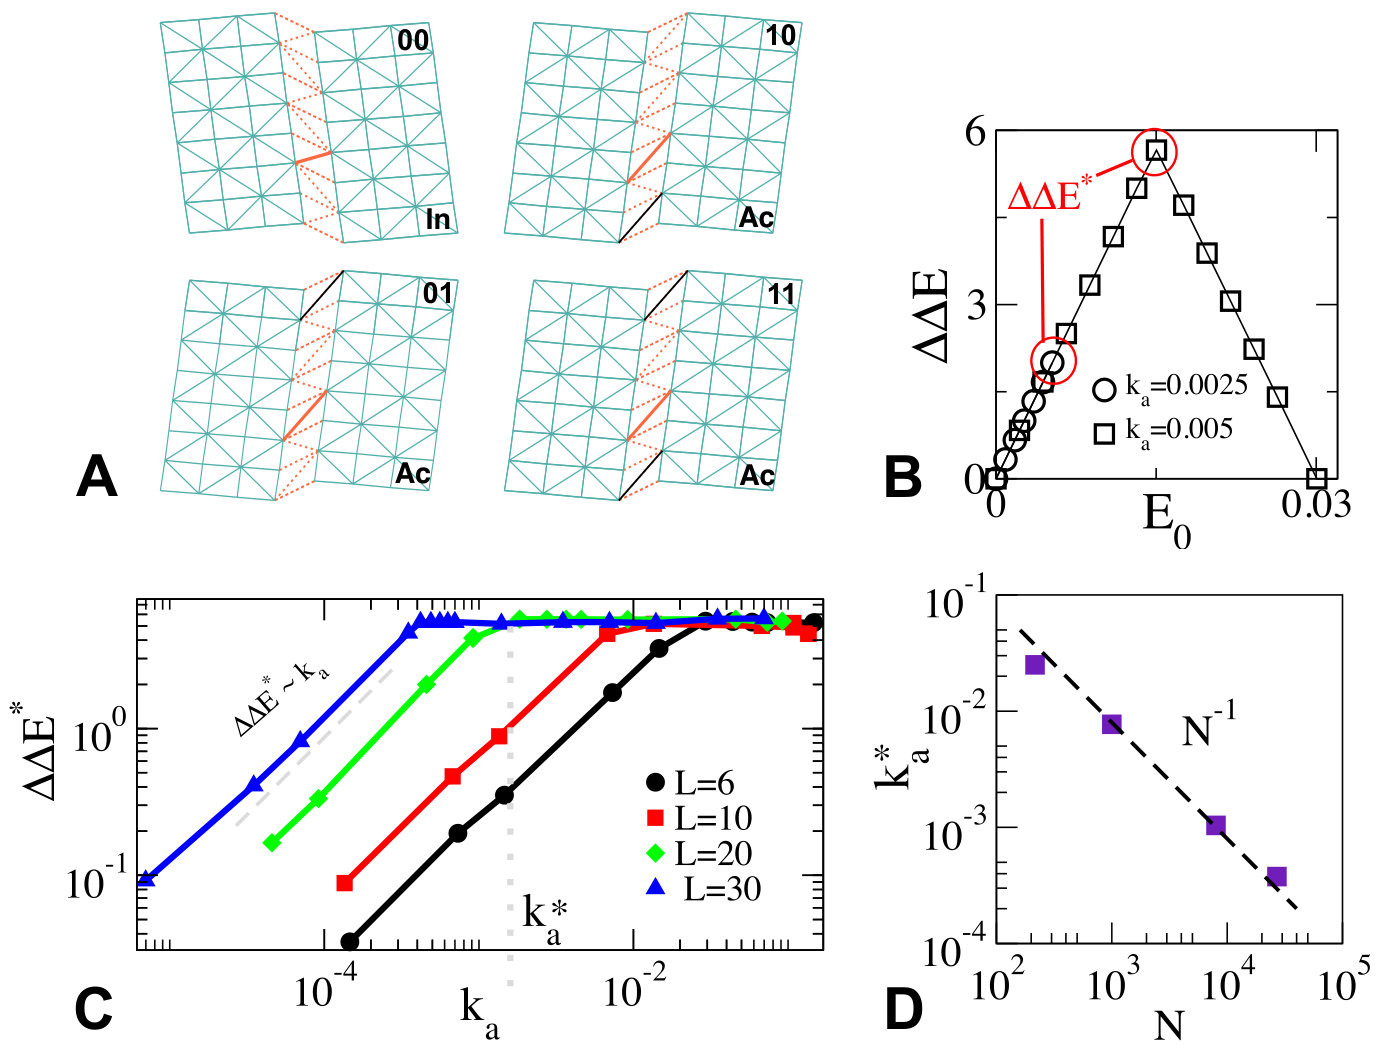 Figure 10
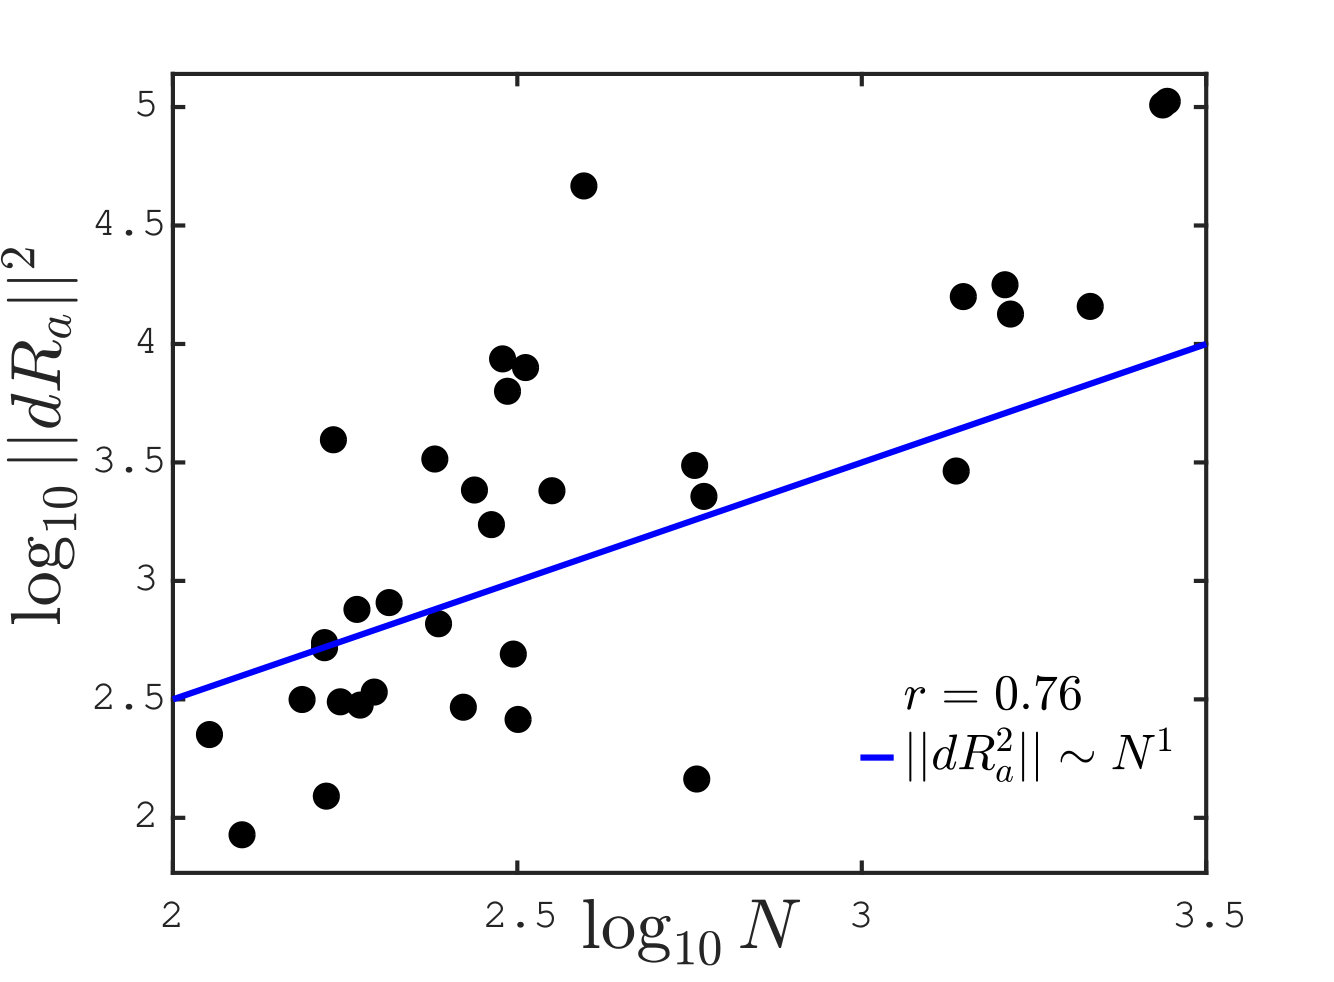 Figure 11
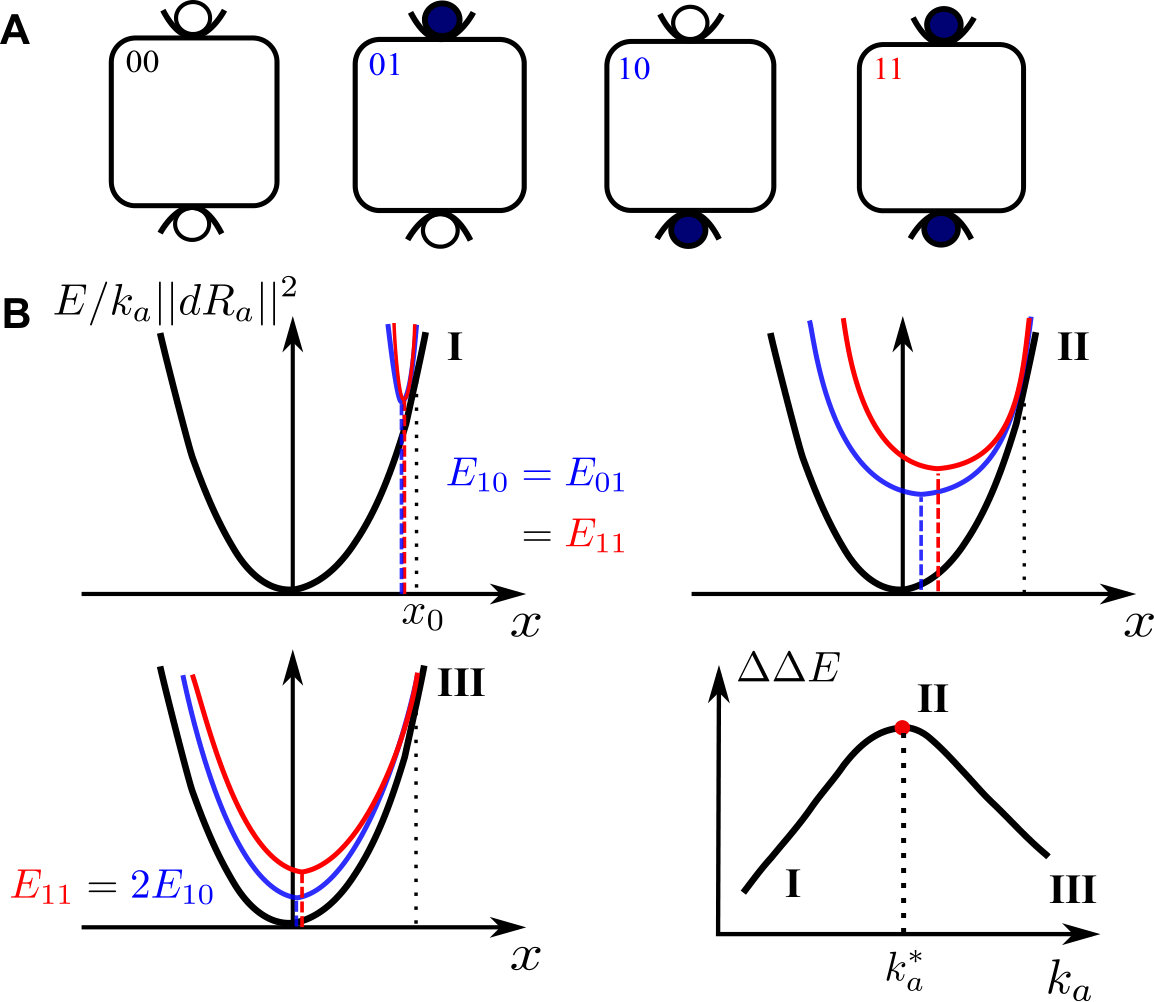 Figure 12
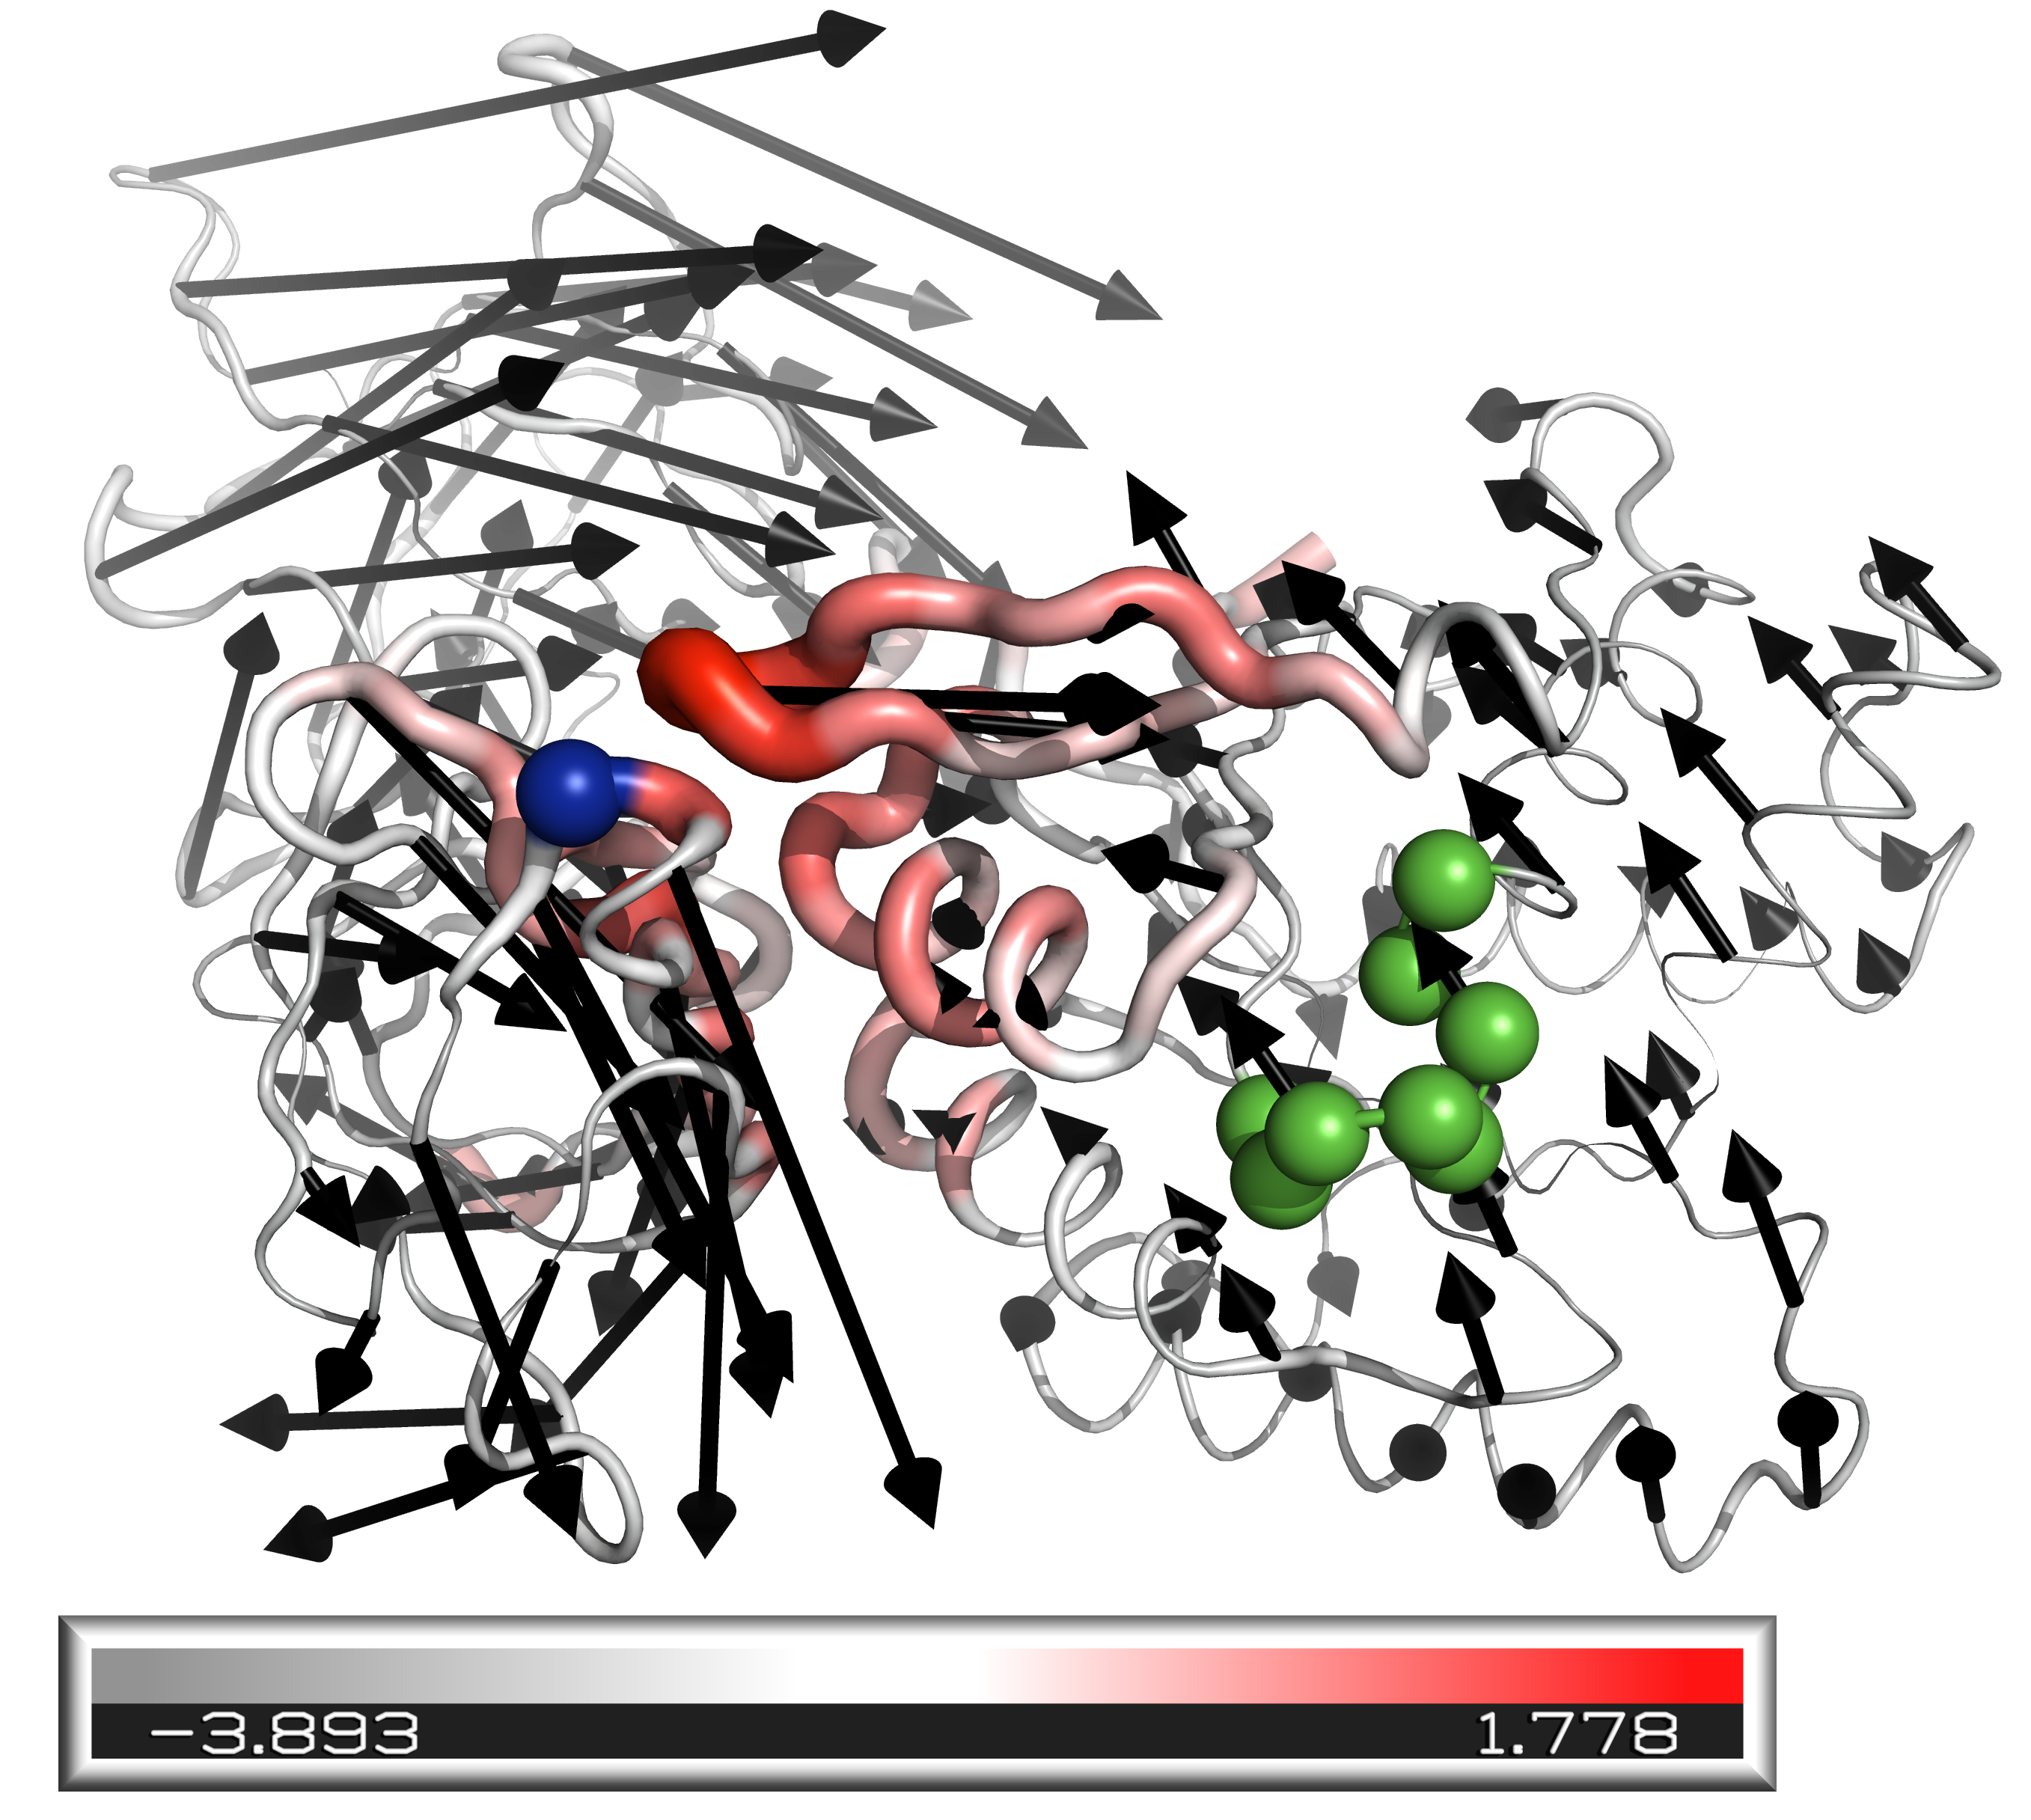 Figure 13
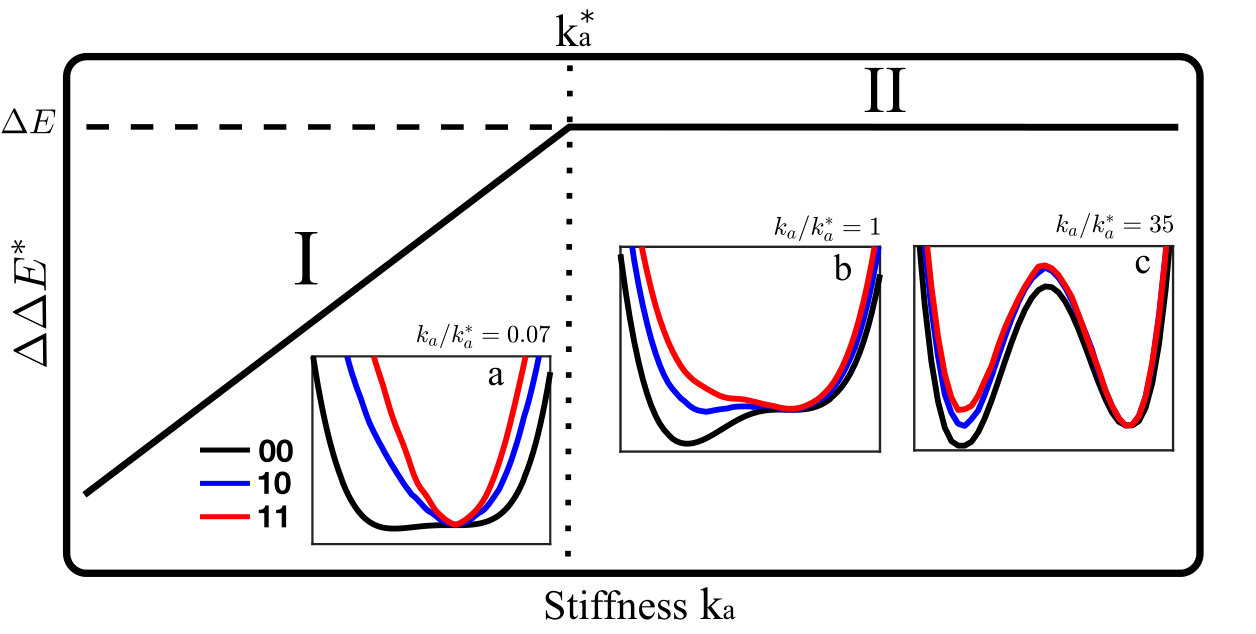 Figure 14
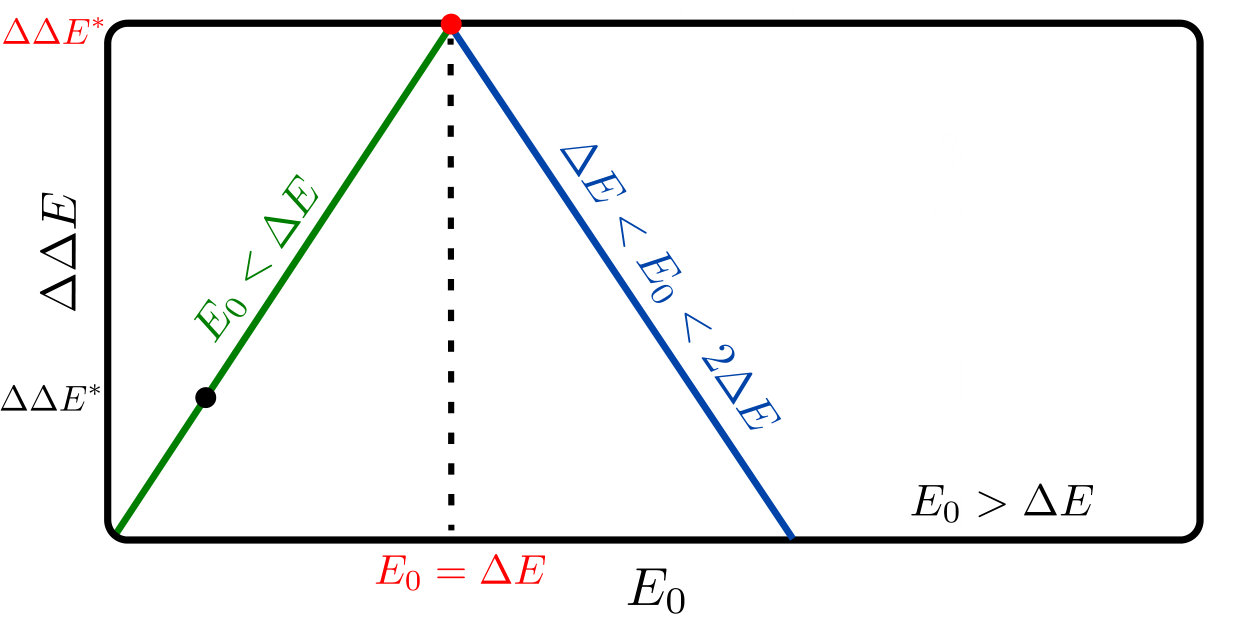 Figure 15
| Protein type | Inactive (PDB) | Active (PDB) | Common residues | Chains | Overlap | Participation ratio |
|---|---|---|---|---|---|---|
| 1. arf6 | 1E0S | 2J5X | 160 | A | 0.27 | 0.16 |
| 2. cdc42 | 1AN0 | 1NF3 | 183 | AB | 0.33 | 0.09 |
| 3. rab11 | 1OIV | 1OIW | 162 | A | 0.32 | 0.07 |
| 4. rac1 | 1HH4 | 1MH1 | 175 | A | 0.27 | 0.07 |
| 5. ras | 4Q21 | 6Q21 | 164 | A | 0.44 | 0.08 |
| 6. rheb | 1XTQ | 1XTS | 165 | A | 0.35 | 0.1 |
| 7. rhoA | 1FTN | 1A2B | 173 | A | 0.24 | 0.08 |
| 8. sec4 | 1G16 | 1G17 | 152 | A | 0.23 | 0.08 |
| 9. IGF-1R | 1P40 | 1K3A | 283 | A | 0.23 | 0.03 |
| 10. met repressor | 1CMB | 1CMA | 204 | AB | 0.24 | 0.08 |
| 11. tet repressor | 2TRT | 1QPI | 190 | A | 0.47 | 0.32 |
| 12. glcN-6-P deaminase | 1CD5 | 1HOT | 262 | A | 0.45 | 0.26 |
| 13. EF-Tu | 1TUI | 1EFT | 393 | A | 0.61 | 0.30 |
| 14. | 1TAG | 1TND | 310 | A | 0.36 | 0.07 |
| 15. ERK2 | 1ERK | 2ERK | 347 | A | 0.19 | 0.06 |
| 16. IRK | 1IRK | 1IR3 | 296 | A | 0.31 | 0.05 |
| 17. lac repressor | 1TLF | 1EFA | 536 | AB | 0.71 | 0.48 |
| 18. PurR | 1DBQ | 1WET | 271 | A | 0.71 | 0.34 |
| 19. anthranilate synthase | 1I7S | 1I7Q | 1402 | ABCD | 0.61 | 0.45 |
| 20. chorismate mutase | 2CSM | 1CSM | 241 | A | 0.54 | 0.25 |
| 21. FBPase-1 | 1EYJ | 1EYI | 323 | A | 0.46 | 0.04 |
| 22. phosphofructokinase | 6PFK | 4PFK | 315 | A | 0.32 | 0.05 |
| 23. PTB1B | 1T48 | 1PTY | 287 | A | 0.48 | 0.02 |
| 24. ATCase∗ | 6AT1 | 8AT1 | 2732 | ABCDEFGHIJKL | 0.64 | 0.55 |
| 25. hemoglobin | 4HHB | 1HHO | 570 | ACBD | 0.66 | 0.52 |
| 26. NAD-malic enzyme | 1QR6 | 1PJ2 | 2144 | ABCD | 0.72 | 0.57 |
| 27. phosphoglycerate DH | 1PSD | 1YBA | 1580 | ABCD | 0.74 | 0.53 |
| 28. human serum albinum∗ | 1E78 | 2BXB | 574 | A | 0.36 | 0.09 |
| 29. fixJ | 1DBW | 1D5W | 238 | AB | 0.69 | 0.65 |
| 30. DAHP synthase | 1KFL | 1N8F | 1340 | ABCD | 0.64 | 0.55 |
| 31. SpoIIAA | 1H4Y | 1H4X | 106 | A | 0.40 | 0.22 |
| 32. CheY | 3CHY | 1FQW | 124 | A | 0.34 | 0.18 |
| 33. glycogen phosphorylase | 1GPB | 7GPB | 1626 | AB | 0.53 | 0.24 |
| 34. ATCase | 1RAC | 1D09 | 2774 | ABCDEFGHIJKL | 0.65 | 0.55 |
Peer Reviews
No public reviews on file for this paper yet. If you reviewed it on a platform where reviews are public (OpenReview, ICLR, NeurIPS, ICML), you can paste yours below so the community can read it here.
Videos
No videos yet. Explain this paper in a talk, walkthrough, or lecture? Add one.
Mechanics of allostery: contrasting the induced fit and population shift scenarios
Riccardo Ravasio
Institute of Physics, École Polytechnique Fédérale de Lausanne, CH-1015 Lausanne, Switzerland
Solange Marie Flatt
Institute of Physics, École Polytechnique Fédérale de Lausanne, CH-1015 Lausanne, Switzerland
Le Yan
Current address: Chan Zuckerberg Biohub, 499 Illinois St, San Francisco, CA 94158
Kavli Institute for Theoretical Physics, University of California, Santa Barbara, CA 93106, USA
Stefano Zamuner
Institute of Physics, École Polytechnique Fédérale de Lausanne, CH-1015 Lausanne, Switzerland
Carolina Brito
Instituto de Física, Universidade Federal do Rio Grande do Sul, CP 15051, 91501-970 Porto Alegre RS, Brazil
Matthieu Wyart
Corresponding author: [email protected], [email protected]
Institute of Physics, École Polytechnique Fédérale de Lausanne, CH-1015 Lausanne, Switzerland
Abstract
In allosteric proteins, binding a ligand can affect function at a distant location, for example by changing the binding affinity of a substrate at the active site. The induced fit and population shift models, which differ by the assumed number of stable configurations, explain such cooperative binding from a thermodynamic viewpoint. Yet, understanding what mechanical principles constrain these models remains a challenge. Here we provide an empirical study on 34 proteins supporting the idea that allosteric conformational change generally occurs along a soft elastic mode presenting extended regions of high shear. We argue, based on a detailed analysis of how the energy profile along such a mode depends on binding, that in the induced fit scenario there is an optimal stiffness for cooperative binding, where is the number of residues. We find that the population shift scenario is more robust to mutation affecting stiffness, as binding becomes more and more cooperative with stiffness up to the same characteristic value , beyond which cooperativity saturates instead of decaying. We confirm numerically these findings in a non-linear mechanical model. Dynamical considerations suggest that a stiffness of order is favorable in that scenario as well, supporting that for proper function proteins must evolve a functional elastic mode that is softer as their size increases. In consistency with this view, we find a fair anticorrelation between the stiffness of the allosteric response and protein size in our data set.
**Significance statement: **Many proteins are allosteric: binding a ligand affects their activity at a distant site. Understanding the principles allowing for such an action at a distance is both of fundamental and practical importance. From the thermodynamic viewpoint, two models have been proposed, according to which binding creates a new stable configuration or instead shifts the thermal equilibrium between existing states. We perform a mechanical analysis of these models and show that they are not equally robust to mutations. We argue that in both cases function can most properly occur along a soft elastic mode, whose stiffness decreases rapidly with protein size. We show data on 34 proteins substantiating this result, supporting a new principle for allosteric design.
Many proteins are allosteric: binding a ligand at one or several allosteric sites can regulate function at a distant site, a long-range communication often accompanied by large conformational changes Perutz et al. (1960); Perutz (1970). There is a considerable interest in predicting the amino acids involved in this communication, or “allosteric pathway”, from structure or sequence data Halabi et al. (2009); Amor et al. (2016), since they can be used as targets for drug design Nussinov and Tsai (2013). Yet, understanding the physical principles underlying such action at a distance in proteins remains a challenge Wodak et al. (2019); Thirumalai et al. (2018). From a thermodynamic standpoint, two distinct views have been proposed. In the induced fit scenario, exemplified by the Koshland-Némethy-Filmer (KNF) model Koshland et al. (1966), the protein essentially lies in one single state. The latter changes as binding occurs, leading to a conformational change. In an energy landscape picture such as that of Fig.1B, it corresponds to a displacement of the energy minimum upon binding. By contrast, in the population shift model, exemplified by the Monod-Wyman-Changeux (MWC) model Monod et al. (1965), two states are always present. Their relative stability can change sign upon binding, leading to an average conformational change. Although each of these models presumably applies to various proteins, they do not specify which designs allow for efficient action at a distance, and how robust these designs are to mutations Hopfield (1973).
In several proteins — see below for a systematic study — it has been observed that the allosteric response induced by binding occurs predominantly along one or few vibrational modes Kitao and Go (1999); Bahar et al. (1999); Xu et al. (2003); De Los Rios et al. (2005); Zheng et al. (2006). This result supports that in at least some proteins elasticity — possibly non-linear — is an appropriate language to describe allostery (in contrast to intrinsically disordered proteins that may be considered more as liquids than solids, for which the analysis proposed here would not hold). Very recently, there has been a considerable effort to use in-silico evolution Hemery and Rivoire (2015); Tlusty et al. (2017) to study how linear elastic materials can evolve to accomplish an allosteric task Yan et al. (2017); Rocks et al. (2017); Flechsig (2017); Yan et al. (2018); Dutta et al. (2018); Wang et al. (2018); Flechsig and Togashi (2018); Bravi et al. (2018); Rocks et al. (2019). In general, binding a ligand locally distorts the protein, which is modelled by imposing local displacements at some site, generating an extended elastic response that in turn determines fitness (chosen specifically to accomplish a given task). These models fall into the induced fit scenario, since in the framework of linear elasticity there is always a single minimum of energy. A particularly key allosteric function within proteins is the amount of cooperative binding, defined as the change of binding energy of a substrate at the active site caused by binding a ligand at the allosteric site. Materials optimized to display such a cooperativity over long-distances develop a single extended “mechanism” — a soft elastic mode, such as the motion of closing scissors — connecting the two binding sites Yan et al. (2018). It is found that the stiffness (i.e. the curvature of the energy) of this mode cannot be too large nor too small for cooperativity to occur, and that optimal design corresponds to where is the number of particles in the system. If proteins are nearly optimal, mutations stiffening that mode should thus diminish cooperativity. Yet, these predictions are restricted to strictly linear elasticity, an approximation that presumably does not hold in the regime where most protein operate — certainly not in the population shift scenario.
In this work, we show that the population shift and the induced fit models are very different from a mechanical perspective. In the former case as well, function can be achieved by developing a mechanism or soft elastic mode, but cooperativity, instead of steadily decreasing, saturates to a constant value once the mode stiffness passes some characteristic value, whose scaling with is . We confirm this prediction in a non-linear elastic model of allostery. This result implies that cooperativity is more robust towards mutations increasing stiffness in the population shift scenario. Yet, displaying a stiffness much larger than implies a very long transition time between the two states, and is presumably prohibited, suggesting the hypothesis that allosteric proteins function with modes presenting a stiffness near the characteristic value in both cases. We test this proposition systematically using X-ray crystallographic data of 34 allosteric proteins. We first confirm that one or a few vibrational modes contribute to the allosteric response, and introduce a new observable establishing that this response presents unusually extended regions of large shear, as found previously for three proteins Mitchell et al. (2016). Next we confirm that the characteristic mode stiffness tends to decrease with the propagation length as we expect from the predicted scaling of . Finally, we suggest systematic mutational studies to further test how mechanics constrains allostery.
Geometrical interpretation of mechanical constraints in induced fit allostery
As sketched in Fig.1A, a protein with two binding sites can be unbound (labeled “00”), bound to a single ligand (labeled “01” or “10”) or doubly bound (labeled “11”). We define by the energy of the protein in these four situations (corresponding to the minimum energy of their energy landscape), and choose as the reference energy. Cooperativity is then defined as:
[TABLE]
To simplify notation below, we assume a symmetry between the states 01 and 10, in particular . Our qualitative conclusions below however remain valid even if this symmetry does not hold.
Consider a protein displaying cooperativity thanks to the presence of a soft elastic mode. Let us denote by a variable indicating the motion along that mode (see our numerical model below for a concrete example in the context of a shear design), which varies from zero to unity as the protein undergoes its allosteric response. The energy profile of the unbound state follows:
[TABLE]
where is the norm of the allosteric response and is the vector displacement of the amino acid . We expect that if the protein has residues, is of order , where is the inter-atomic distance. We will confirm empirically the dependence of with below. is the mode stiffness and some function of order unity such that . For a purely linear elastic material, . More generally for the induced fit scenario, presents a single minimum, as illustrated in Fig.1B. In Yan et al. (2018) it was argued that if linear elasticity applies, then there is an optimal stiffness for cooperativity. We present a geometrical interpretation of this result, which extends it to the induced fit scenario in general, and will be useful to explain why the population shift scenario behaves differently. Local chemical interactions which lead to identical binding energies for the inactive and active states do not affect cooperativity, and thus need not be considered here. For concreteness, we assume that after some motion along that mode, the protein shape can accommodate perfectly both ligands without deforming. It implies that the energy profile of the bound states and satisfy , as pictured in Fig.1B. However as departs from , the protein shape does not match the ligands, imposing an elastic strain at the binding sites leading to an increase of elastic energy in the protein, that will trigger motion along other elastic modes. Assuming that the ligands are rigid and that each binding site involves on the order atoms that move by a distance as the protein undergoes its allosteric response, we have where characterizes the stiffness of inter-atomic interactions and is large in comparison with the one of soft modes, i.e. . Here is some dimensionless function vanishing quadratically in zero — but possibly non-linear at large arguments.
, can be computed as the minimum of the curves and respectively, from which the cooperativity is readily computed. Two extreme cases occur, illustrated in Fig.1B:
(i) if (Fig.1B.I), as moves away from , the elastic energy induced by binding is very significant in comparison to the mode energy . Thus both and have a sharp minimum near , with . Thus , which vanishes as .
(ii) If is very large (Fig.1B.III), is small in comparison to : , and are very close to each other, and must thus all present a minimum near . Thus binding does not trigger motion along the soft mode, whose presence is useless. No extended modes couples the two binding sites and , leading to as .
(iii) Optimal cooperativity is thus found at some intermediary , corresponding to Fig.1B.II. Note that the present argument for an optimal does not require the energy profile to be an exact parabola, as long as it is monotonically growing in both directions around its minimum.
Mechanical aspects of the population shift model
MWC model
We recall some aspects of the MWC model. To simplify notation, we consider that the protein displays two symmetric binding sites as illustrated in Fig.1A. The protein is assumed to lie in two possible distinct configurations, “Inactive” () and “Active” (). In the absence of binding, we take the energy of the inactive state as our reference (i.e. ) and denote the energy of the active state . We assume that the active configuration has a well-suited geometry to bind each ligand, thus no elastic energy is spent for binding and . By contrast, we assume that in the inactive state binding costs some energy , leading to and . The last assumption of additivity of binding energies within a given configuration, i.e. for a frozen mode amplitude, is expected to be accurate if the two binding sites are distant enough, since no elastic coupling between them is expected in that case.
For each binding situation, the configuration (inactive or active) chosen is the one with the smallest energy, e.g. . Computing the cooperativity one finds three different cases:
(i) if , then the binding of one ligand is sufficient to drive the system in the active state, implying and ;
(ii) if , then the binding of one ligand is not sufficient and two ligands have to bind in order to drive the system in the active state. Consequently, ;
(iii) if , then since the system stays in the inactive state even if two ligands are bound. The sketch of this behavior is shown in Fig.2, illustrating that the maximum cooperativity is found for .
Mechanical consideration on the MWC model
Our observations (see the empirical section below) indicate that a significant fraction of allosteric proteins operate mainly along one normal mode of the elastic energy, supporting the idea that in these cases a favored path connects the inactive and active configurations. We expand the energy (in the absence of ligand) in terms of the motion along that path (in this two-states case, it is more convenient to chose a coordinate varying between and as the protein undergoes its allosteric response). Note that if non-linearities are present, this path is not along a single linear mode, but it bends in phase space. Our analysis below holds independently of such bending. We keep the minimal number of non-linear terms that allow to display two states (a polynomial of four degrees has five parameters, three of them can be fixed by redefining the reference energy, and changing the definition of by both a multiplicative and additive constants):
[TABLE]
where is a parameter reflecting how the energy profile is tilted towards the inactive state, characterizes the stiffness of the mode and is the square norm of the allosteric response.
A typical profile following Eq.3 is shown in Fig.3A. We denote by inactive the lowest of the two minima and the other one by active. Note that (i) in the case , Eq.3 describes two identical minima at of stiffness , separated by an energy barrier . (ii) When the parameter is positive, we have up to where the active state becomes unstable and only a single stable state is left. (iii) At fixed , the energy difference between the two states is maximal at , where one finds . (iv) For small , . In what follows we focus on the case where the population shift model lies.
Next, we assume that the active configuration matches the shape of both ligands, so that binding events in that state cost no energy. However, by moving away from the configuration the shapes of the protein and ligands do not match anymore and the protein needs to deform elastically near the binding site. Again assuming that each binding site involves of order atoms, which move by a distance of order from the active to the inactive state, we have a binding energy where is the location of the active state along the path. This energy is exemplified by the difference between the blue and black curves in Fig.3A. Thus the binding energy in the inactive state follows , which is independent of the protein size and mode stiffness . As explained before, if the two binding sites are distant enough, for a given mode amplitude the elastic costs of binding will simply add up: as shown in red in Fig.3A.
How the mode stiffness constrains cooperativity
To quantify this constraint we define the maximal cooperativity over all possible tilts given : . We find two regimes:
(i) If , then the elastic costs associated with binding are very large compared to . Both and are peaked close to , as illustrated in Fig. 3B.a. Thus , implying according to Fig. 2, which is maximized at leading to . Thus vanishes linearly at small , as illustrated in Fig.3B. This result is qualitatively similar to the induced fit case, for which also vanishes linearly as shown in Fig.1.B.
(ii) If , then the elastic cost is very small in comparison to : , and are almost identical as illustrated in Fig.3B.c. In that regime, cooperativity is optimized by chosing a small tilt fixing to according to Fig. 2, implying which is independent of . This plateau behaviour is represented in Fig. 3B, and appears at .
This result represents a fundamental difference with the induced fit case, for which a large stiffness destroys cooperativity. Indeed in the induced fit scenario a large stiffness implies that the minimal energy is always found for as illustrated in Fig. 1B.III, implying that binding does not move the protein along that mode, which is thus useless. This state of affairs is ultimately a geometric necessity stemming from the fact that the three curves , and must be very close to each other in that regime, and each present a single minimum. Consequently the positions of these minima must be very similar in the three cases, leading to independently of binding ligands or not. This geometric necessity vanishes as soon as two minima are present.
Note that although asymptotes to a constant for , the barrier between the inactive and active states grows linearly with in that limit. Large barriers would lead to undesirably slow transition rate between states, thus we expect that in practice lies reasonably close to .
A mechanical model for population shift allostery
We seek to model that (i) the allosteric response often takes place mainly along a single vibrational mode. (ii) Various architectures can lead to allostery, including the well-known shear Mitchell et al. (2016); Gerstein et al. (1994) or hinge Xu et al. (2003) designs and others not falling in these categories Goodey and Benkovic (2008); McLaughlin Jr et al. (2012). Such a diversity is also found in in silico evolution schemes Yan et al. (2018). Yet, such synthetic architectures always present soft extended regions where most of the strain (i.e. relative motion) is located. Such an observation was made in a few proteins Mitchell et al. (2016) and will be generalized below. For proteins presenting two stable configurations, we expect these regions to present two possible ways of locally stacking amino acids well.
As an illustration, we consider the shear design in which the protein presents two three-dimensional rigid regions connected by a soft planar layer that can easily deform. The rigid regions consist of harmonic springs of stiffness , shown in blue in Fig.4A. The soft layer consists of anharmonic springs (shown in red in Fig.4A), whose energy vs. extension curve is non-linear, chosen to have the same form as Eq.3. These non-linear springs have a characteristic stiffness , and present two stable extensions at which they exert no force, whose relative energy is controlled by some bias . These stable extensions are chosen such that two states of the protein as a whole, the inactive and active states shown in Fig.4A, present no contact forces by construction, and are thus local minima of the energy. Finally the protein presents two binding sites, at its top and bottom. At each site, binding imposes that the distance between two nodes (indicated by black lines in Fig.4A) equals the distance it naturally presents in the active state, thus favoring it. The details about the construction of the microscopic model are discussed in Supplementary Information.
We can now numerically compute the energy profiles , and as a function of the motion along the shear mode , by imposing a shear displacement (i.e. a value of ) and letting the entire elastic energy of the material relax, except for that mode. The insets of Fig. 4 show our results. The value of the mode stiffness can be extracted from fitting Eq.3 to and measuring the displacement norm , and can be increased by increasing . From one readily computes the energy difference between the inactive and active states, which can be increased by monitoring the microscopic bias . From the minima of , and one immediately extracts the binding costs and .
Fig.4B shows for two values of , as the energy difference is increased. For large , passes through a maximum , whereas for small , is smaller, and its maximum is fixed by the maximal achievable energy difference . as a function of is shown for different system sizes in Fig.4C, confirming the presence of two regimes with a cross-over at some as shown in Fig.4D. Overall, these observations validate our theoretical predictions on the dependence of with the number of residues, and on how the stiffness qualitatively affects cooperativity.
Empirical study of 34 allosteric proteins
Allosteric Response
We identify a set of 34 allosteric proteins in the Protein Data Bank (PDB), for which both the active (ligand bound at the allosteric site) and inactive (no ligand bound at the allosteric site) crystalline X-ray structures are available. Their PDB identifiers are taken from Daily and Gray (2007); Mitchell et al. (2016) and reported in Supplementary Information. The set is diverse in functionality, and includes enzymes (13), G-proteins (10), Kinases (3), response regulators (3), DNA-binding proteins (4) and the Human Serum Albumin, among which 12 protein complexes are present. We can thus estimate the allosteric response as the displacement field between the inactive and active structures (after having aligned them via the software Pymol 2.1.1 Schrödinger, LLC (2015)). Here we focus on the motion of the amino-acids, located by the position of their -carbon. As an illustration, the allosteric response of a given protein (the elongation factor Tu) is shown in black arrows in Fig. 5A.v From the allosteric response , one can readily estimate: (i) the magnitude of the displacement . (ii) The fraction of the protein involved in the response. For any displacement field, this fraction is usually estimated via the participation ratio Bell and Dean (1970):
[TABLE]
(iii) A measure of how much relative displacement takes place around atom . Following Mitchell et al. (2016) we consider the shear pseudo-energy quantifying the amount of strain — essentially a measure of the relative displacement between adjacent atoms — at residue , whose precise definition is given in Supplementary Information. indicates that the protein moves as a rigid body near atom , and by contrast is large where atoms slide rapidly past each other. is shown in color in Fig. 5A for the protein Tu, illustrating that two parts of the protein are rigidly moving (and counter-rotate), while the central region displays significant pseudo-energy , which is reminiscent of a hinge design.
Elastic Networks Analysis
To estimate protein elasticity we use elastic network models (ENM) Atilgan et al. (2001), in which harmonic springs of identical stiffness are placed between all -carbons laying below a chosen cutoff radius Å. ENM is obviously a crude approximation of real atomic interactions. Yet, its simplicity allows for the systematic study of various proteins, and it has been successful in capturing normal modes relevant for the function of some proteins. The dependence of the results on the value of are indicated by error bars in Fig. 5B and discussed in Supplementary Information for Fig. 6B. This procedure defines an elastic energy from which the matrix of the second derivatives, i.e. the Hessian matrix , can be computed. From , one can readily estimate the stiffness of the allosteric response as the curvature of the elastic energy in that direction:
[TABLE]
Finally, the eigenvectors of define the vibrational modes of the protein . Following Kitao and Go (1999); Bahar et al. (1999); Xu et al. (2003); De Los Rios et al. (2005); Zheng et al. (2006), the overalp between the allosteric response and mode characterizes their similarity ( implies that there are identical):
[TABLE]
Geometry of the allosteric response
Fig. 5B reports the maximal overlap , as a function of the participation ratio . Our observation indicate that is in general large (in half of the case larger than ), supporting further that allostery indeed occurs mainly along one mode Kitao and Go (1999); Bahar et al. (1999); Xu et al. (2003); De Los Rios et al. (2005); Zheng et al. (2006). Interestingly, this effect is stronger when most sites of the protein are involved in the allosteric response ( large). Interestingly, some protein complexes (for example ATCase, see the values of in Table 1 of Supplementary Material) also display a large projection of their allosteric response on a single mode, supporting that mechanical considerations can be valuable in such cases as well.
We now provide systematic data supporting that the allosteric response presents extended regions of large shear energy Mitchell et al. (2016). More specifically, we argue that while some vibrational modes can present significant shear (e.g. localized modes capturing the motion of dandling loops) and other can be extended (such as plane-wave-like modes), the allosteric response is unique in presenting both aspects, thus revealing a specific design principle. To quantify this effect, we introduce the quantity, that can be defined on any displacement field:
[TABLE]
where is the total magnitude of the shear energy, i.e. . is large if the displacement is extended and if the shear energy is large. The factor characterizes the trade-off between these two features. Here we choose reflecting the fact that for vibrational modes, we find that varies about 3.5 times less in relative terms than as shown in Supplementary Information. Thus for , the spatial extension and the amount of shear equally affect . Fig. 5C shows averaged over the proteins with for the allosteric response (yellow line), the mode with maximum overlap (blue line) and the first vibrational modes (having subtracted the one with largest overlap) as function of the mode rank. We find that is typically 160 times larger for the allosteric response than for vibrational modes, a very significant difference underlying the specific geometry of the allosteric response.
Scaling of response stiffness with protein size
We can now test our conjecture that the allosteric stiffness is close to where cooperativity saturates, which implies in particular an anti-correlation between and protein size. In our theoretical estimate of , we have assumed that the allosteric response magnitude is linear in the protein size, i.e. . It is a natural assumption since the larger the protein, the more likely its response involves many residues. The relationship between these two quantities is tested in 34 proteins in Fig.6A. We indeed find a strong correlation between the logarithms of and (Pearson coefficient with p-value . Pearson coefficients are computed on the logarithmic values via the Matlab R2017b function corr). Overall, data are consistent with our assumption of proportionality.
Finally, we plot the allosteric response stiffness measured according to Eq.S3 in terms of for all proteins in Fig. 6B. A key finding is the fair anti-correlation between the logarithms of these two quantities (Pearson coefficient with p-value ), supporting the idea that larger allosteric proteins need to evolve a softer elastic mode to accomplish function, as expected from our analysis. The signal that we observe is encouraging, especially given the possible sources of noise in the analysis, among which, in particular, the use of ENM to build the Hessian matrix.
Conclusion
We have provided systematic evidence that the allosteric response occurs along one soft elastic mode, and we have introduced a novel observable to establish that this response generally displays unusually extended regions of high shear strain. These observations support that for many proteins, elasticity is a useful starting point to describe allostery. We have revisited the two classical thermodynamic models of allostery from this perspective, and provided a detailed study of how the energy profile along the soft mode evolves with binding. We find that induced fit and population shift models qualitatively differ. In the induced fit model, there is an optimal stiffness associated to that mode beyond which the cooperative binding energy eventually decreases to zero. The population shift model is more robust to mutations affecting stiffness, and simply marks a cross-over beyond which cooperativity saturates and the transition time between configurations rapidly explodes. We introduced a novel non-linear elastic model for allostery supporting these views. Our key result is that proper function is achieved if proteins evolve an elastic mode whose softness must rapidly decrease with size, a prediction supported by the anti-correlation observed between these quantities.
Systematic mutation scan on one single protein, in which binding assays to measure cooperativity are combined with single molecule experiments or ultrafast laser pulses to estimate the stiffness of the allosteric response, would be extremely useful to test the predicted relationship between these quantities. Molecular dynamics experiments could further test how the energy profile along the soft elastic mode evolves with binding. Elucidating such an interplay between thermodynamics and mechanics in proteins would be valuable in a variety of tasks, including de novo protein design and the discovery of novel allosteric pathways.
Acknowledgements.
We thank P. Barth, B. Bravi, P. De Los Rios, D. Malinverni, R. B. Phillips and M. Popović for discussions. R.R. is supported by the Swiss National Science Foundation under Grant No. 200021-165509/1. M.W. thanks the Swiss National Science Foundation (Grant No. 200021-165509) and the Simons Foundation (Grant #454953 Matthieu Wyart). This material is based upon work performed using computational resources supported by the “Center for Scientific Computing at UCSB” and NSF Grant CNS-0960316, by the “High Performance Computing at NY” and by the “High Performance Computing at EPFL”.
I Supplemental Material
A. Mechanics of allosteric proteins from X-ray structural data
Dataset
We consider 34 allosteric proteins with both inactive and active X-ray structures available Daily and Gray (2007); Mitchell et al. (2016). The Protein Data Bank (PDB) entries of these proteins are listed in Table 1; the number of common residues between the inactive and active structures and the number of chains that we consider are also reported in the table. We remove the first two and last two residues for every structure as they correspond to the fluctuating starting and ending points of the protein chain.
Elastic network model
From the X-ray structures we compute the Hessian matrix using the anisotropic network model introduced in Atilgan et al. (2001). We consider the positions of residues by looking only at alpha-carbon atoms; for alpha-carbon . The model assumes a harmonic interaction between two residues at distance smaller than a cutoff distance ,
[TABLE]
where is the spring constant (fixed to unity), is the distance between residues and , and is the distance at equilibrium. Building the Hessian is then straightforward by taking second derivatives of the potential with respect to the coordinates of residues and evaluated at equilibrium ,
[TABLE]
where label the spatial dimension of the atoms.
The definition of a cutoff distance is an empirical fitting parameter. In practice, we computed Hessian matrices at nine cutoff values equi-distributed in the range Å. We define the stiffness of the allosteric response as
[TABLE]
This quantity changes systematically with as shown in Fig.S1A: by increasing , also increases, which leads to all points in Fig. S1B moving together in the same direction when changing . In the main text we reported the mean value of over the nine choices of , and in Fig. S1B we show the range of variability of when Å.
Computing the local strain tensor in a protein
In a continuous medium, a motion maps a point in the reference configuration to a new point in the current configuration, the strain tensor of the motion can thus be computed as
[TABLE]
where , labels the spatial dimension.
In a discrete medium like proteins which are a collection of atoms (or residues as we consider), computing the partial derivative at residue is not straightforward. Ideally, for any neighboring residue close enough in space
[TABLE]
where and in our setting, where is the position of residue taken from the X-ray structure. We have number of such equations for when neighbors are considered. So are usually over-determined when we consider all neighbors below a certain cutoff distance (we choose Å for first nearest neighbors and Å for second nearest neighbors). Instead of solving Eq. (S5), we define a mean squared error function Gullett et al. (2007)
[TABLE]
where we have kept a weight function of node contribution to in general. Specifically, we set as in Mitchell et al. (2016) for all nearest neighbors to (, for and otherwise. By minimizing the mean squared error with respect to , we have
[TABLE]
and
[TABLE]
where is the identity tensor.
The shear pseudo-energy Mitchell et al. (2016), a vector field whose components contain a measure of the relative motion of each residue, can be defined from the strain tensor computed above
[TABLE]
where the local shear tensor depends only on the displacement between the two conformations via the strain tensor and .
Empirical definition of
In the main text we introduced the observable combining information on the participation ratio (P) and the amount of shear pseudo-energy () in a given mode as
[TABLE]
with . In Fig. S2.A we show the range of values of participation ratio (dashed line) compared with the one of shear pseudo-energy (continuous line).
The measured relative variation from the two curves is and we choose in the definition of . Fig. S2.B is an alternative way of representing the result discussed in the main text. We consider a scatter plot of and participation ratio for the three quantities considered (modes with maximum overlap, other modes and allosteric response) and we see that the allosteric response although displaying a large participation ratio it has also a large , meaning that it involves also a considerable amount of shear.
B. Microscopic model
To construct a microscopic model with two global minima that correspond to the “Inactive” () and “Active” () states, we need to impose that all nonlinear springs to stay exactly at one of their minimum when the network is in either or state.
This can be achieved by having each nonlinear spring following a quartic potential,
[TABLE]
where , with the distance of two particles connected by the interaction and a parameter capturing the typical local deformation of adjacent particles between and states. The above compromise can thus be satisfied by choosing the right prefactors to Given a nonlinear spring in the and states with rest length, respectively, and , the springs are in a local minimum, if (i)
[TABLE]
and (ii) same for . Only the relative value of energy is important, (iii) we can set all to zero. (iv) We assume the stiffnesses of the nonlinear springs to be the same,
[TABLE]
where is the parameter capturing the stiffness of nonlinear interactions that has a unit of spring stiffness. (v) Finally, we define
[TABLE]
where is a parameter capturing the energy difference between the and states. We now have five equations (i-v) for the five parameters ( to ) for each of the nonlinear spring . Hence, we can define the quartic potentials for all nonlinear springs.
Specifically, we consider an elastic network embedded in a Face-Centered-Cubic (FCC) lattice in three dimensions (3D) as shown in Fig. S3-A,B. The and states are connected by a shear mode, which is enabled by rotations of two rigid blocks on the left and right against each other, as shown in Fig. S3-C. Such a model can be realized by having harmonic springs with spring stiffness in the two rigid blocks and the nonlinear springs at the boundary of the two.
The elastic energy of a linear (strong) spring is then
[TABLE]
where is the rest length of particle separation on the lattice. While, the energy of a nonlinear (weak) spring obeys Eq. (S10) with parameters solved by the particle distances in two states. The total energy of the system is then obtained by summing the energies over all two kinds of springs,
[TABLE]
The reference list from the paper itself. Each links out to its DOI / PubMed record.
- 1Perutz et al. (1960) M. F. Perutz, M. G. Rossmann, Ann F. Cullis, H Muirhead, Georg Will, and A. C. T. North, “Structure of haemoglobin: A three-dimensional fourier synthesis at 5.5-a. resolution, obtained by x-ray analysis,” Nature 185 , 416–422 (1960).
- 2Perutz (1970) M. F. Perutz, “Stereochemistry of cooperative effects in haemoglobin: Haem–haem interaction and the problem of allostery,” Nature 228 , 726–734 (1970).
- 3Halabi et al. (2009) Najeeb Halabi, Olivier Rivoire, Stanislas Leibler, and Rama Ranganathan, “Protein sectors: evolutionary units of three-dimensional structure,” Cell 138 , 774–786 (2009).
- 4Amor et al. (2016) Benjamin RC Amor, Michael T Schaub, Sophia N Yaliraki, and Mauricio Barahona, “Prediction of allosteric sites and mediating interactions through bond-to-bond propensities,” Nature Communications 7 (2016).
- 5Nussinov and Tsai (2013) Ruth Nussinov and Chung-Jung Tsai, “Allostery in disease and in drug discovery,” Cell 153 , 293–305 (2013).
- 6Wodak et al. (2019) Shoshana J Wodak, Emanuele Paci, Nikolay V Dokholyan, Igor N Berezovsky, Amnon Horovitz, Jing Li, Vincent J Hilser, Ivet Bahar, John Karanicolas, Gerhard Stock, et al. , “Allostery in its many disguises: From theory to applications,” Structure (2019).
- 7Thirumalai et al. (2018) D Thirumalai, Changbong Hyeon, Pavel I Zhuravlev, and George H Lorimer, “Symmetry, rigidity, and allosteric signaling: From monomeric proteins to molecular machines,” ar Xiv preprint ar Xiv:1812.04969 (2018).
- 8Koshland et al. (1966) D. E. Jr. Koshland, G. Némethy, and D. Filmer, “Comparison of experimental binding data and theoretical models in proteins containing subunits,” Biochemistry 5 , 365–385 (1966).