SDSS J094635.06+101706.1: a redshift one, very radio-loud, {\gamma}-ray emitting narrow-line Seyfert 1 galaxy
Su Yao, S. Komossa, Wen-Juan Liu, Weimin Yi, Weimin Yuan, Hongyan, Zhou, Xue-Bing Wu

TL;DR
This paper reports the discovery of SDSS J094635.06+101706.1 as the most distant gamma-ray emitting narrow-line Seyfert 1 galaxy at redshift 1.004, characterized by extreme radio loudness, variability, and extended radio emission, providing insights into jet physics at high Eddington ratios.
Contribution
It identifies and characterizes the most distant gamma-ray emitting NLS1 galaxy, expanding understanding of high-redshift jet physics and the properties of radio-loud NLS1s.
Findings
Most distant gamma-ray NLS1 at z=1.004.
Highly radio-loud and variable at multiple wavelengths.
Extended radio emission over >100 kpc.
Abstract
As hybrids of narrow-line Seyfert 1 (NLS1) galaxies and blazars, {\gamma}-ray emitting NLS1s are important probes of jet physics in the high Eddington-ratio regime. Only very few of them are known to date; the majority of them below redshift z = 0.5. Here we present the identification of the {\gamma}-ray emitting AGN TXS 0943+105 (SDSS J094635.06+101706.1) as a high-redshift NLS1 galaxy. It turns out to be one of the radio-loudest NLS1s known, highly variable at all wavelengths, and shows widely extended radio emission at a (projected) > 100 kpc scale. It is a known strong {\gamma}-ray emitter with a luminous flare reported previously. At redshift z=1.004, this is the most distant {\gamma}-NLS1 known to date.
Click any figure to enlarge with its caption.
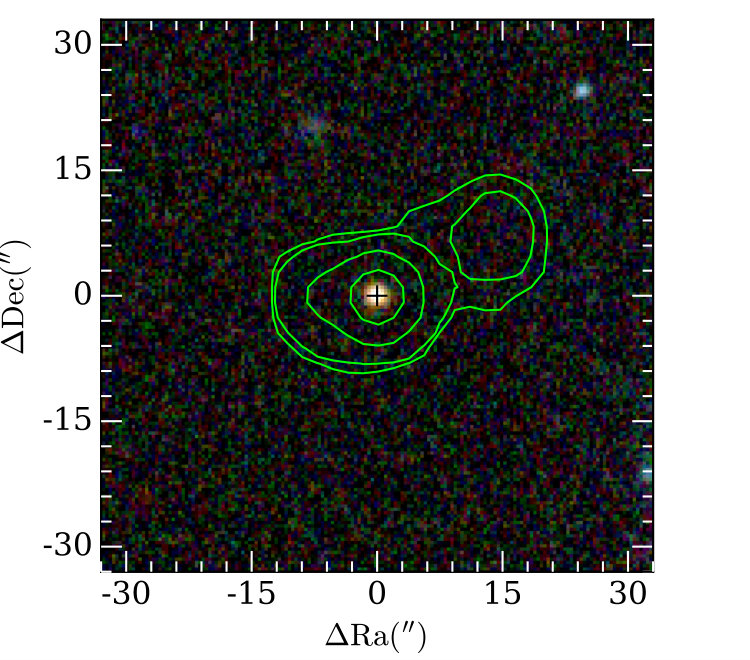 Figure 1
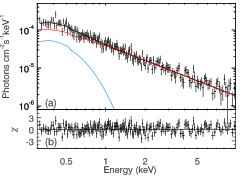 Figure 2
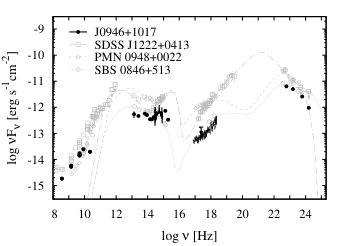 Figure 3
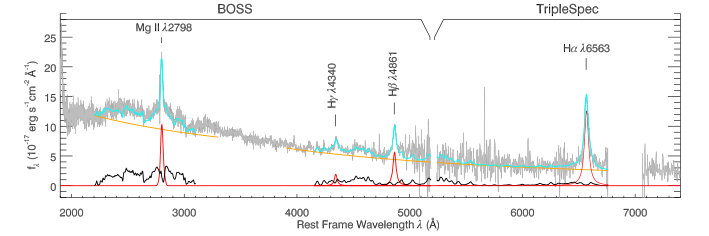 Figure 4
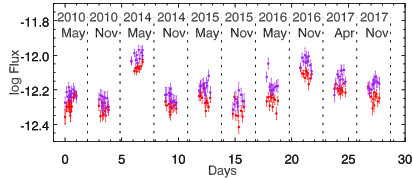 Figure 5
| FWHM(Mg ii | (Mg ii | ||||||
|---|---|---|---|---|---|---|---|
| [] | [] | [] | [] | [] | [] | ||
| Lorentzian | 197451 | 0.900.08 | 2919196 | ||||
| Double-Gaussian | 219930 | 1.040.04 |
Peer Reviews
No public reviews on file for this paper yet. If you reviewed it on a platform where reviews are public (OpenReview, ICLR, NeurIPS, ICML), you can paste yours below so the community can read it here.
Videos
No videos yet. Explain this paper in a talk, walkthrough, or lecture? Add one.
SDSS J094635.06+101706.1: a redshift one, very radio-loud, -ray emitting narrow-line Seyfert 1 galaxy
Su Yao1,2, S. Komossa3, Wen-Juan Liu4,5, Weimin Yi4,5,6, Weimin Yuan7, Hongyan Zhou8,9, Xue-Bing Wu1,10
1Kavli Institute for Astronomy and Astrophysics, Peking University, Beijing 100871, China
2National Astronomical Observatories, Chinese Academy of Sciences, Beijing 100012, China
3Max-Planck Institut für Radioastronomie, Auf dem Hügel 69, 53121 Bonn, Germany
4Yunnan Observatories, Chinese Academy of Sciences, Kunming, Yunnan 650011, China
5Key Laboratory for the Structure and Evolution of Celestial Objects, Chinese Academy of Sciences, Kunming 650011, China
6Department of Astronomy & Astrophysics, The Pennsylvania State University, 525 Davey Lab, University Park, PA 16802, USA
7Key Laboratory of Space Astronomy and Technology, National Astronomical Observatories, Chinese Academy of Sciences, Beijing 100012, China
8CAS Key Laboratory for Research in Galaxies and Cosmology, Department of Astronomy, USTC, Hefei, Anhui 230026, China
9SOA Key Laboratory for Polar Science, Polar Research Institute of China, 451 Jinqiao Road, Shanghai 200136, China
10Department of Astronomy, School of Physics, Peking University, Beijing 100871, China E-mail: [email protected]
(Accepted XXX. Received YYY; in original form ZZZ)
Abstract
As hybrids of narrow-line Seyfert 1 (NLS1) galaxies and blazars, -ray emitting NLS1s are important probes of jet physics in the high Eddington-ratio regime. Only very few of them are known to date; the majority of them below redshift . Here we present the identification of the -ray emitting AGN TXS 0943+105 (SDSS J094635.06+101706.1) as a high-redshift NLS1 galaxy. It turns out to be one of the radio-loudest NLS1s known, highly variable at all wavelengths, and shows widely extended radio emission at a (projected) 100 kpc scale. It is a known strong -ray emitter with a luminous flare reported previously. At redshift =1.004, this is the most distant -NLS1 known to date.
keywords:
galaxies: active – galaxies: nuclei – galaxies: Seyfert – accretion, accretion discs – galaxies: jets
††pubyear: 2019††pagerange: SDSS J094635.06+101706.1: a redshift one, very radio-loud, -ray emitting narrow-line Seyfert 1 galaxy–References
1 Introduction
Radio-loud and -ray emitting narrow-line Seyfert 1 (NLS1) galaxies are important new probes of the formation and evolution of radio jets, in a regime different from classical blazars (see a review by Komossa, 2018). NLS1s are a subgroup of AGN with extreme properties in the optical and X-ray band, and therefore stand out in AGN correlation space (e.g. Boroson & Green, 1992; Grupe et al., 2010; Xu et al., 2012). They harbor supermassive black holes (SMBHs) of relatively low masses, accreting at a high rate, and therefore represent a class of AGN which are rapidly growing their SMBHs in the local universe.
While only studied in the optical and X-ray regime for some decades and preferentially radio-quiet, nevertheless a population of radio-loud, jet-emitting NLS1 galaxies was identified (Komossa et al., 2006; Yuan et al., 2008). These combine the properties of blazars on the one hand, and NLS1 galaxies on the other hand. With Fermi/LAT, it was discovered that a few of the jetted NLS1 galaxies emit luminous -ray radiation, highly variable in some cases, and independently confirming the presence of powerful jets in some NLS1 galaxies (Abdo et al., 2009b). Meanwhile, about 15 -ray emitting NLS1s have been identified (Abdo et al. 2009a; Abdo et al. 2009a; Foschini 2011; D’Ammando et al. 2012; D’Ammando et al. 2015; Yao et al. 2015; Yang et al. 2018; Paliya et al. 2018; Lähteenmäki et al. 2018; see Komossa 2018 and Romano et al. 2018 for reviews).
NLS1 galaxies as a group are spectroscopically defined by the small widths of their broad H emission lines, with full width at half maximum (FWHM) typically taken to be less than 2000 , strong Fe ii emission complexes and weak forbidden lines (Osterbrock & Pogge, 1985). Most NLS1s have been reported at , including the ones detected at -rays, as their identification requires H falling into the spectral coverage of large surveys. An exception is SDSS J1222+0413 at =0.966 (Yao et al., 2015).
Here, we report the identification of TXS 0943+105 (SDSS J094635.06+101706; J0946+1017 hereafter) at redshift =1.004 as a new very radio-loud NLS1 galaxy which is also -ray detected (Acero et al., 2015). The optical identification is based on the Sloan Digital Sky Survey-III Baryon Oscillation Spectroscopic Survey (SDSS-BOSS, Dawson et al., 2013), which for the first time included the H regime (Section 2) because of the broader wavelength range covered. Multi-wavelength follow-up observations are presented in Section 3, while Section 4 provides the discussion and conclusions. Throughout this paper we use a CDM cosmology with km s*-1* Mpc*-1*, and .
2 Spectroscopy
2.1 Observations
The optical spectrum of J0946+1017 was obtained on January 27, 2012 (MJD 55953) during SDSS-III’s Baryon Oscillation Spectroscopic Survey (BOSS, Dawson et al., 2013) by the Sloan 2.5m telescope equipped with a spectrograph which covers a wavelength range of 3600-10400 Å and has a spectral resolution of -. We retrieved the calibrated 1D spectrum from the SDSS archive.
During the 2016A cycle of the Telescope Access Program of China, we obtained a near-infrared (NIR) spectrum of J0946+1017 using the TripleSpec spectrograph mounted on the Palomar 5 m Hale telescope on April 20 (UT), 2016 (MJD 57498). The spectrograph provides a wavelength coverage from 0.9 to 2.46 m at a resolution of 1.4-2.9 Å with two gaps at approximately 1.35 and 1.85 m owing to telluric absorption bands (Wilson et al., 2004). For optimal removal of the strong sky background in the NIR, we observed target (A) and off-target (B) positions in an A-B-B-A dither pattern along the slit with four exposures of 300 s. The sky was clear with seeing 1.2″and the slit-width was fixed to 1″. The data reduction, including flux calibration and telluric correction, was carried out with the Interactive Data Language (IDL)-based package SpexTool (Cushing et al., 2004), as described in detail in Zuo et al. (2015).
2.2 Data Analysis
Before the spectral fitting, both BOSS and TripleSpec spectra are corrected for Galactic extinction with mag (Schlafly & Finkbeiner, 2011) and an extinction law, and then are transformed into the source rest frame at a redshift provided by the SDSS spectroscopic pipeline. The fitting is based on IDL routines in the MPFIT package (Markwardt, 2009), which performs a minimization using the Levenberg-Marquardt method. Due to flux variability of the source and non-simultaneity of the spectroscopy, the SDSS-BOSS and TripleSec spectra had to be re-scaled. We fit the BOSS spectrum using a single power law in the fitting windows which are thought to be free of any strong emission lines: [3020, 3030] Å, [3790, 3810] Å, [4200, 4210] Å and [5080, 5100] Å (Vanden Berk et al., 2001). Then the TripleSpec spectrum is scaled so that the spectrum in the range [5300, 6400] Å matches the best-fit single power law. The BOSS spectrum and the scaled TripleSpec spectrum are combined into one spectrum (Figure 1). We use this combined spectrum in the following analysis.
In order to measure the primary emission lines, we adopt a similar procedure as in Yao et al. (2015), which models the emission lines and their underlying continuum simultaneously. We perform spectral fitting separately for the Balmer lines in the optical and the Mg ii line in the ultraviolet. During the fitting procedure, a pseudo-continuum consisting of a simple power law and Fe ii multiplets is used. The optical and ultraviolet Fe ii are modelled using templates provided in Véron-Cetty et al. (2004) and Tsuzuki et al. (2006), respectively.
The broad Balmer lines including H were modelled with either a Lorentzian or a concentric double-Gaussian profile. Narrow lines potentially present in the spectrum, including possible narrow Balmer lines, [Oiii] and [Nii] are described by a single Gaussian profile with . The broad Balmer lines are constrained to have the same width and redshift, and a similar constraint is set for all the narrow lines. Then the Balmer emission lines are fitted simultaneously with a pseudo-continuum in the range of [4160, 5100] Å and [6000, 6800] Å.
To measure the Mg ii line, line profile and pseudo-continuum are fitted simultaneously to the spectrum in the range of [2200, 3100] Å. We fit the Mg ii doublet using a similar model as in Wang et al. (2009). Each line of the doublet is modeled with one broad and one narrow component. The broad component is a truncated five-parameter Gauss-Hermite profile (e.g. van der Marel & Franx, 1993). Both broad components are assumed to have the same width and redshift, and their flux ratio is constrained between 2:1 and 1:1 (Laor et al., 1997). The narrow component is a single Gaussian profile with constraint of . The redshift and line flux ratio of the two narrow components are constrained following the same prescription as for the broad components. We find, however, that addition of narrow components in Mg II is not needed.
No other narrow lines are detected in the spectrum, either. The Balmer lines can be similarly well fitted with either a Lorentzian or a double Gaussian profile, with for a Lorentzian and for a double-Gaussian profile, respectively. These measurements imply a NLS1 classification of J0946+1017. This classification is independently confirmed by the faintness of [O iii] as well as the very strong Fe ii emission complexes, with Fe ii /H, where Fe ii is the flux of Fe ii integrated from 4434 Å to 4684 Å (e.g. Véron-Cetty et al., 2001). The fitting results are summarized in Table 1.
3 Multi-wavelength Properties
3.1 Radio emission
J0946+1017 was detected by several radio surveys. Its highest precision radio coordinate from Very Long Baseline Radio Interferometry observations (VLBI, RA=09h46m35.1s, Del=+10°17′06″.1, Fey et al., 2015) agrees within better than 0.1 arcsec with its Gaia (RA=09h46m35.1s, Del=+10°17′06″.1, Andrae et al., 2018) and SDSS coordinates. The Texas Survey measured a flux density of at 365 MHz with a spectral index of () estimated between 335-380 MHz, but the error in this spectral index is naturally high given the small frequency range involved (Douglas et al., 1996). The non-simultaneous observations by the Green Bank telescope imply flux densities of at 1.4 GHz and at 4.85 GHz, respectively, and the spectral index between 1.4 and 4.85 GHz is flat with (Becker et al., 1991; White & Becker, 1992). In the higher frequency range, J0946+1017 was observed at 8.4 GHz with the Very Large Array (VLA) within the framework of the Combined Radio All-Sky Targeted Eight GHz Survey (CRATES, Healey et al., 2007) with mJy flux density and at 22 GHz with the VLBI Exploration of Radio Astrometry (VERA) instrument with mJy flux density (Petrov et al., 2007).
The Faint Images of the Radio Sky at Twenty-Centimeters (FIRST, Becker et al., 1995) survey image of J0946+1017, with rms of , reveals a two-component morphology as shown in Figure 2. The core component is consistent in position with J0946+1017 in the optical and has an integrated flux density of , while the secondary component is (i.e., projected distance of at rest frame) separated in north-west direction from the core and has an integrated flux density of and a side-lobe probability of only = 0.025 (Helfand et al., 2015).
In addition, Very Long Baseline Array (VLBA) observations of J0946+1017 at 5 GHz revealed a core brightness temperature of and a discernible jet feature with an angular extent less than 6 milliarcseconds, implying a jet on tens of parsec scale (Linford et al., 2012). By using the Green Bank flux density (White & Becker, 1992) and the SDSS -magnitude, we calculate the radio loudness of J0946+1017 as after the -correction with radio spectral index (White & Becker, 1992) and optical spectral index obtained from the spectral fitting (Section 2.2). Even considering radio variability, J0946+1017 is still an extremely radio-loud AGN, and one of the radio-loudest among known NLS1 galaxies.
3.2 Near-infrared and optical variability
J0946+1017 was observed with the Wide-field Infrared Survey Explorer (WISE; Wright et al., 2010) in four bands , , and centred at 3.4, 4.6, 12 and 24 m, respectively. We employed the ALLWISE and NEOWISE database (Mainzer et al., 2014). Due to the depletion of the satellite’s cooling material (Mainzer et al., 2014), we only constructed the Near-infrared (NIR) light curves of J0946+1017 in and which correspond to J0946+1017 emission at m and 2.3 m at rest frame, respectively, We use and photometry data with S/N10 and reduced lower than 2 based on profile fitting111The image processing and data quality details can be found in http://wise2.ipac.caltech.edu/docs/release/allsky/expsup/. in which case of the data points are discarded.
The and light curves of J0946+1017 are displayed in Figure 3. Intra-day variability of flux is detected with -values of per cent using the -test against the null hypothesis of no variation in 2015 November. The rapid variability restricts the size of the emitting region to be much smaller than the scale of the torus, implying a jet origin (see also Jiang et al., 2012; Gabanyi et al., 2018a; Rakshit et al., 2019). On timescale of years, the NIR flux varied by nearly 0.4 dex from May 2014 to November 2015. We also explore the color variation . But no significant color variability has been found.
We have checked the archival photometry of the Catalina Real Time Transient Survey (CRTS, Drake et al., 2009) and the Panoramic Survey Telescope & Rapid Response System (Pan-STARRS, Chambers et al., 2016) of J0946+1017 in the optical bands. CRTS has monitored J0946+1017 from May 2005 to January 2014. In spite of large uncertainties, the CRTS light curve reveals clear variability of J0946+1017 in the synthetic -band, which brightened by magnitude from 2006 to 2010 and then became fainter again. Pan-STARRS monitored J0946+1017 in the -bands between January 2010 and April 2014, and it also captured the slow decrease of the source’s brightness after 2010 in all five bands.
3.3 High-energy emission
3.3.1 X-ray emission
The ROSAT All-Sky Survey (RASS; Voges et al., 1999) performed in 1990-1991 has covered the position of J0946+1017. Following the method in Yuan et al. (2014), we obtain a flux upper limit of in the band 0.1-2.4 keV at the 99% confidence level.
We proposed an XMM-Newton pointing observation of ks on J0946+1017 which was carried out on 2017 November 3 (ObsID 0800040101). The data are reduced with the XMM-Newton Science Analysis System222https://www.cosmos.esa.int/web/xmm-newton/what-is-sas (version 15) following standard procedures. The source position in the X-rays (R.A.=09:46:35.08, Dec=+10:17:06.04) is well consistent with that in SDSS image within 1 arcsec. The source events are extracted from a circle of 40″ radius centred at source position for data from the PN CCD arrays (Strüder et al., 2001), while the background events are extracted from a circle of the same radius in a source-free region nearby. The spectrum is binned to contain at least 25 counts per bin required for analysis. xspec v.12.9.0 (Arnaud, 1996) is used for spectral modeling over the 0.310 keV energy range. We find that the spectrum can be well fitted () by a single power law and Galactic hydrogen absorption with column density of (Kalberla et al., 2005). The fit is slightly improved () if we add a black body component, and we find a temperature of keV at rest frame (Figure 4). The best-fit photon index is , which is relatively flat among the population of normal radio-quiet NLS1s (e.g. Grupe et al., 2010), but similar to other -ray emitting NLS1s (, e.g. Abdo et al., 2009b). The total unabsorbed flux based on this model is and , with corresponding luminosities of and , respectively.
3.3.2 -ray emission
-ray emission from the direction of J0946+1017 was reported by Fermi/LAT. The source 4FGL J0946.6+1016 was identified with the radio source TXS 0943+105 with association probability (The Fermi-LAT collaboration, 2019). The significance of the -ray detection increases from in the LAT 1-year point source catalog (1FGL, Abdo et al., 2010) to in the LAT 8-year point source catalog (4FGL, The Fermi-LAT collaboration, 2019). The flux (luminosity) between and also increases from ( ) to ( ), with a constant photon index of 2.4 assuming a power-law slope.
J0946+1017 underwent a giant -ray flare on July 2nd, 2014, with a daily average -ray flux about 25 times greater than the average flux reported in the 2FGL catalogue (Ciprini, 2014).
4 Discussion and conclusions
J0946+1017 is the highest-redshift -ray emitting NLS1 known to date. It is one of the radio-loudest, and one of the few which show high-amplitude -ray flaring. Its Balmer decrement H/H, implies little optical extinction. Its black hole mass, either derived from the Lorentzian fit () or Gaussian fit () based on the single-epoch scaling relation between Balmer line parameters and BH mass (Vestergaard & Peterson, 2006), is at the lower end of BH masses in typical blazars, but at the high end of the NLS1 distribution. This result agrees well with the estimates of based on Mg ii lines (Shen et al., 2008; Rafiee & Hall, 2011; Shaw et al., 2012). Therefore J0946+1017 is an important cornerstone object bridging the two regimes. The monochromatic luminosity at 5100 Å is estimated to be from the H luminosity based on the relation given in Zhou et al. (2006), as the observed flux at 5100 Å is likely contaminated by the beamed jet emission. With a bolometric correction of (McLure & Dunlop, 2004), the Eddington ratio of J0946+1017 then is ; typical of a NLS1.
While many of the radio-loud NLS1 galaxies have very compact radio emission in FIRST or in dedicated radio imaging (e.g. Komossa et al., 2006; Gu et al., 2015; Berton et al., 2018), J0946+1017 is remarkable in showing widely extended radio emission in FIRST, on a (projected) spatial scale of 120 kpc. Several other NLS1 galaxies with very extended radio emission have been identified (e.g. Gliozzi et al., 2010; Doi et al., 2012; Richards & Lister, 2015; Gabányi et al., 2018b; Rakshit et al., 2018; Singh & Chand, 2018), however, only few of them exceed 100 kpc (e.g., SDSS J103024.95+551622.7, Rakshit et al. 2018; SDSS J110006.07+442144.3, Gabányi et al. 2018b; and SDSS J094857.3+002225 with 395 kpc, Komossa et al. 2006).
The SED of J0946+1017 (Figure 5) broadly resembles that of other -ray NLS1s (with three peaks in the radio, ultraviolet and -ray bands, respectively, Yao et al. 2015), which have been well fitted by leptonic jet models, which require external Compton scattering in the high-energy regime, with seed photons from the accretion disk, broad-line region, and/or torus. The overall flatness of the X-ray spectrum implies the dominance of jet emission, but the XMM spectrum can be well fit by a two-component model including thermal emission at low energies. The IR variability on timescales of months to days implies that the emission is not from the dusty torus, but rather related to the jet. Multi-band monitoring of future high-amplitude flaring of J0946+1017 will provide us with important probes of the jet physics in the radio-loudest AGN.
Acknowledgements
We thank the anonymous referee for the very helpful comments and A. Lobanov for useful remarks. SY thanks A. Y. Yang for her help with plotting Fugire 2. SY acknowledges support by the KIAA-CAS Fellowship, which is jointly supported by Peking University and the Chinese Academy of Sciences. WJL acknowledges supports from the Natural Science Foundation of China (NSFC) grant No. 11703079 and the "Light of West China" Programme of Chinese Academy of Sciences (CAS). WY thanks the support from the National Science Foundation of China (NSFC-11703076) and the West Light Foundation of the Chinese Academy of Sciences (Y6XB016001). XBW thanks the supports by the Ministry of Science and Technology of China under grant 2016YFA0400703, the NSFC grants No.11721303 and 11533001. This research made use of data taken from SDSS-BOSS, FIRST, WISE, CRTS, Pan-STARRS, and XMM-Newton. This research has made use of data taken from TripleSpec on P200 telescope through the Telescope Access Program (TAP). This research has made use of the NASA/IPAC Infrared Science Archive and Extragalactic Database (NED), which are operated by the Jet Propulsion Laboratory, California Institute of Technology, under contract with the National Aeronautics and Space Administration.
The reference list from the paper itself. Each links out to its DOI / PubMed record.
- 1Abdo et al. (2009 a) Abdo A. A., et al., 2009 a, Ap J , 699, 976 · doi ↗
- 2Abdo et al. (2009 b) Abdo A. A., et al., 2009 b, Ap J , 707, L 142 · doi ↗
- 3Abdo et al. (2010) Abdo A. A., et al., 2010, Ap JS , 188, 405 · doi ↗
- 4Acero et al. (2015) Acero F., et al., 2015, The Astrophysical Journal Supplement Series , 218, 23 · doi ↗
- 5Andrae et al. (2018) Andrae R., et al., 2018, A&A , 616, A 8 · doi ↗
- 6Arnaud (1996) Arnaud K. A., 1996, in Jacoby G. H., Barnes J., eds, Astronomical Society of the Pacific Conference Series Vol. 101, Astronomical Data Analysis Software and Systems V. p. 17
- 7Becker et al. (1991) Becker R. H., White R. L., Edwards A. L., 1991, Ap JS , 75, 1 · doi ↗
- 8Becker et al. (1995) Becker R. H., White R. L., Helfand D. J., 1995, Ap J , 450, 559 · doi ↗