Coexistence of polar displacements and conduction in doped ferroelectrics: an ab initio comparative study
Chengliang Xia, Yue Chen, Hanghui Chen

TL;DR
This study uses first-principles calculations to compare doped LiNbO₃ and BaTiO₃, revealing that polar displacements can coexist with conduction in doped LiNbO₃, suggesting potential for polar metallic phases and new device functionalities.
Contribution
It demonstrates that polar distortions persist in doped LiNbO₃ at high electron concentrations, unlike in BaTiO₃, highlighting the potential for polar metals in LiNbO₃-type oxides.
Findings
Polar displacements persist in doped LiNbO₃ at high doping levels.
Polar displacements in doped BaTiO₃ vanish at lower doping levels.
Conduction electrons are non-uniformly distributed in doped LiNbO₃.
Abstract
Polar metals are rare because free carriers in metals screen electrostatic potential and eliminate internal dipoles. Degenerate doped ferroelectrics may create an approximate polar metallic phase. We use first-principles calculations to investigate -doped LiNbO-type oxides (LiNbO as the prototype) and compare to widely studied perovskite oxides (BaTiO as the prototype). In the rigid-band approximation, substantial polar displacements in -doped LiNbO persist even at 0.3 /f.u. ( 10 cm), while polar displacements in -doped BaTiO quickly get suppressed and completely vanish at 0.1 /f.u. Furthermore, in -doped LiNbO, Li-O displacements decay more slowly than Nb-O displacements, while in -doped BaTiO, Ba-O and Ti-O displacements decay approximately at the same rate. Supercell calculations that use oxygen vacancies as…
Click any figure to enlarge with its caption.
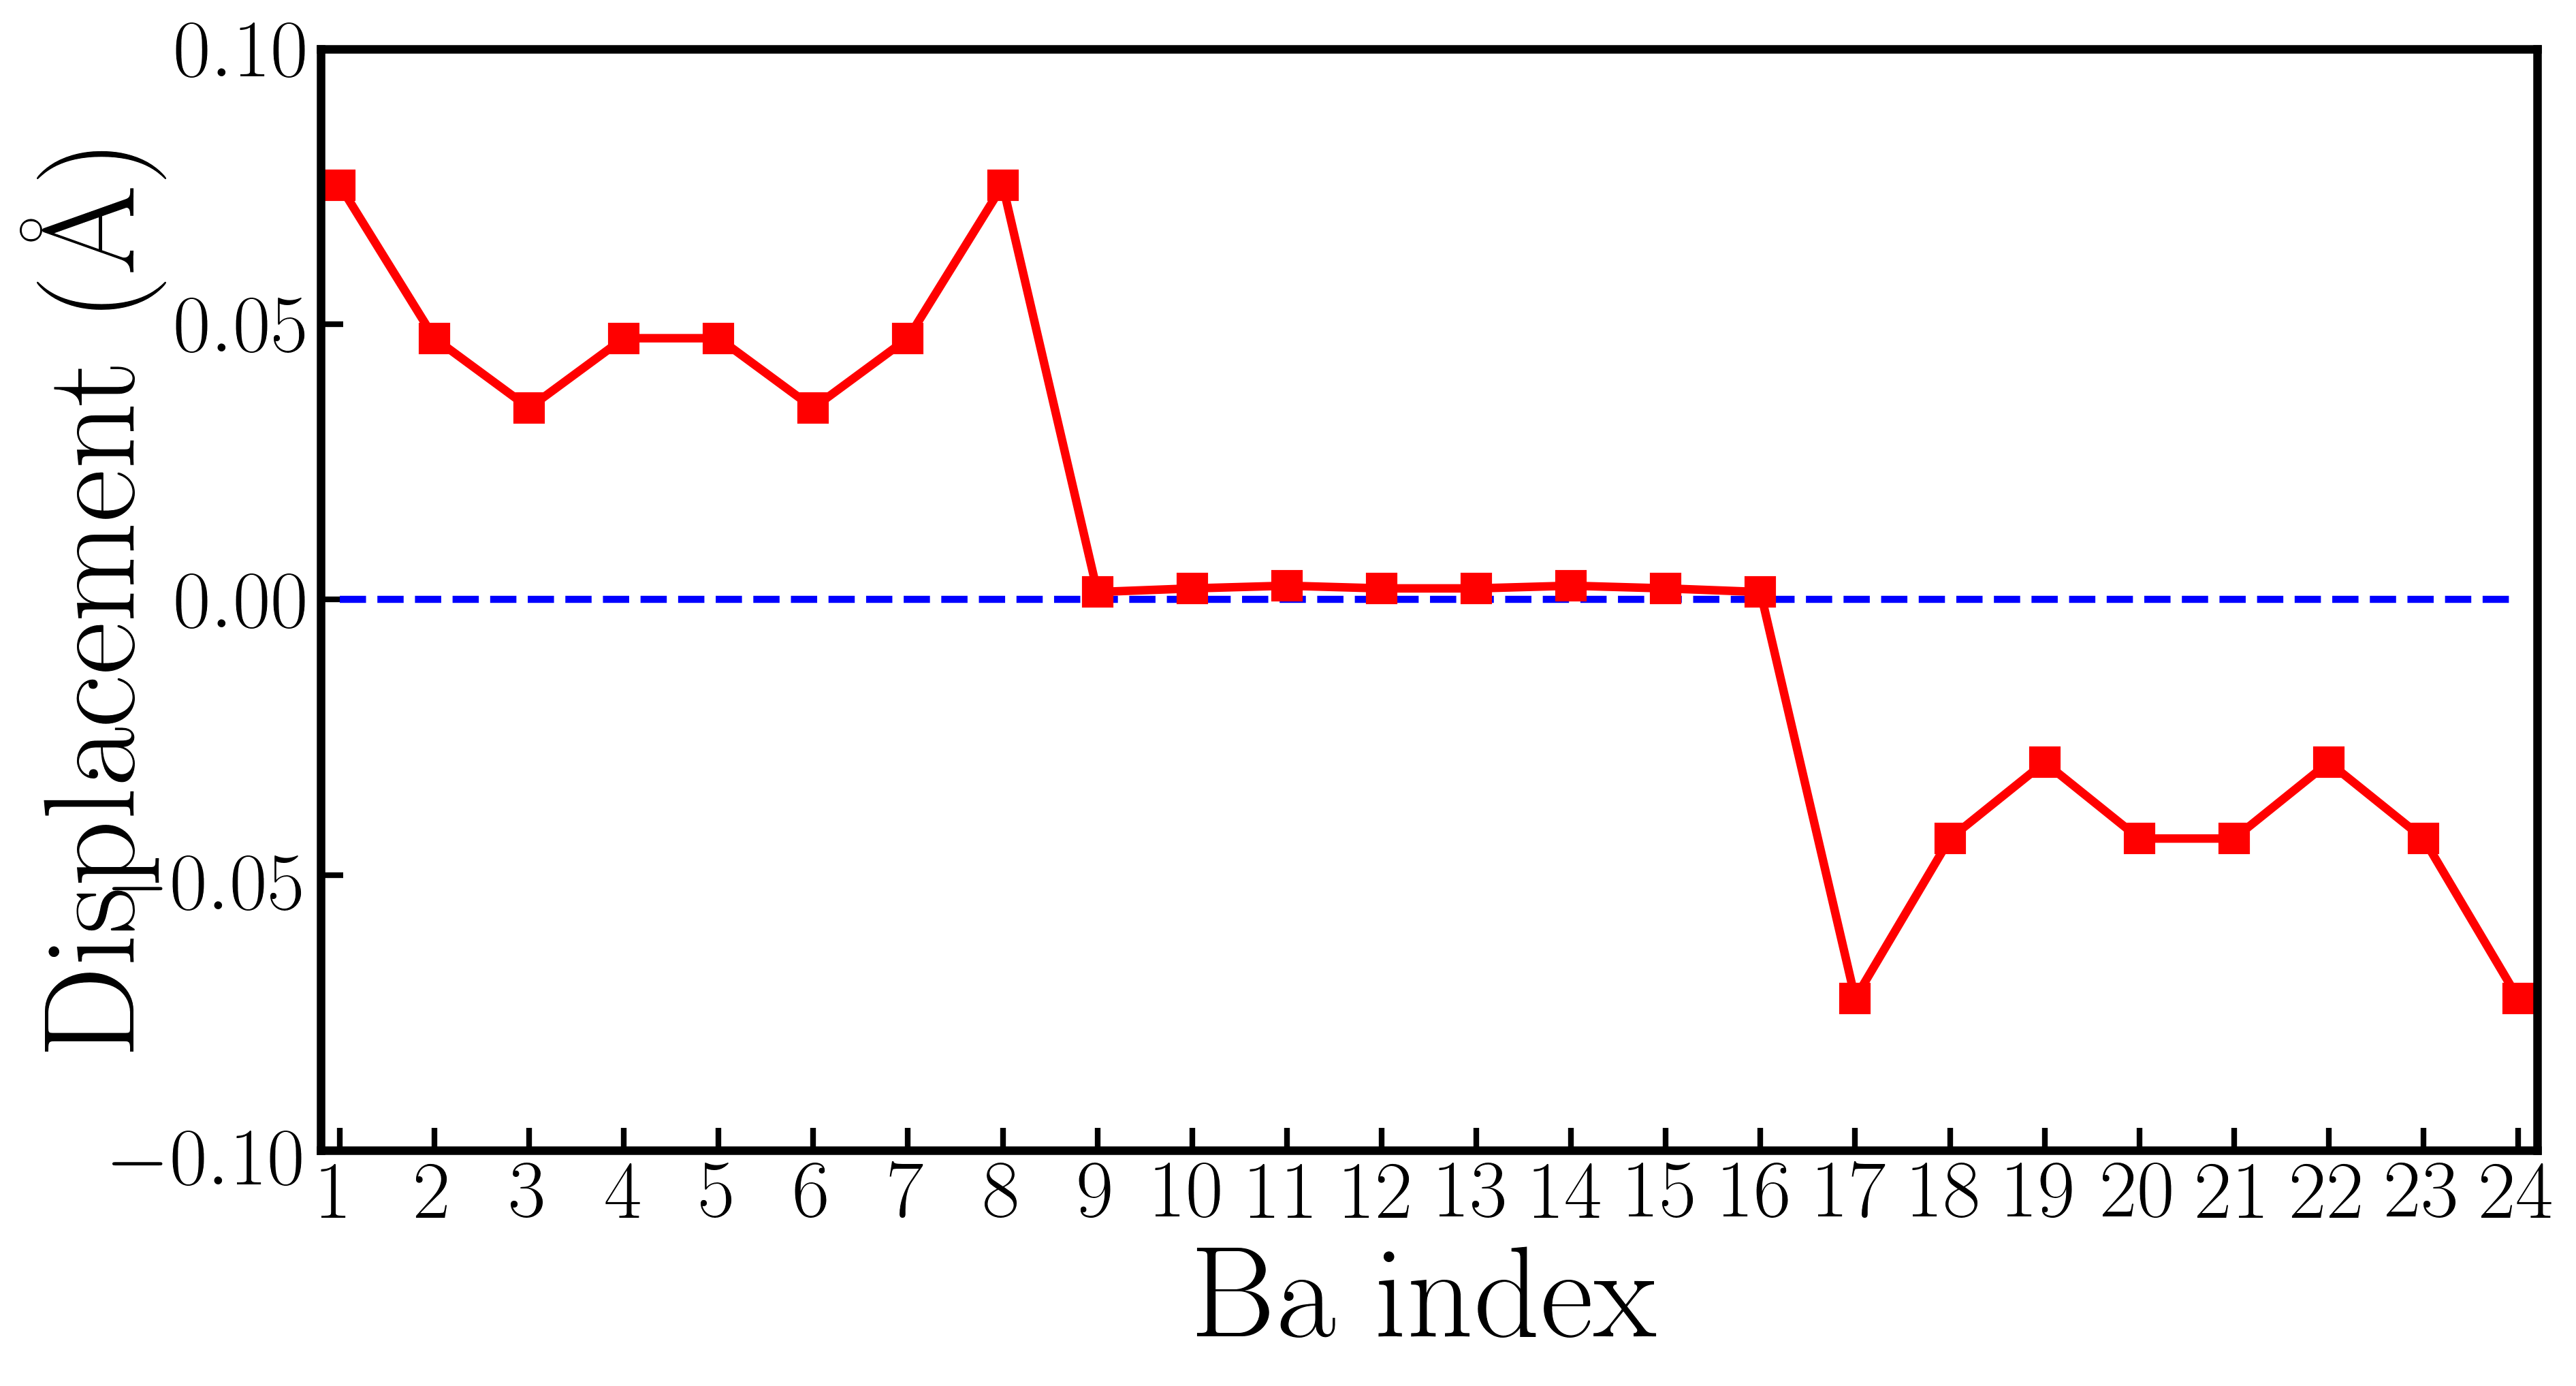 Figure 1
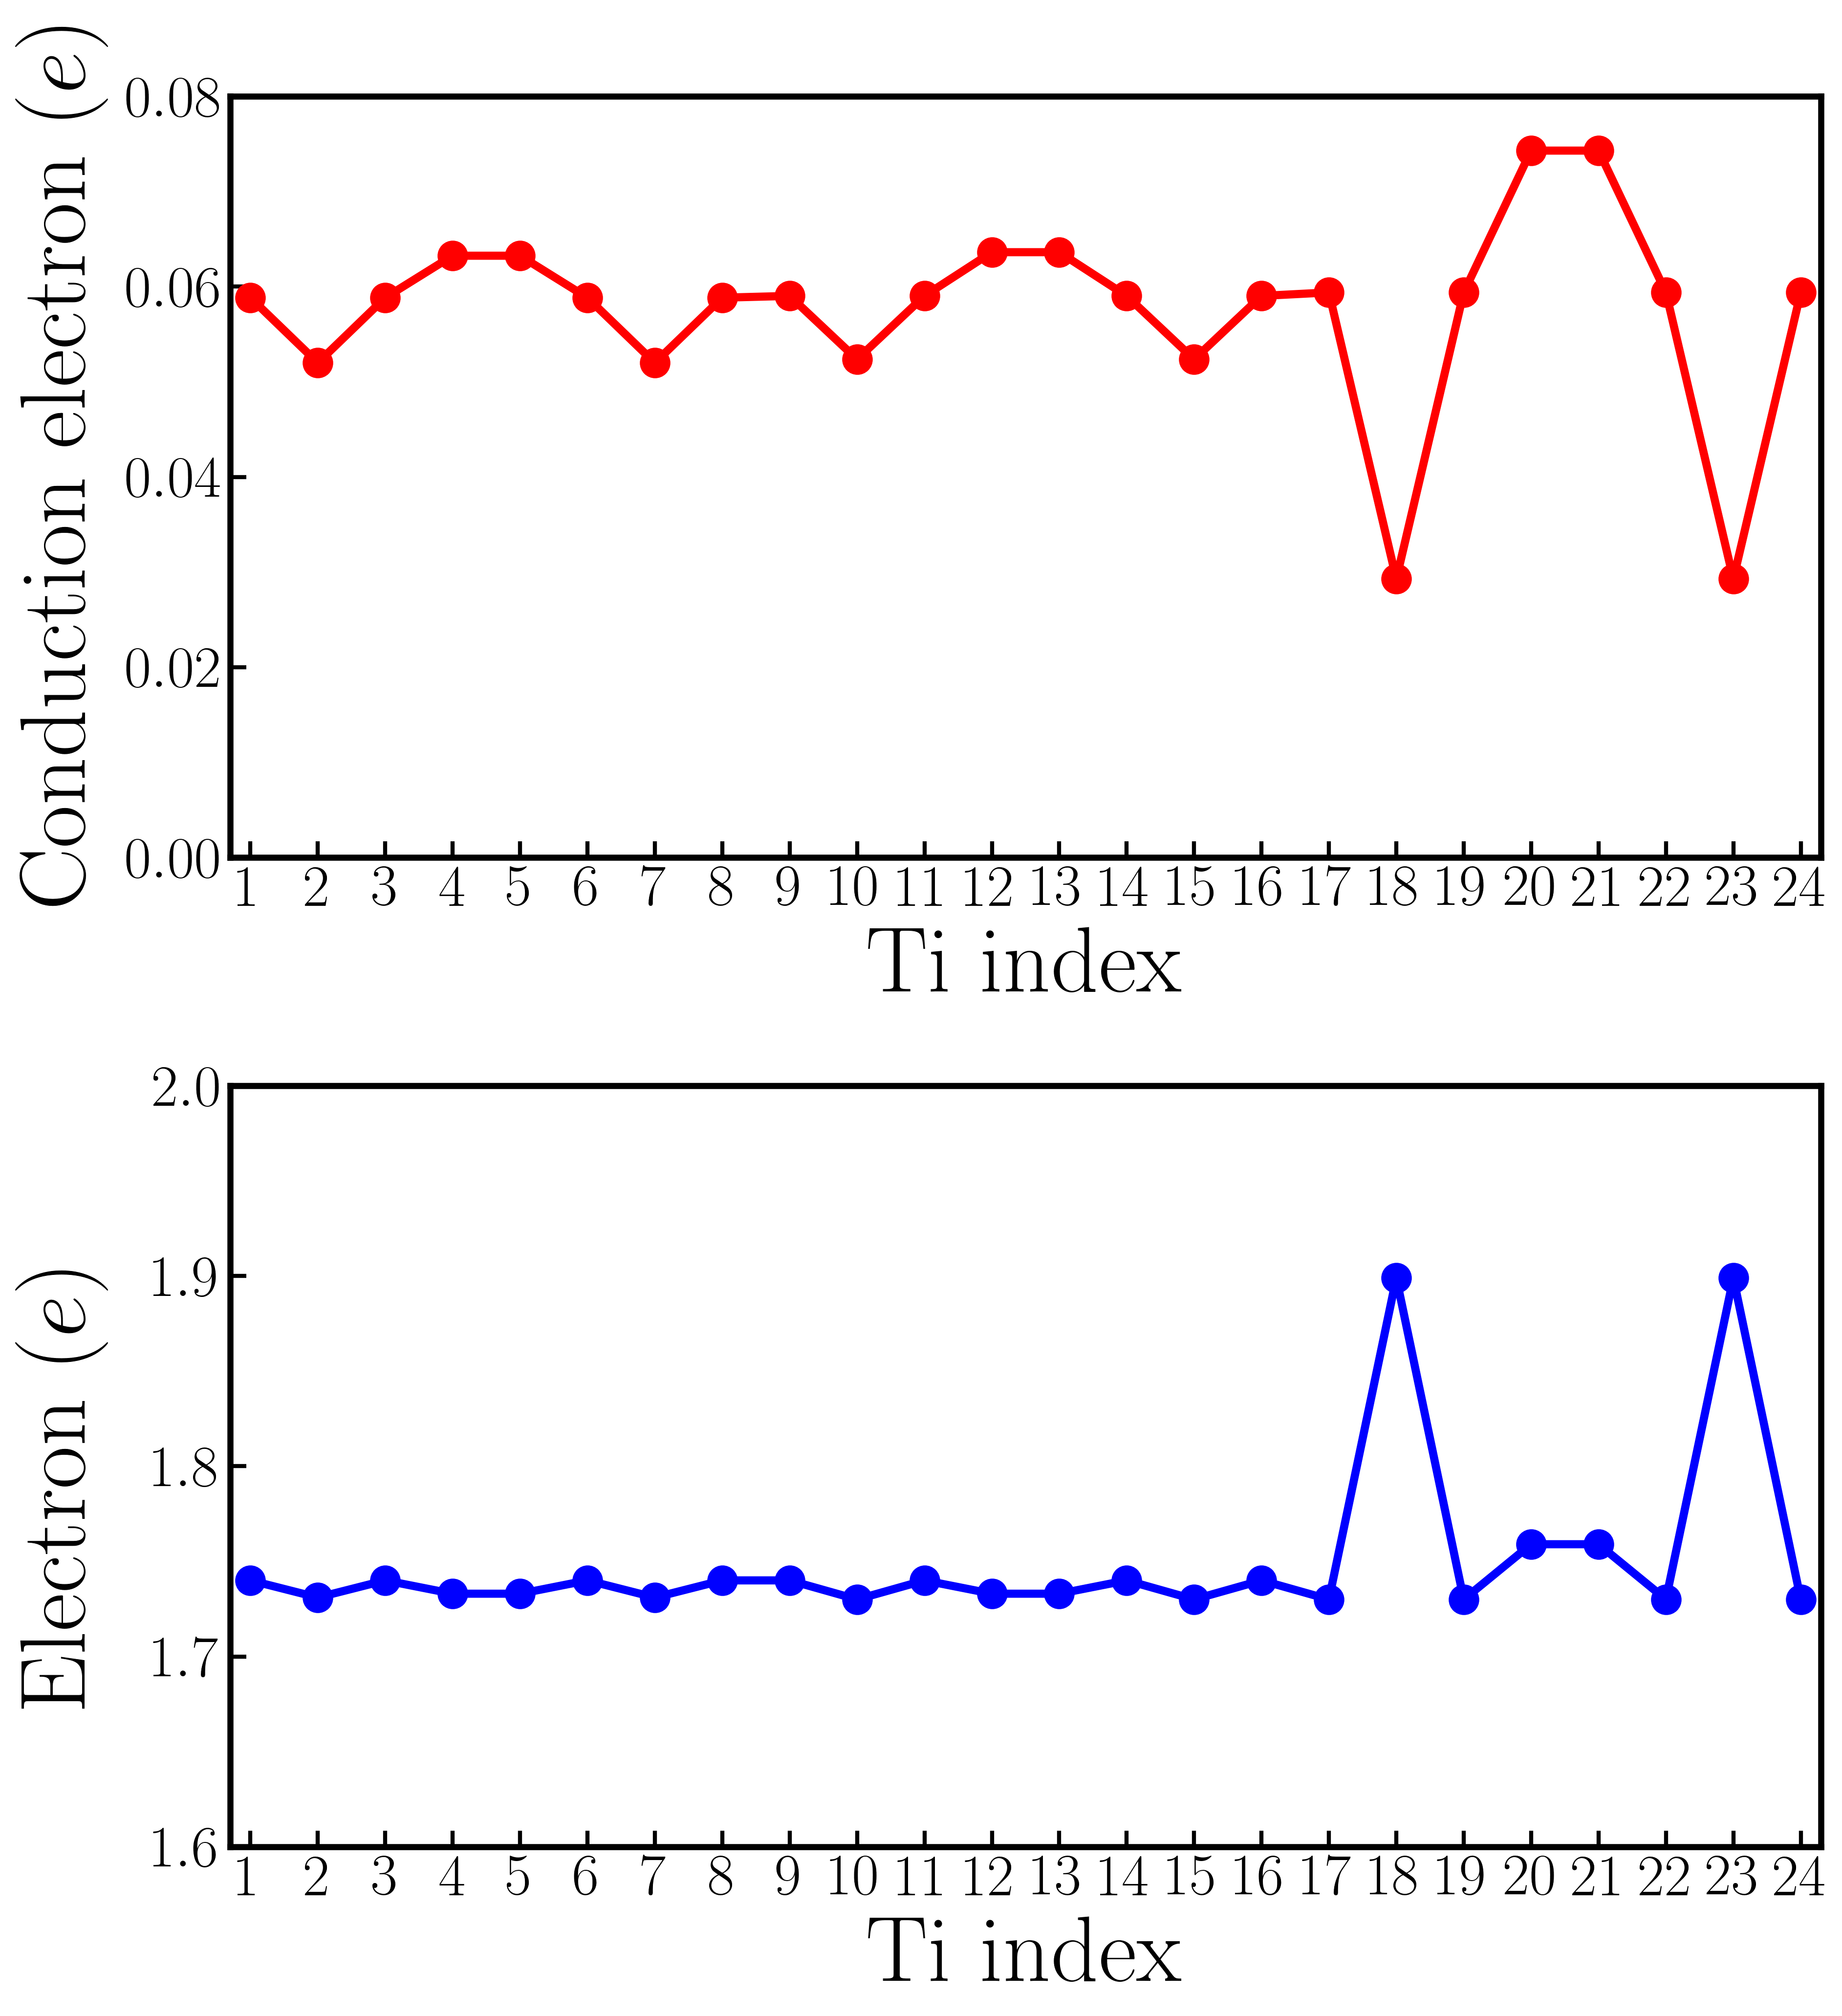 Figure 2
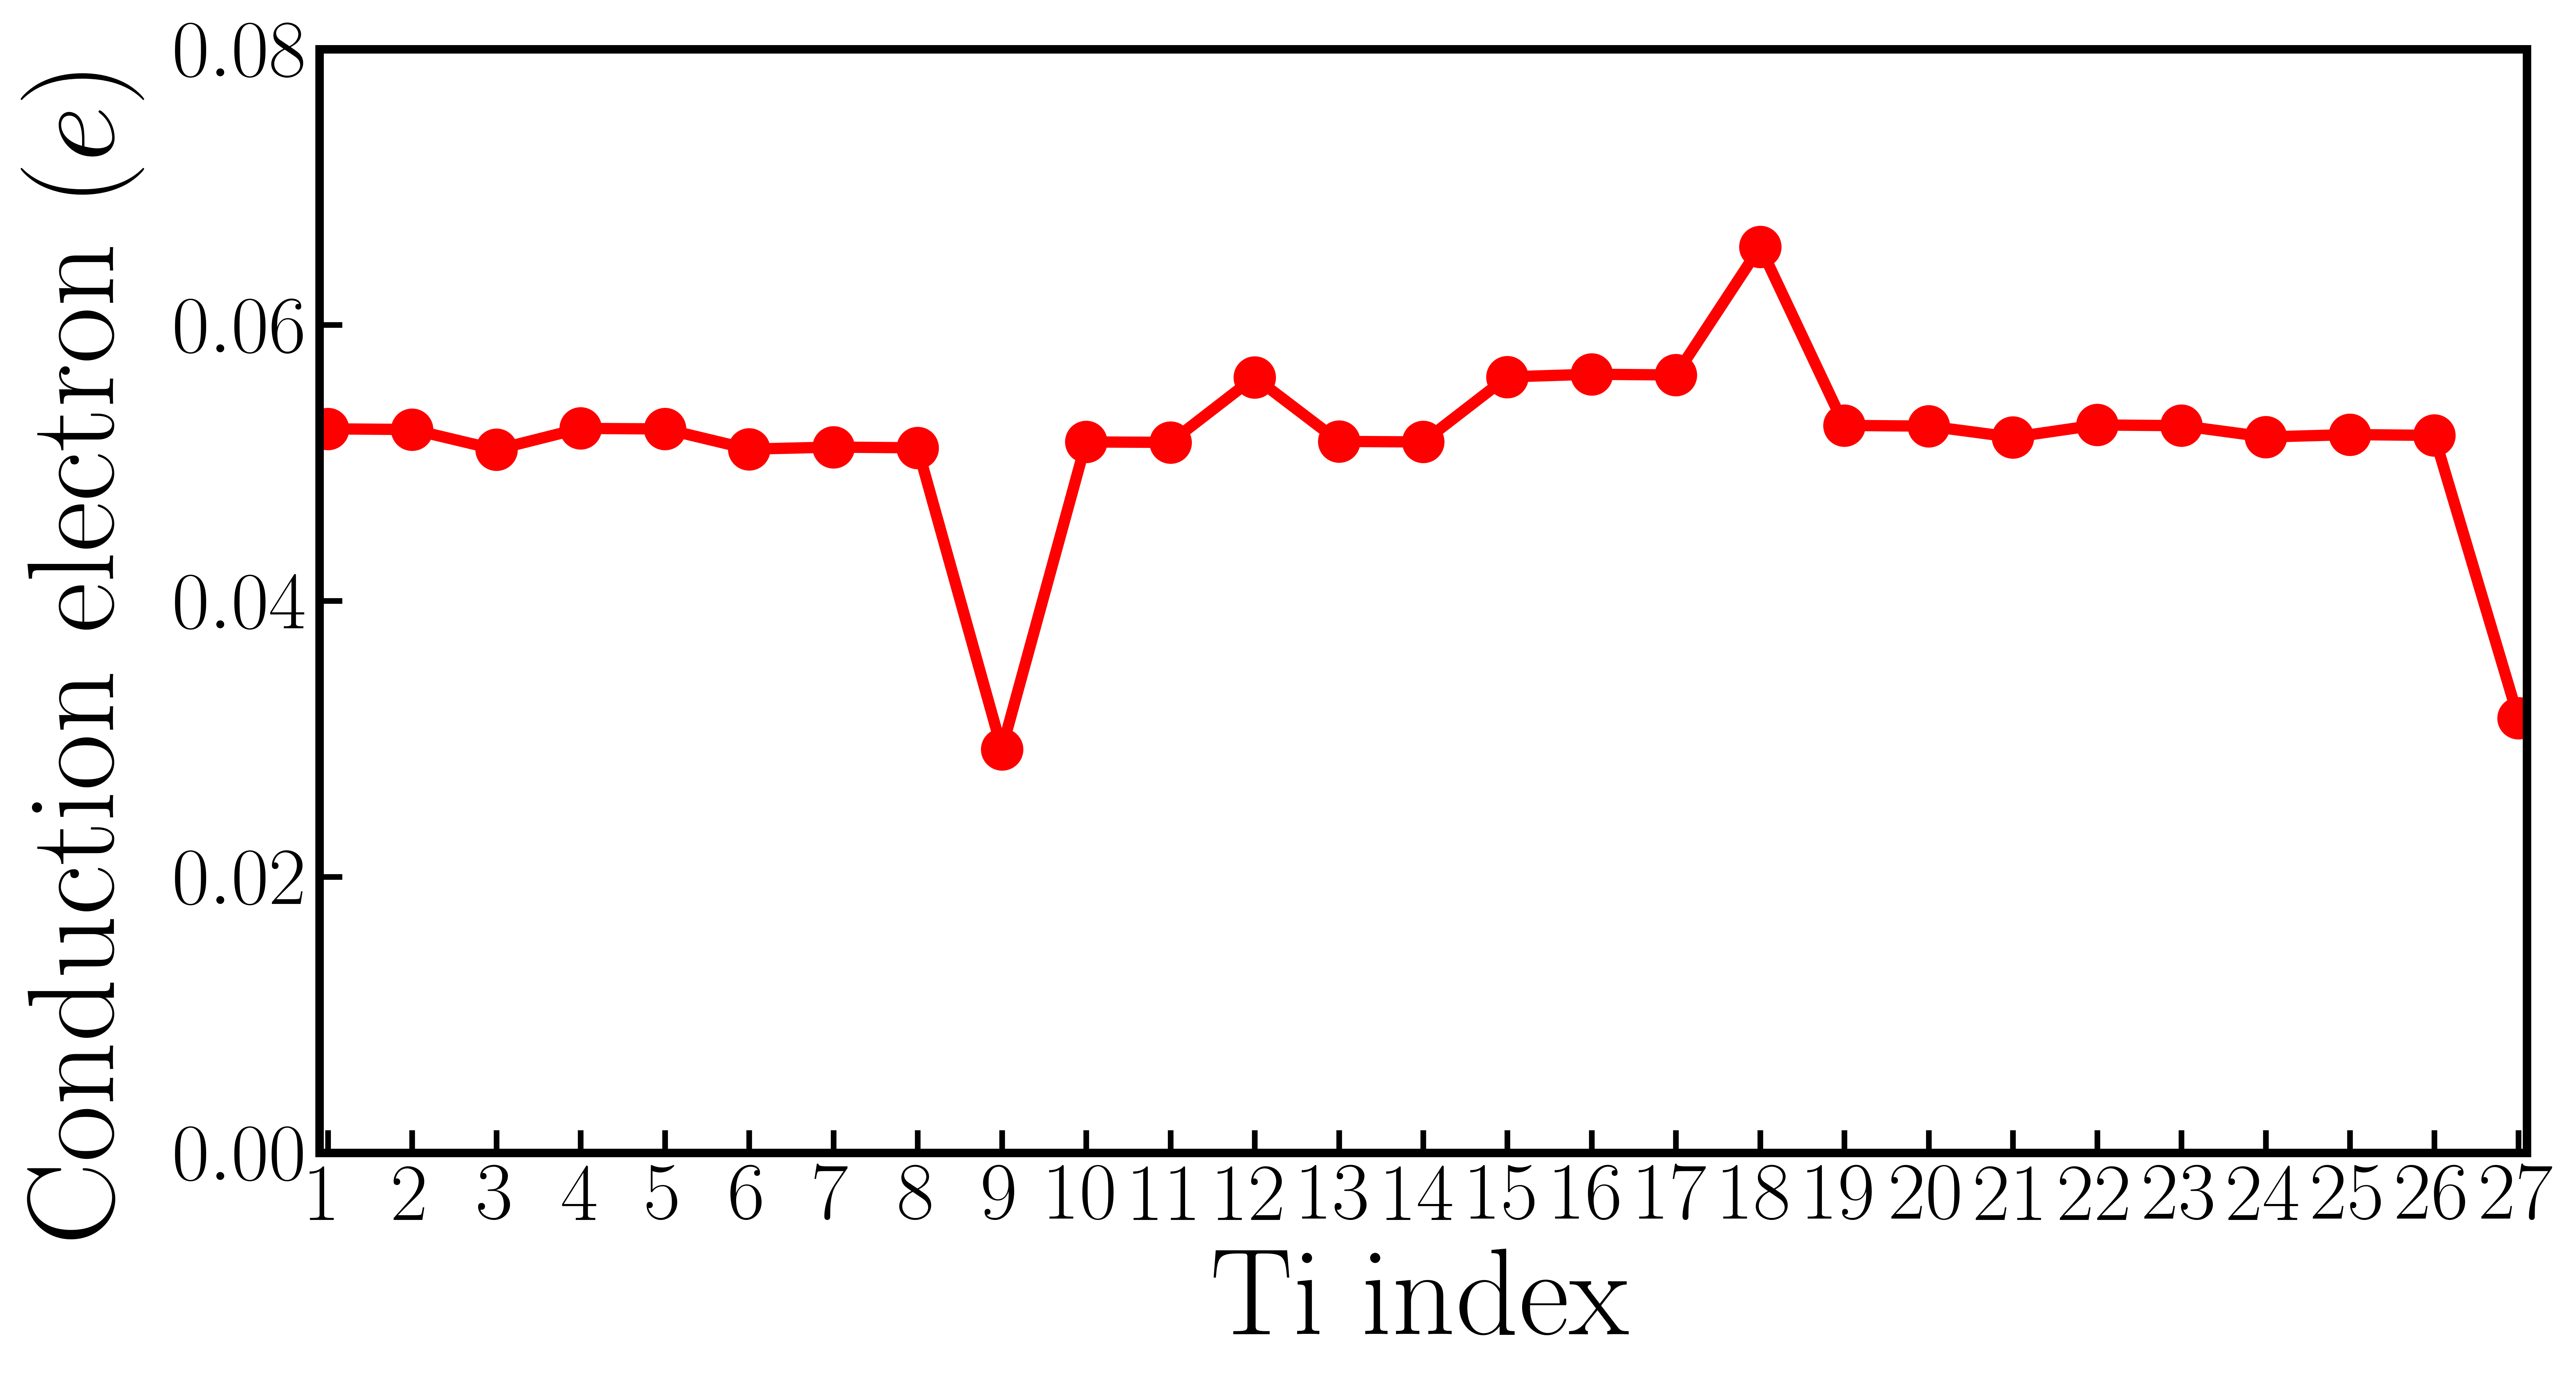 Figure 3
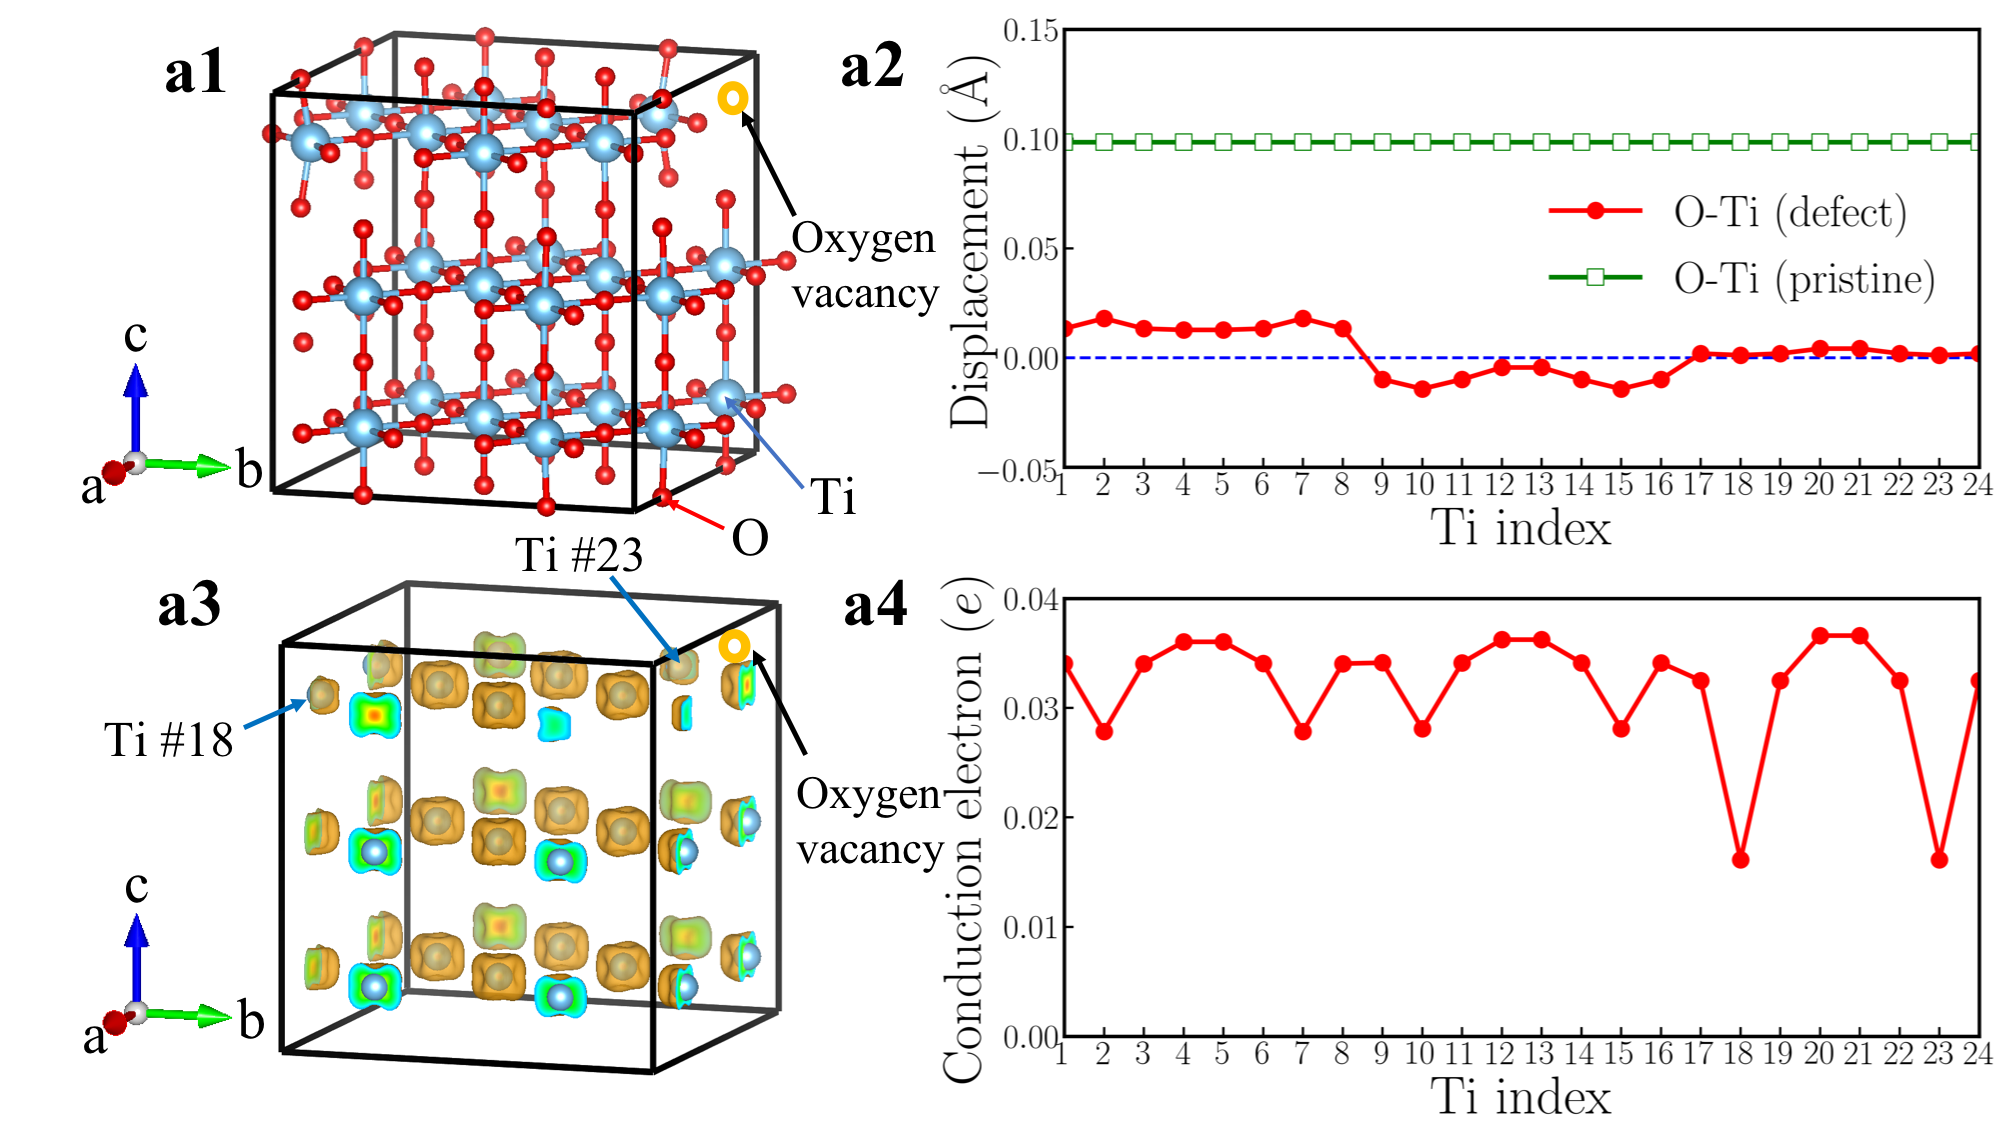 Figure 4
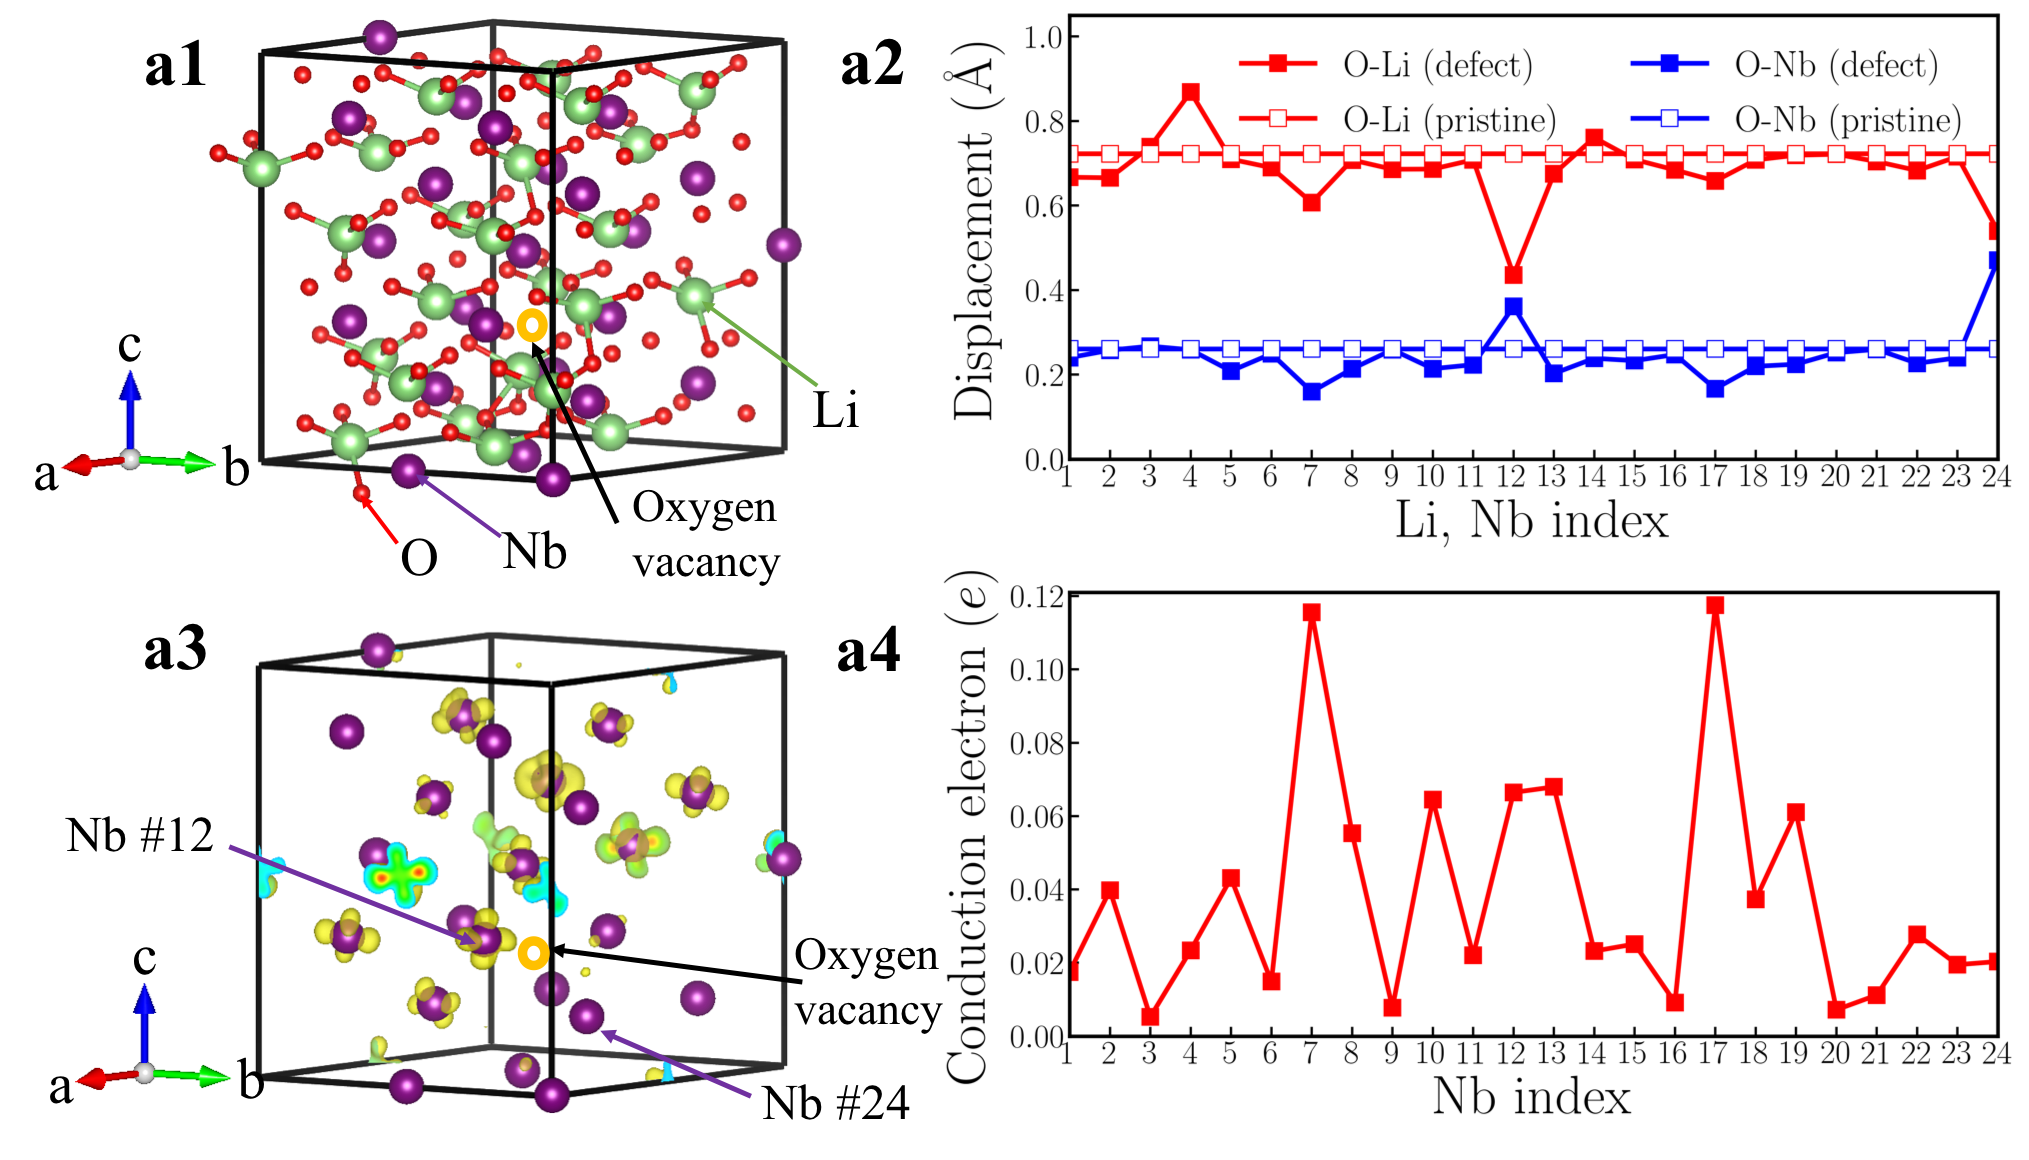 Figure 5
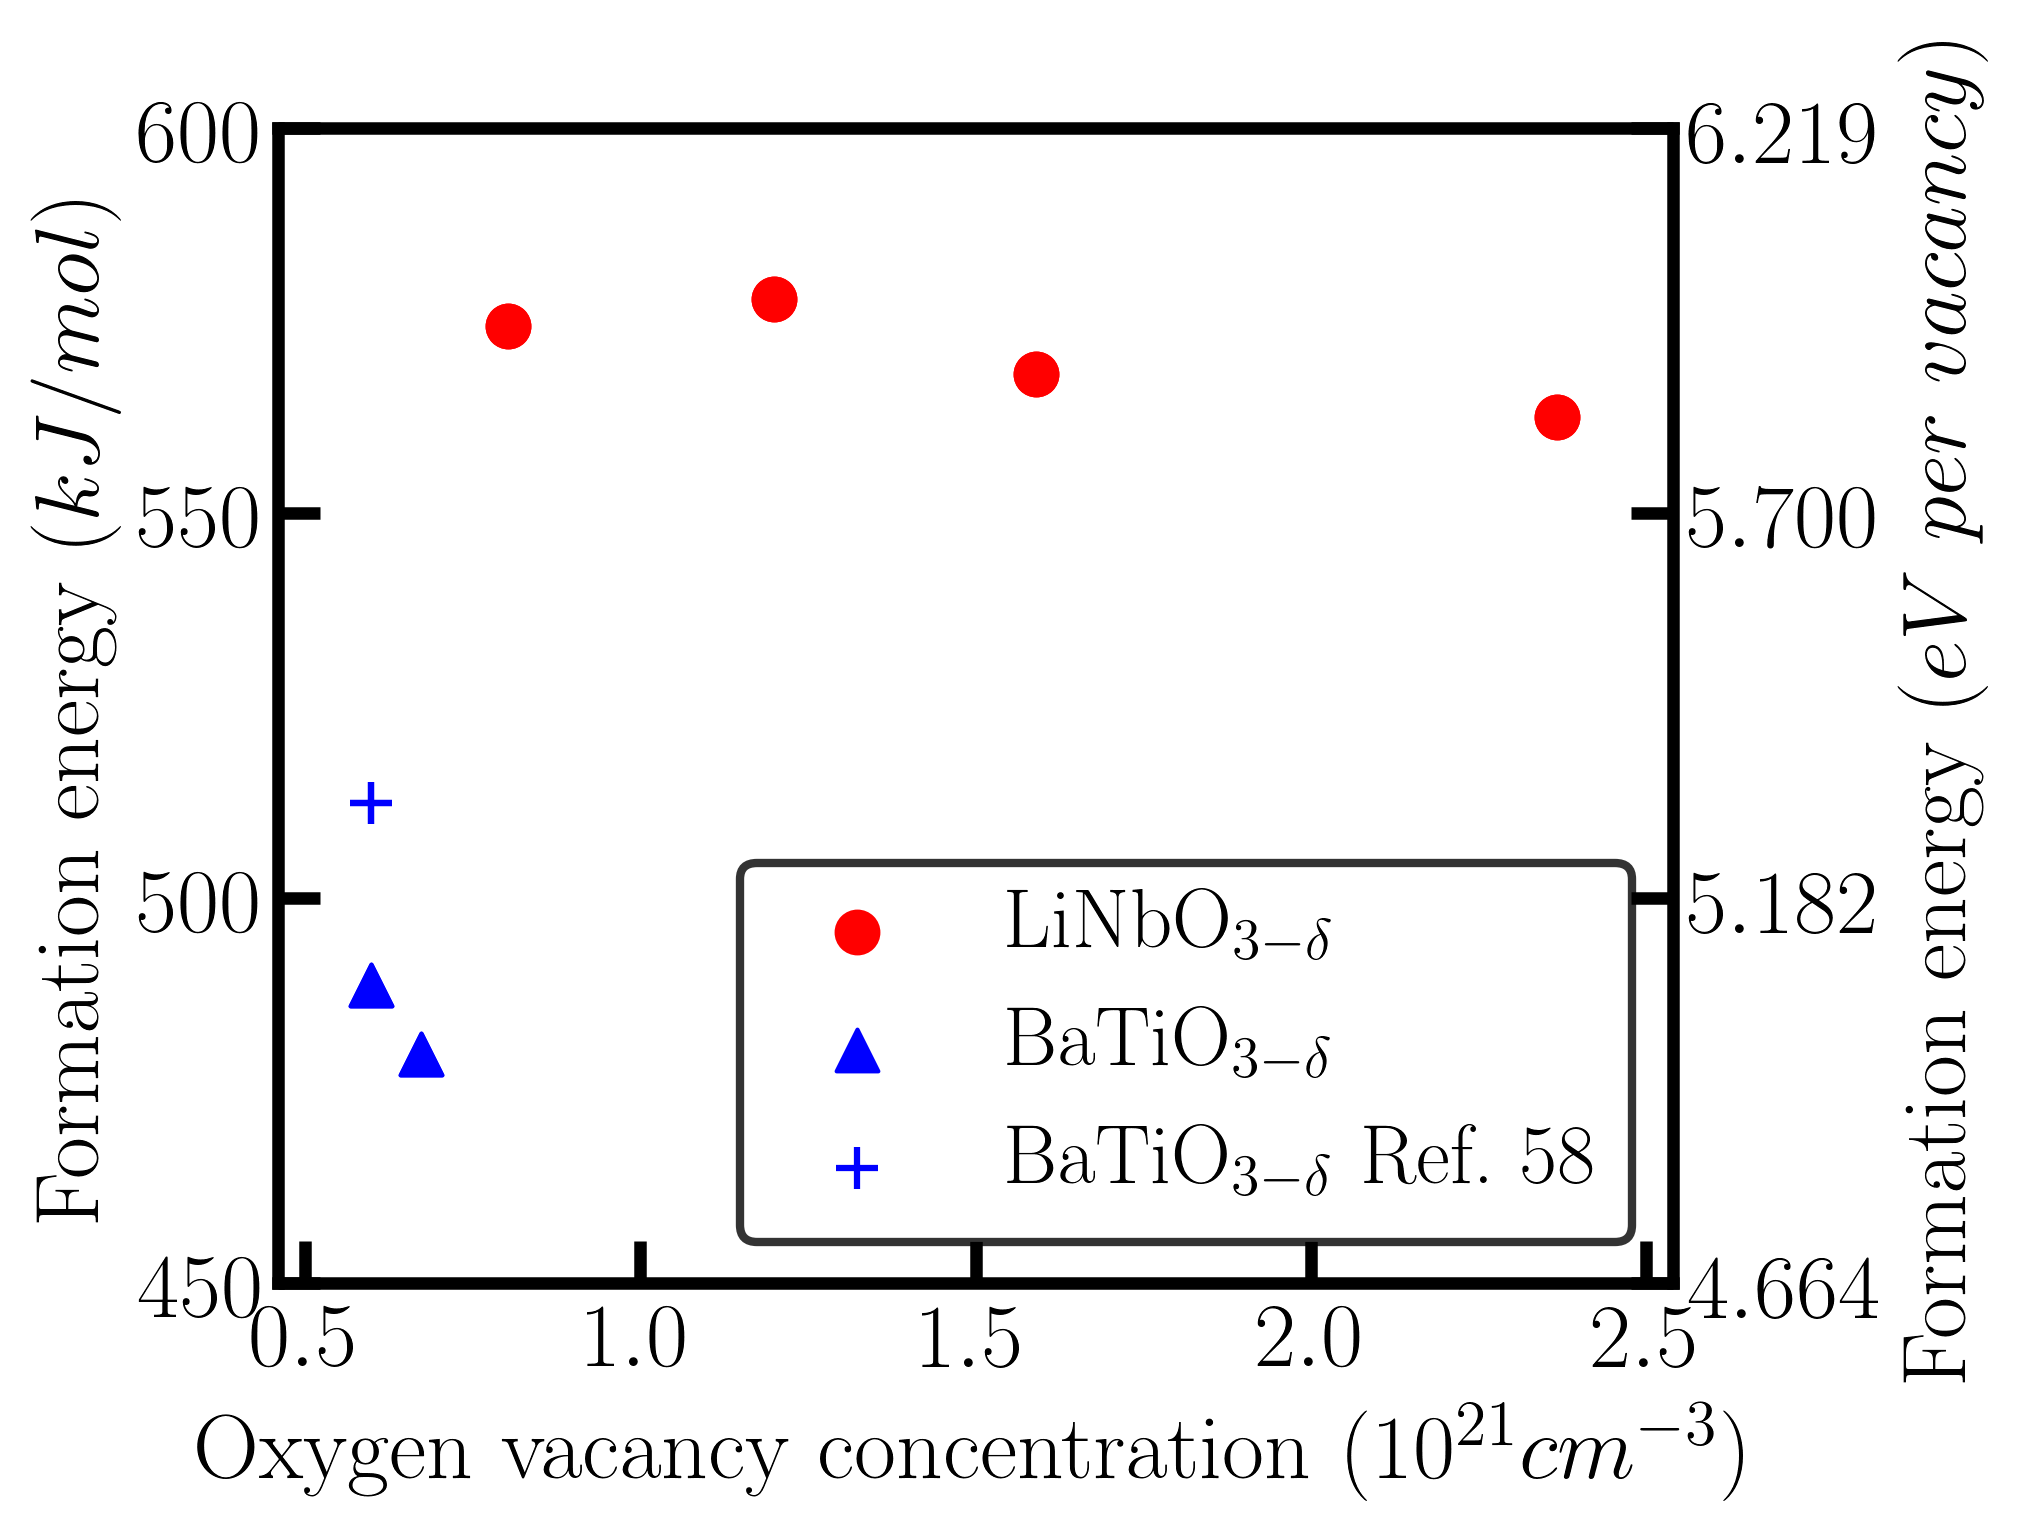 Figure 6
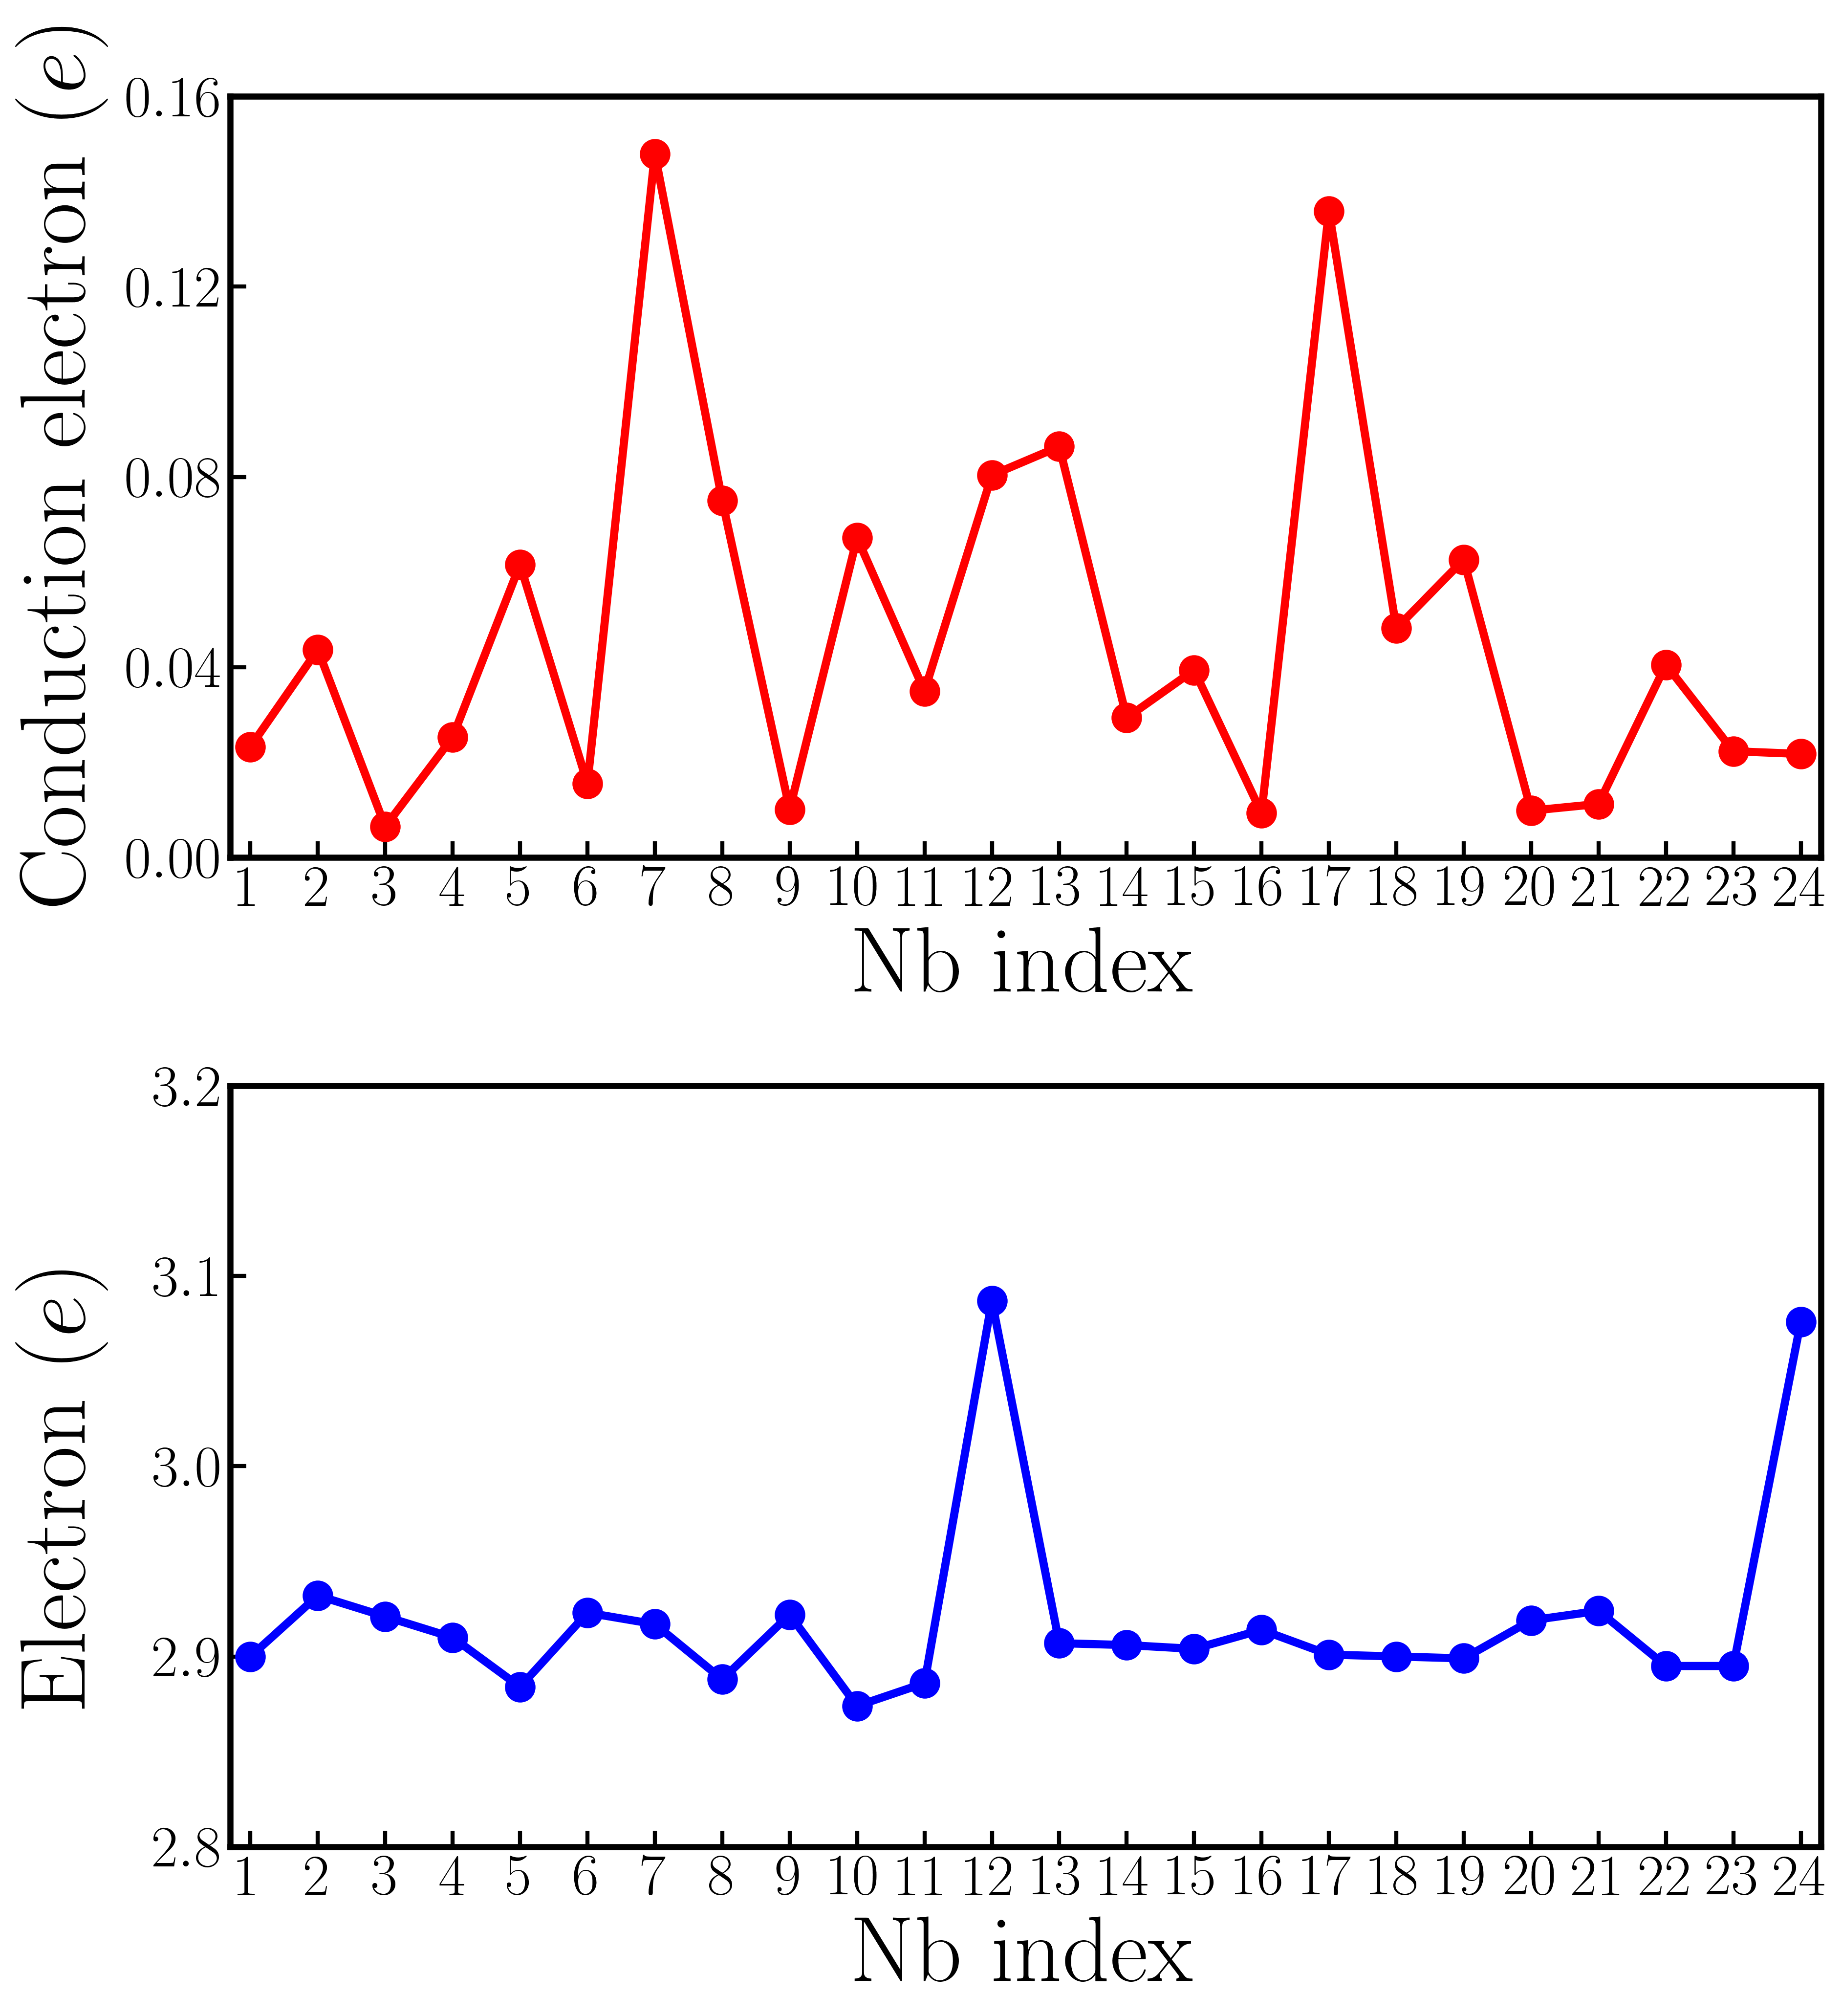 Figure 7
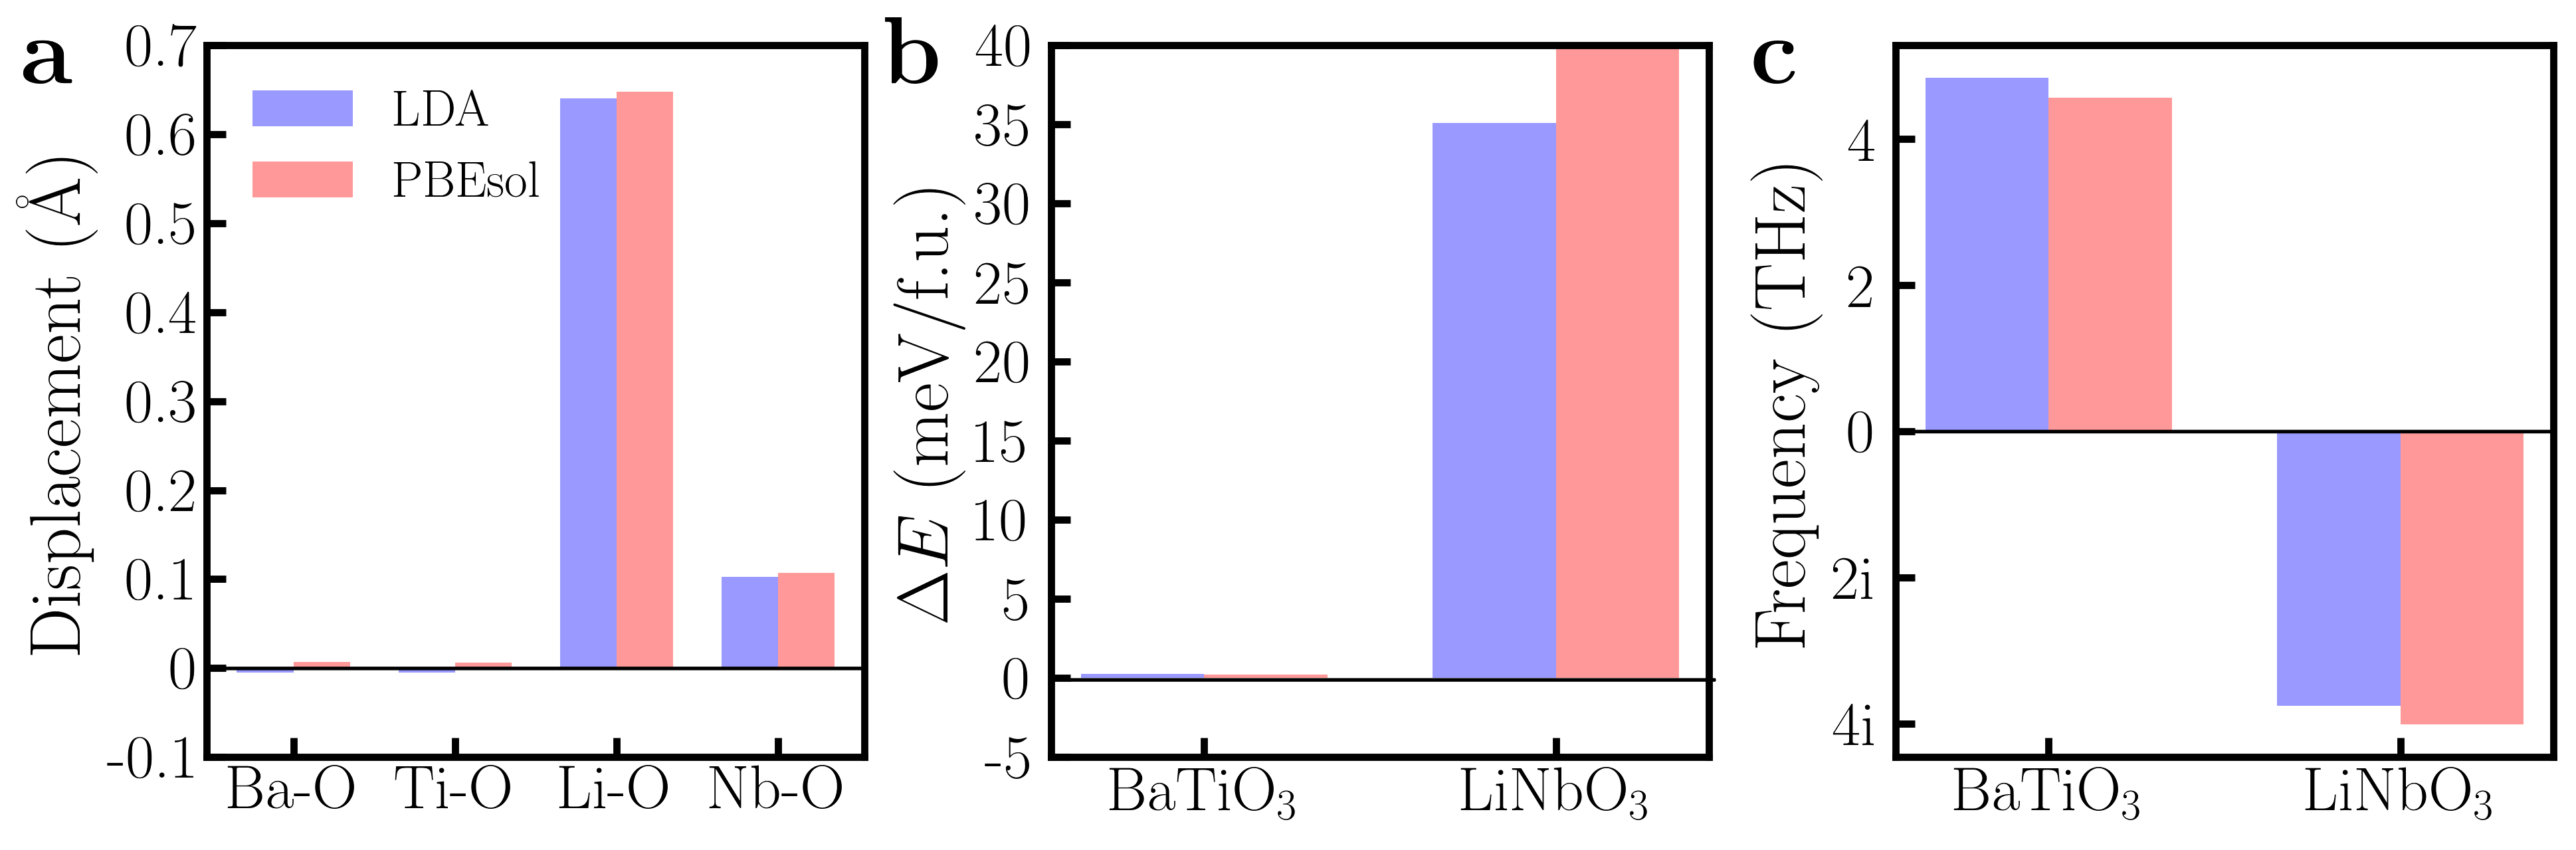 Figure 8
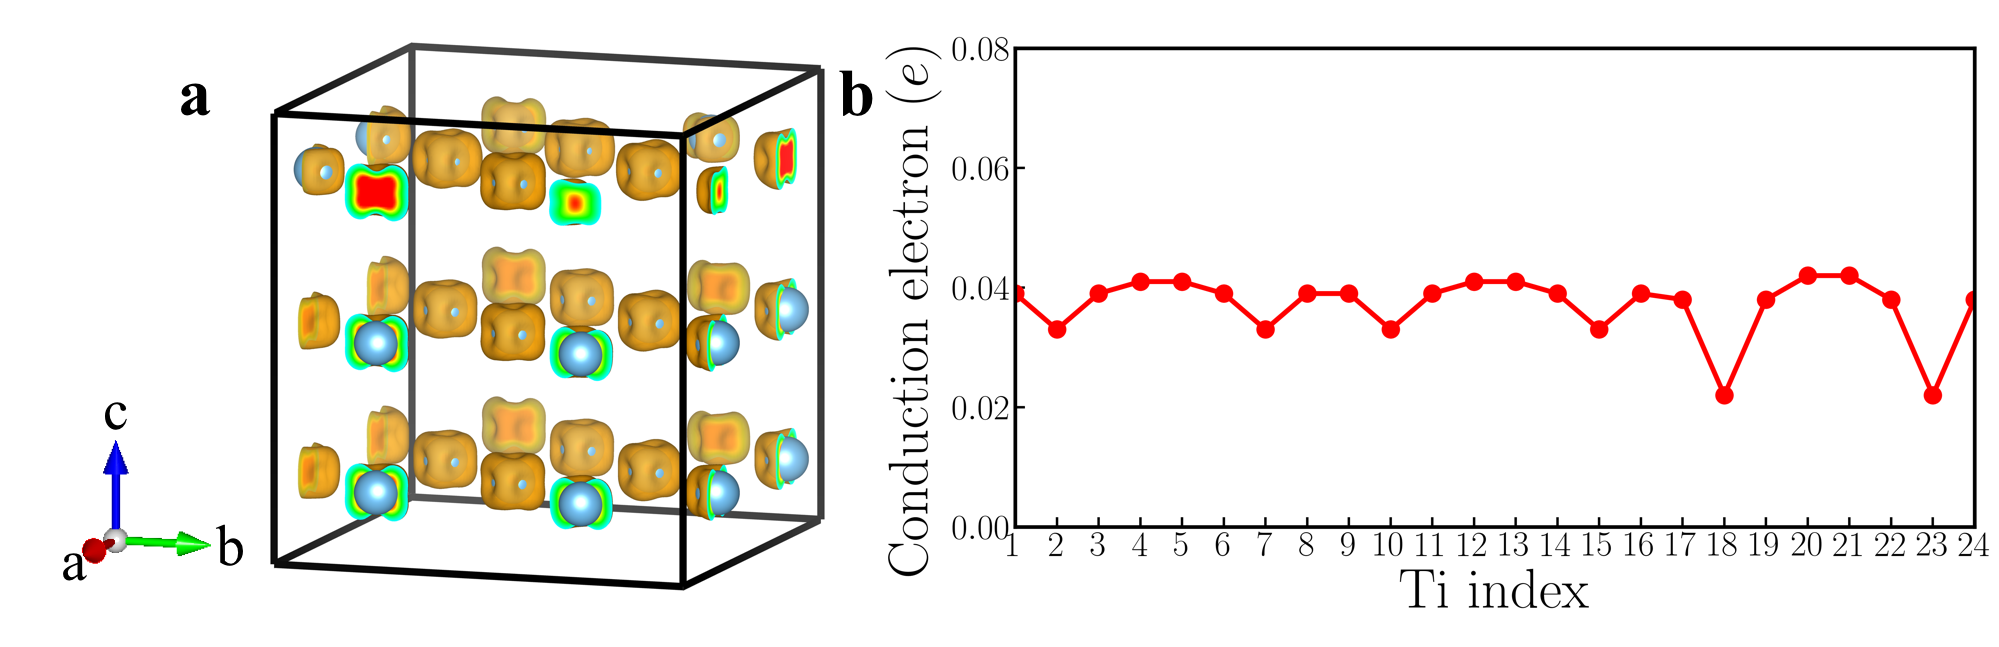 Figure 9
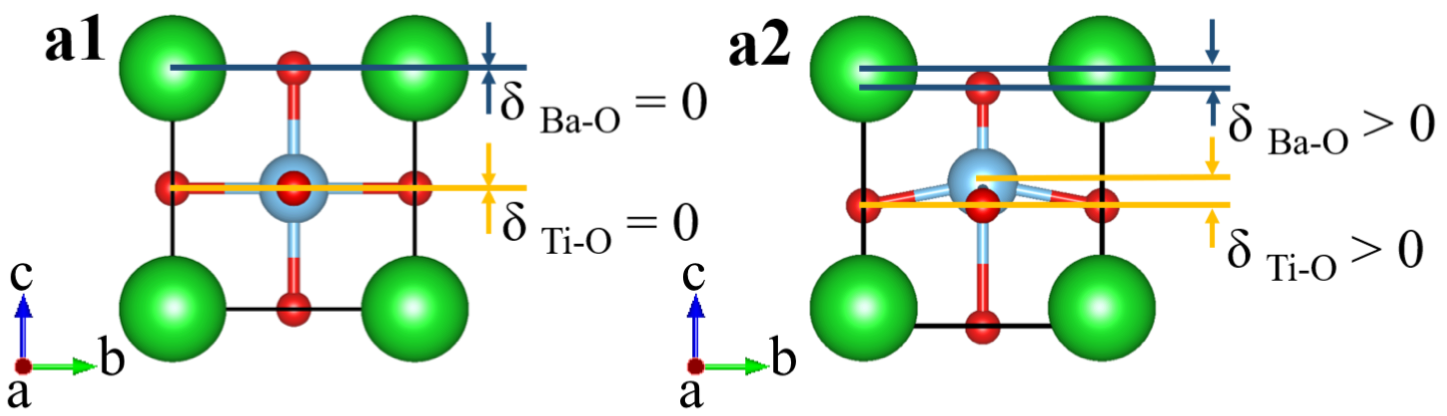 Figure 10
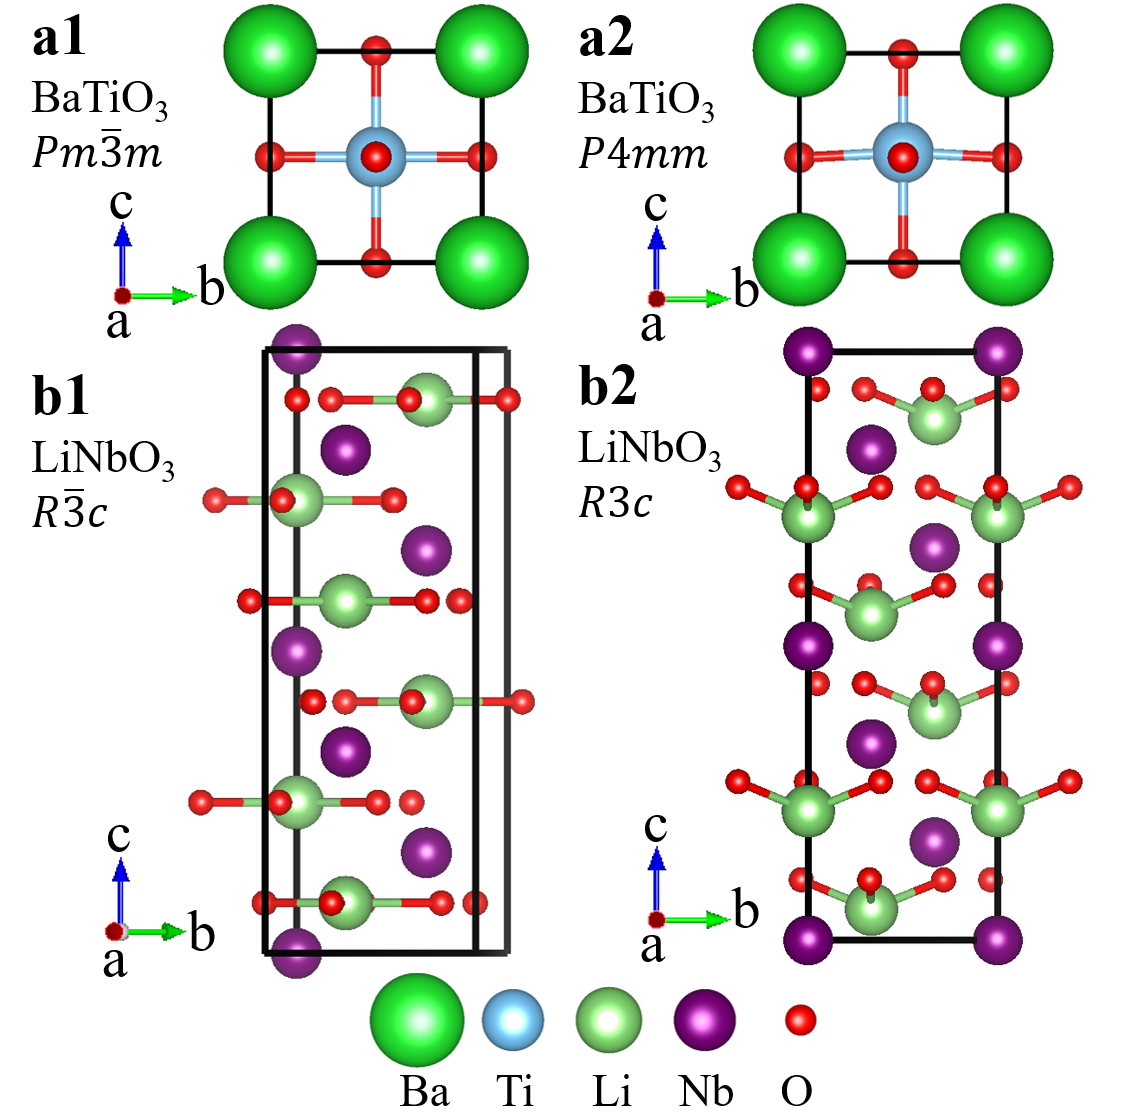 Figure 11
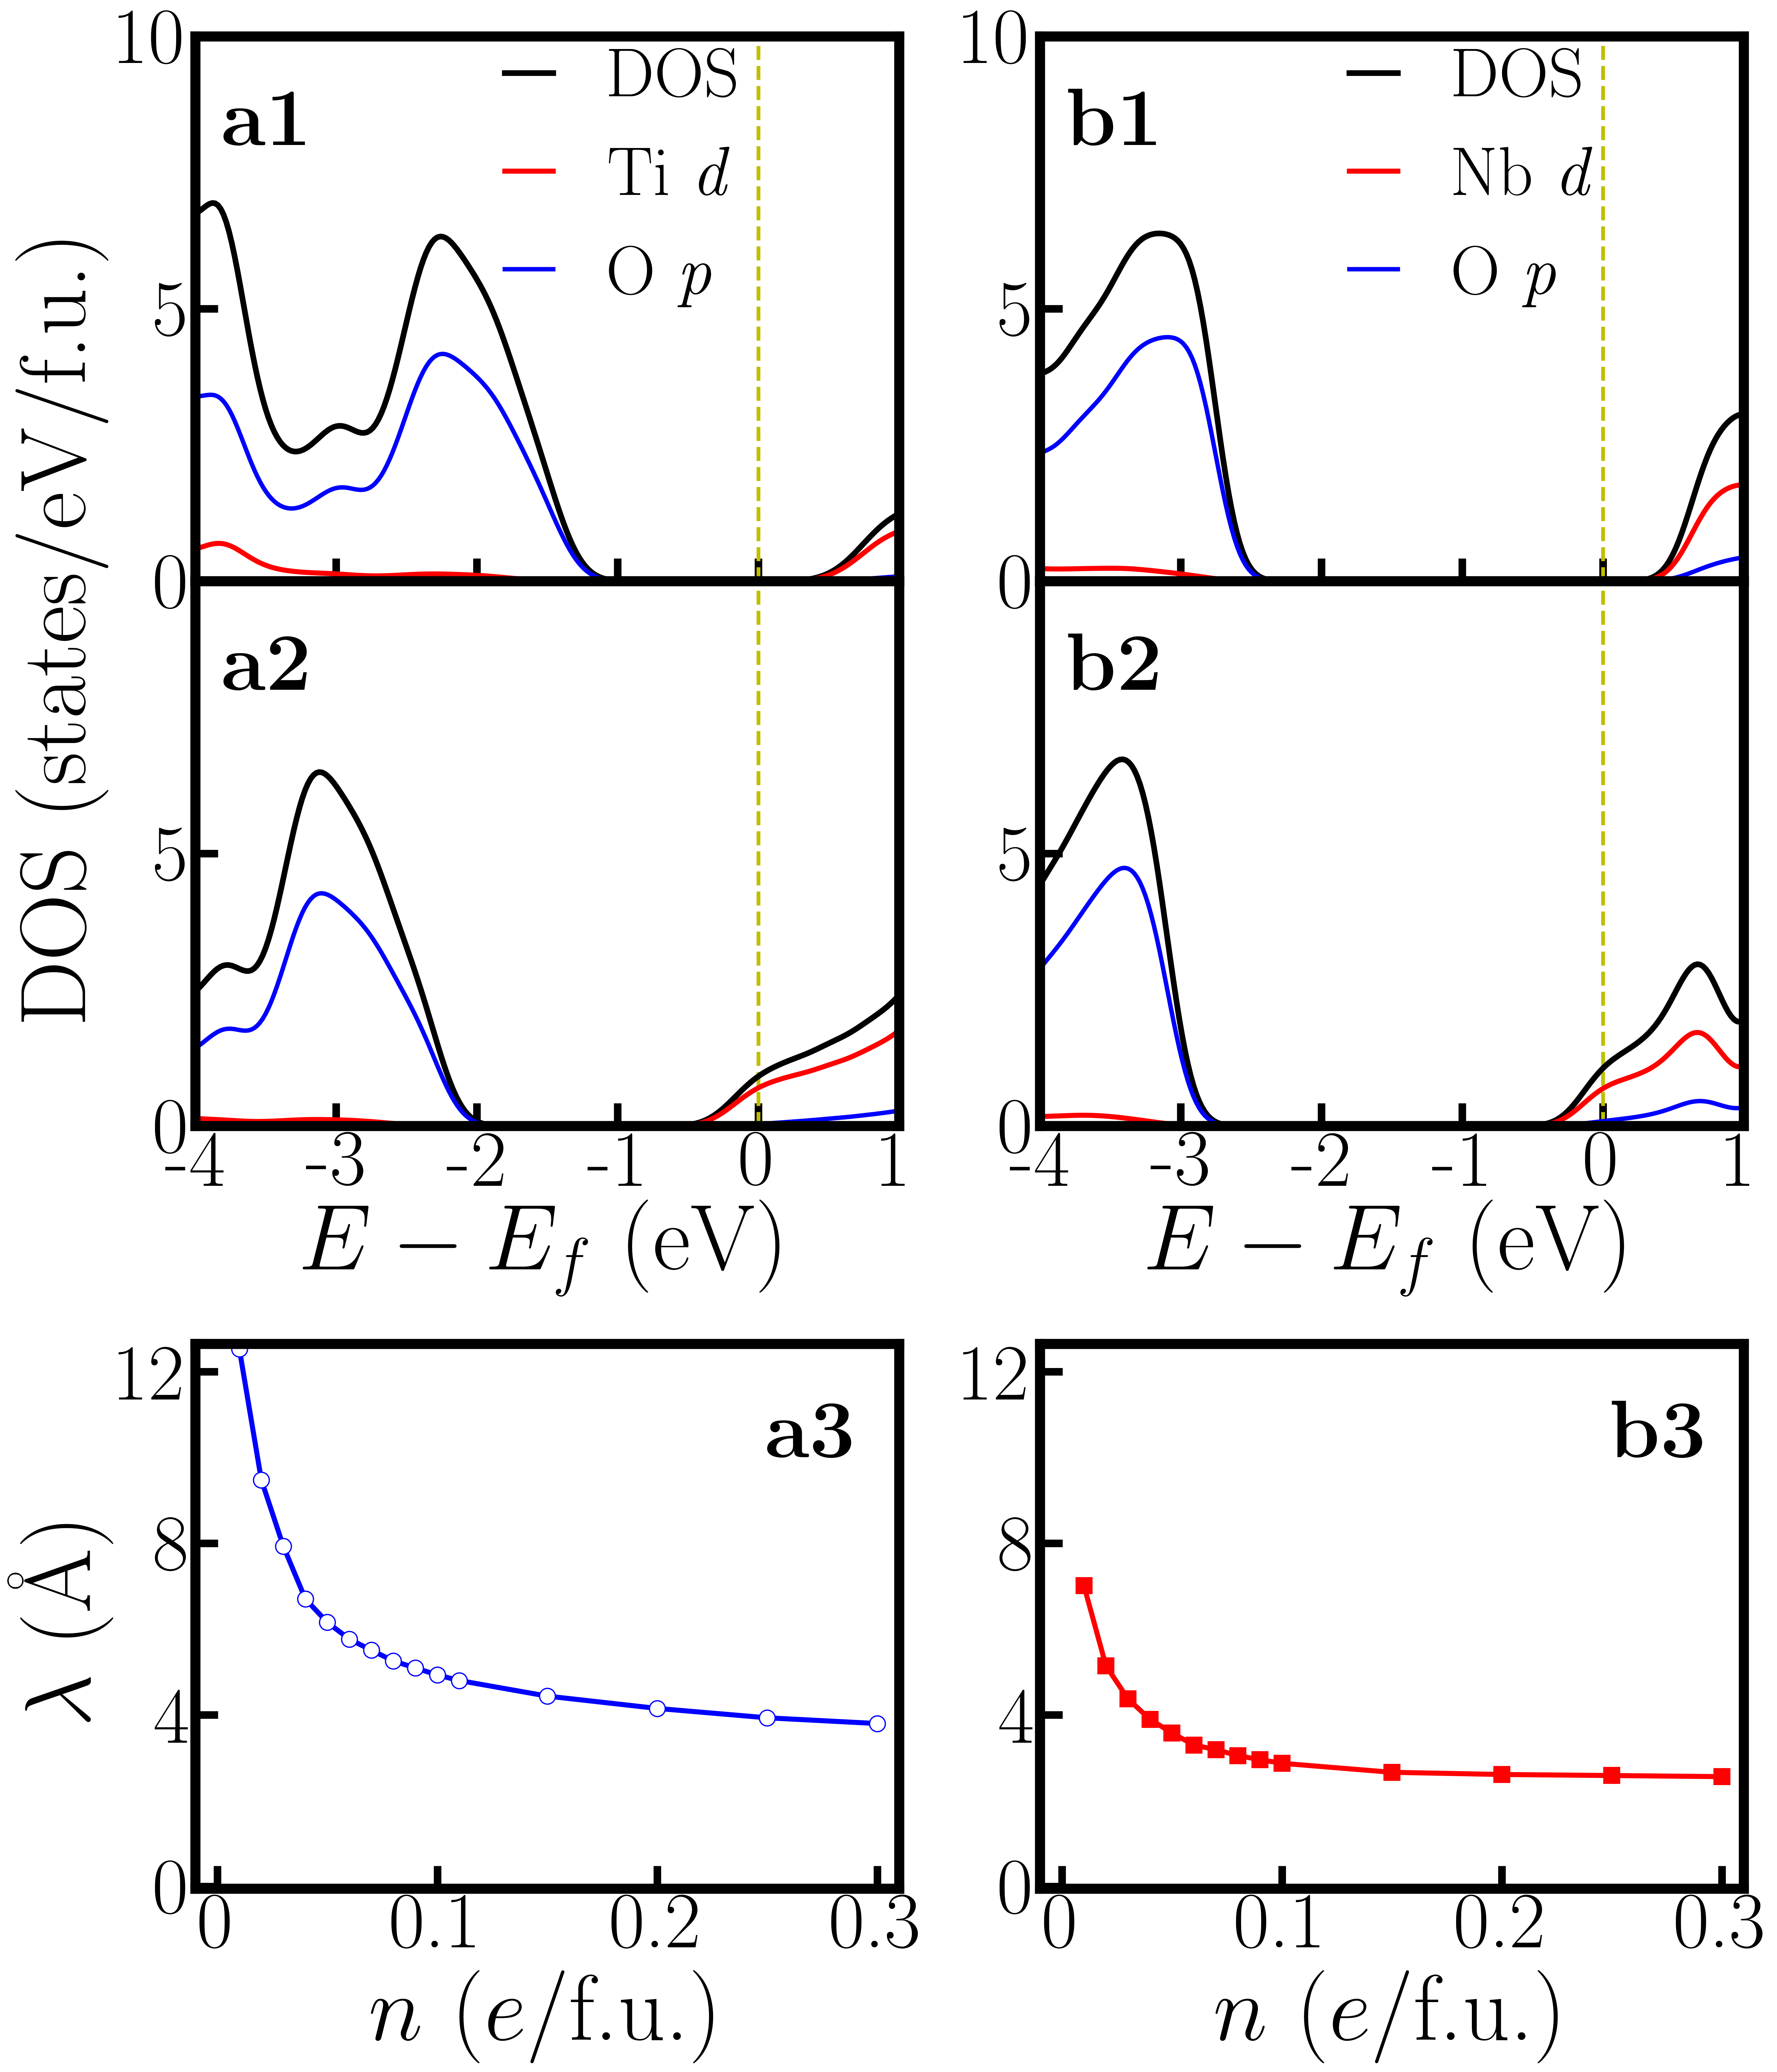 Figure 12
 Figure 13
 Figure 14
 Figure 15
 Figure 16
Peer Reviews
No public reviews on file for this paper yet. If you reviewed it on a platform where reviews are public (OpenReview, ICLR, NeurIPS, ICML), you can paste yours below so the community can read it here.
Videos
No videos yet. Explain this paper in a talk, walkthrough, or lecture? Add one.
Taxonomy
TopicsFerroelectric and Piezoelectric Materials · Photorefractive and Nonlinear Optics · Multiferroics and related materials
Coexistence of polar displacements and conduction in doped
ferroelectrics: an ab initio comparative study
Chengliang Xia1,2, Yue Chen1,∗ and Hanghui Chen2,3,
Correspondence to [email protected] or [email protected].
1Department of Mechanical Engineering, The University of Hong Kong, Pokfulam Road, Hong Kong SAR, China
2NYU-ECNU Institute of Physics, NYU Shanghai, Shanghai, 200062, China
3Department of Physics, New York University, New York 10003, USA
Abstract
Polar metals are rare because free carriers in metals screen electrostatic potential and eliminate internal dipoles. Degenerate doped ferroelectrics may create an approximate polar metallic phase. We use first-principles calculations to investigate -doped LiNbO3-type oxides (LiNbO3 as the prototype) and compare to widely studied perovskite oxides (BaTiO3 as the prototype). In the rigid-band approximation, substantial polar displacements in -doped LiNbO3 persist even at 0.3 /f.u. ( 1021 cm*-3*), while polar displacements in -doped BaTiO3 quickly get suppressed and completely vanish at 0.1 /f.u. Furthermore, in -doped LiNbO3, Li-O displacements decay more slowly than Nb-O displacements, while in -doped BaTiO3, Ba-O and Ti-O displacements decay approximately at the same rate. Supercell calculations that use oxygen vacancies as electron donors support the main results from the rigid-band approximation and provide more detailed charge distributions. Substantial cation displacements are observed throughout LiNbO3-δ(), while cation displacements in BaTiO3-δ() are almost completely suppressed. We find that conduction electrons in LiNbO3-δ are not as uniformly distributed as in BaTiO3-δ, implying that the rigid-band approximation should be used with caution in simulating electron doped LiNbO3-type oxides. Our work shows that polar distortions and conduction can coexist in a wide range of electron concentration in -doped LiNbO3, which is a practical approach to generating an approximate polar metallic phase. Combining doped ferroelectrics and doped semiconductors may create new functions for devices.
pacs:
Valid PACS appear here
I Introduction
Polar metals are materials that are characterized by the absence of inversion symmetry and the presence of intrinsic conduction due to partial band occupation Puggioni and Rondinelli (2014); Cao et al. (2018); Balachandran et al. (2017); Page et al. (2008); Bock et al. (2015). They are rare in solids because free carriers can screen electrostatic potential and eliminate internal dipoles that arise from asymmetric charge distributions McCarty and Whitesides (2008); Rabe et al. (2007); Mooradian and Wright (1966); Bowlan (2010); Hill (2000). Anderson and Blount predicted in 1965 that polar metals can exist Anderson and Blount (1965), and the recent experimental confirmation of LiOsO3 as the first polar metal has stimulated intensive theoretical and experimental research Shi et al. (2013); Xiang (2014); Giovannetti and Capone (2014); Liu et al. (2015); Aulesti et al. (2018); Vecchio et al. (2016); Sim and Kim (2014); Padmanabhan et al. (2018); Fei et al. (2018); Kim et al. (2016).
However, the above definition of a polar metal (absence of inversion symmetry and presence of conduction) excludes degenerately doped insulating ferroelectrics Kim et al. (2016). Electron doped perovskite ferroelectric compounds O3 (BaTiO3 as the prototype) have been widely studied both in theory and in experiment Jeong et al. (2011); Hwang et al. (2010); Kolodiazhnyi et al. (2010); Kolodiazhnyi (2008); Wang et al. (2012); Raghavan et al. (2016); Won et al. (2011). First-principles calculations show that cation displacements and conduction can coexist in -doped BaTiO3 up to a critical concentration of per formula Wang et al. (2012). This indicates that even with long-range Coulomb interaction screened by free electrons Bohm and Pines (1953); Cochran (1960); Galitski and Sarma (2004), a short-range portion of Coulomb force with an interaction range of the order of the lattice constant is sufficient to induce ferroelectric instability in BaTiO3 Wang et al. (2012); Zhang et al. (2006); Cohen (1992). Experimentally, there are contradictory results: Ref. Hwang et al. (2010); Kolodiazhnyi et al. (2010) show that in oxygen-reduced BaTiO3-δ, polar displacements can co-exist with conduction and do not vanish until a critical concentration of cm*-3*, which is consistent with first-principles calculations Wang et al. (2012). However, a neutron diffraction study on -doped BaTiO3 found phase separation in which ferroelectric displacements only exist in an insulating region, which is spatially separated by nonpolar metallic regions Jeong et al. (2011). On the other hand, while electron-doped LiNbO3-type ferroelectric oxides (LiNbO3 as the prototype) have been investigated in the literature, the focus has been on electronic structure and the optical property Furukawa et al. (2001); Nataf et al. (2016); Nakamura et al. (2002); Noguchi et al. (2016). The structural property and the possible co-existence of polar displacements with conduction have received little attention.
In this work, we use first-principles calculations to do a comparative study on doping effects in insulating ferroelectrics. We compare the aforementioned two important classes of ferroelectrics: one is perovskite oxides (BaTiO3 as the prototype) and the other is LiNbO3-type oxides (LiNbO3 as the prototype). We find different behaviors in these two materials upon electron doping. In the rigid-band approximation, cation displacements in -doped BaTiO3 quickly get suppressed and completely disappear at a critical doping of 0.1 /f.u., while substantial cation displacements are found in -doped LiNbO3 up to an electron concentration of 0.3 /f.u.. Moreover, Li-O displacements decay more slowly than Nb-O displacements. With an electron doping of 0.3 /f.u., Nb-O displacements are reduced by about 50% from the undoped value, while Li-O displacements are reduced by only about 10%. This is different from -doped BaTiO3 in which both Ba-O and Ti-O displacements decay approximately at the same rate. This indicates that Li-O displacements are more persistent than Nb-O displacements in a metallic environment. Supercell calculations that use oxygen vacancy as electron donors support the main results from the rigid-band approximation and provide more detailed charge distributions. We find that in -doped LiNbO3, conduction electrons are not as uniformly distributed as in -doped BaTiO3, but substantial cation displacements are found throughout -doped LiNbO3. Using supercell calculations, we also compute the formation energy of oxygen vacancies. The formation energy of oxygen vacancies in -doped LiNbO3 is about 1 eV higher than that in -doped BaTiO3, which is reasonable considering the fact that the band gap of LiNbO3 is about 1 eV larger than that of BaTiO3.
The paper is organized as follows. In Section II we provide computation details. We present the main results (rigid-band calculations and supercell calculations) in Section III. We conclude in Section IV.
II Computational details
We perform density functional (DFT) calculations Hohenberg and Kohn (1964); Kohn and Sham (1965), as implemented in the Vienna Ab-initio Simulation Package (VASP) Payne et al. (1992); Kresse and Furthmüller (1996). We employ a local density approximation (LDA) pseudopotential Ceperley and Alder (1980). We also test our key results using a revised Perdew-Burke-Ernzerhof generalized gradient approximation (PBEsol) Perdew (2008). The key results do not qualitatively change with different exchange correlation functionals. We set an energy cutoff of 600 eV. Charge self-consistent calculations are converged to 10*-5* eV. Both cell and internal coordinates are fully relaxed until each force component is smaller than 10 meV/Å and the stress tensor is smaller than 1 kbar.
For pristine bulk calculations, we use a tetragonal cell (5-atom) to study BaTiO3 and find that = 3.95 Å and = 1.01; we use a hexagonal cell (30-atom) to study LiNbO3 and find that = 5.09 Å and = 13.81 Å. Both of them are in good agreement with previous studies Zhang et al. (2017).
To simulate doping effects, we use both the rigid-band approximation and supercell calculations. In rigid-band modeling, we study a 5-atom cell BaTiO3 (tetragonal and cubic ) and a 30-atom cell LiNbO3 (non-centrosymmetric and centrosymmetric ). We use a Monkhorst-Pack -point sampling of for BaTiO3 and for LiNbO3. In supercell calculations, we use a 119-atom cell for both BaTiO3 and LiNbO3 (oxygen vacancy concentration of 4.2%/f.u. and nominally electron doping of 0.084 /f.u.). The supercells for BaTiO3 and LiNbO3 are shown in Fig. 4 and Fig. 5. We use a Monkhorst-Pack -point sampling of in supercell calculations.
In our supercell calculations, we remove one (charge neutral) oxygen atom in LiNbO3 supercells of different sizes to simulate different oxygen vacancy concentrations. The supercell with oxygen vacancies is charge-neutral, and we fully relax the structure (both lattice constants and internal coordinates) to get the ground state property.
We check a higher energy cutoff (750 eV) and a denser -point sampling, and we do not find any significant changes in the key results.
III Results and discussion
III.1 Rigid-band calculations
In the rigid-band approximation, materials are pristine and extra electrons are added to the system with the same amount of uniform positive charges in the background. Fig. 1 shows the crystal structures of pristine BaTiO3 and LiNbO3, which are used in rigid-band modeling. Panels a1 and a2 show the crystal structure of cubic BaTiO3 (space group ) and tetragonal BaTiO3 (space group ). Insulating ferroelectrics have a spontaneous polarization Abrahams et al. (1968). However, in doped ferroelectrics, partially filled bands may lead to conduction and polarization becomes ill-defined Wang et al. (2010); Stengel et al. (2011); Fujioka et al. (2015). Therefore, we use cation displacements to characterize the extent of being “polar”. In -doped BaTiO3, we calculate both Ba-O and Ti-O cation displacements along the -axis, denoted by and , as a function of electron concentration. and are explicitly shown in Fig. S1 in the Supplementary Materials. Panels b1 and b2 show the crystal structure of centrosymmetric LiNbO3 (space group ) and non-centrosymmetric LiNbO3 (space group ). We calculate both Li-O and Nb-O displacements and . In the centrosymmetric structure , each Li atom is surrounded by three oxygen atoms and all these four atoms form a plane that is perpendicular to -axis. In the non-centrosymmetric structure , the three oxygen atoms still form a plane that is perpendicular to the -axis but Li atom deviates from that plane. The distance between Li atom and the plane that the three oxygen atoms form is defined as the Li-O displacement . In the centrosymmetric structure , each Nb atom is at the center of an NbO6 oxygen octahedron. In the non-centrosymmetric structure , Nb atoms move off the center of the NbO6 oxygen octahedron. The distance between the Nb position and the center of the oxygen octahedron in the structure is defined as . and are explicitly shown in Fig. S2 in the Supplementary Materials.
Fig. 2 summarizes the key results from rigid-band calculations. Panel a shows the cation displacements of tetragonal BaTiO3 (space group ) and non-centrosymmetric LiNbO3 (space group ). In the undoped case, Å and Å in BaTiO3, and Å and Å in LiNbO3, both of which are in good agreement with previous calculations and experiments Hellwege and Hellwege (1969); Prokhorov and Kuz’Minov (1990); Nahm and Park (2001); Rabe et al. (2007). Upon doping, all of the cation displacements decrease with increasing electron concentration. and in -doped BaTiO3 vanish at /f.u., which is consistent with previous calculations Wang et al. (2012). However, and in -doped LiNbO3 persist up to 0.3 /f.u.. Furthermore, in -doped BaTiO3, and decay at approximately the same rate. But in -doped LiNbO3, decays more slowly than . With 0.3 /f.u. electron doping, Nb-O displacements are reduced by about 50% from the undoped value, while Li-O displacements are reduced by only about 10%. This indicates that the off-center movements of Li atoms are very robust and more persistent than Nb-O displacements in a metallic environment. This helps to create an approximate polar metallic phase when LiNbO3 is electron doped.
Panel b of Fig. 2 shows the energy difference between the centrosymmetric structure and the non-centrosymmetric structure of BaTiO3 and LiNbO3. Specifically, for BaTiO3 and for LiNbO3 . indicates that the non-centrosymmetric structure is favored. In the undoped case, the non-centrosymmetric structure is favored in both BaTiO3 and LiNbO3, i.e. they are both ferroelectric. Upon doping, BaTiO3 is polar till /f.u., consistent with the critical concentration found for and . For -doped LiNbO3, quickly decreases but it stays positive (up to 0.3 /f.u.). This is consistent with and , which do not vanish with electron doping (up to 0.3 /f.u.).
Panel c of Fig. 2 shows the zone-center phonon frequency of the ferroelectric mode for centrosymmetric BaTiO3 (space group ) and LiNbO3 (space group ). For cubic BaTiO3, the ferroelectric mode has imaginary phonon frequency with small electron doping, indicating ferroelectric instability. Around the critical doping of /f.u. the phonon frequency of the ferroelectric mode becomes positive and the cubic structure is stabilized. For centrosymmetric LiNbO3, the ferroelectric mode always has imaginary phonon frequency (up to 0.3 /f.u.), indicating that ferroelectric instability persists in -doped LiNbO3. For both materials, the phonon property of the centrosymmetric structures is consistent with the results of the non-centrosymmetric structures shown in panels a and b. We note that the magnitude of the imaginary phonon mode indicates how unstable the high-symmetry structure is subject to a collective atomic distortion. However, the energy difference between the distorted and undistorted crystal structures reflects not only the instability of the high-symmetry structure, but also other factors. From our calculations, we find that for BaTiO3, the volume of its undistorted structure is 0.5% smaller than that of the distorted structure; in contrast, for LiNbO3, the volume of its undistorted structure is 1.5% larger than that of the distorted structure. The elastic energy change from the high-symmetry structure to the low-symmetry structure is very different between BaTiO3 and LiNbO3. This information is embodied in the total energy difference but is not directly reflected in the imaginary phonon modes.
We also use the PBEsol functional to check the key results in Fig. 2, and we do not find significant changes (see Fig. S4 in the Supplementary Materials). Our finding that polar displacements of LiNbO3 are persistent in the presence of conduction electrons is related to the fact that LiNbO3 is hyperferroelectric Garrity et al. (2014); Li et al. (2016), i.e. a ferroelectric material whose polarization does not get suppressed by depolarization fields. This implies that doping a hyperferroelectric material is a viable approach to generating an approximate polar metallic phase.
Next, we study the electronic structure and screening length obtained from rigid-band calculations. Panels a1 and a2 of Fig. 3 show the density of states of undoped and doped BaTiO3 (with 0.2 /f.u. doping). With electron doping, the Fermi level is shifted from the band gap into Ti- states. Panels b1 and b2 of Fig. 3 show the density of states of undoped and doped LiNbO3 (with 0.2 /f.u. doping). Similarly, with electron doping, the Fermi level is shifted from the band gap into Nb- states. With the density of states of -doped BaTiO3 and -doped LiNbO3, we can estimate the screening length by using the Thomas-Fermi model Wang et al. (2012):
[TABLE]
where is the dielectric constant of undoped materials and is density of states at Fermi level. For dielectric constants, we use experimental values for BaTiO3 Rupprecht and Bell (1964) and for LiNbO3 Mansingh and Dhar (1985). Panels c of Fig. 3 show the screening length of -doped BaTiO3 and -doped LiNbO3. We find that for both materials upon electron doping, the screening length is on the order of a few Å. Given an electron concentration, -doped LiNbO3 even has a screening length slightly smaller than -doped BaTiO3, implying a stronger screening property. The stronger screening property of electron doped LiNbO3 is due to the fact that undoped LiNbO3 has a smaller dielectric constant than that of BaTiO3, while the density of states at the Fermi level plays a minor role (the ratio of to ranges from 0.9 to 1.1 as changes from 0 to 0.3 /f.u.).
III.2 Supercell calculations
Our rigid-band calculations show that polar displacements and conduction can coexist in both -doped BaTiO3 and -doped LiNbO3, but the overall polar property (magnitude of polar displacements, polar instability, etc.) is much more enhanced in -doped LiNbO3 than in -doped BaTiO3. However, rigid-band calculations do not specify the origin of electron doping and also they imply that all carriers are uniformly distributed. In real experiments, oxygen vacancies are commonly seen in complex oxides, and each oxygen vacancy nominally donates two electrons. However, an isolated oxygen vacancy may form a defect state, which can localize conduction electrons Magyari-Köpe et al. (2012); Lin et al. (2015). Some experiments shows that in oxygen-reduced BaTiO3-δ, phase separation occurs. Cation displacements only occur in the insulating region and vanish in the metallic region. The overall sample may be considered as a mixture of two different phases Jeong et al. (2011). To test whether the results from the rigid-band calculations remain valid in real materials, we perform supercell calculations and consider charge neutral oxygen vacancies as the electron doping source. We use a 119-atom cell of BaTiO3-δ and LiNbO3-δ. In both cases, the oxygen vacancy concentration is 4.2%/f.u.. A charge neutral oxygen vacancy donates two electrons to the system, therefore it is an electron doping of 0.084 /f.u. ( cm*-3*), close to the critical doping in -doped BaTiO3 obtained from rigid-band calculations.
Fig. 4a1 shows the crystal structure of a 119-atom BaTiO3-δ supercell that contains one oxygen vacancy. For clarity, Ba atoms are not explicitly shown and the oxygen vacancy is highlighted by the orange open circle. Fig. 4a2 shows the cation displacement for each Ti atom in the BaTiO3-δ supercell (the definition of is identical to that in the rigid-band calculations). Displacements along -axis of each Ba atom are explicitly shown in Fig. S3 in the Supplementary Materials. We find that while there is some small variation in due to an inhomogeneous chemical environment, on average is reduced to zero. For comparison, we also show the in pristine BaTiO3 in panel a2 and the suppression of polar displacements by electron doping is evident. Fig. 4a3 shows an iso-value surface of conduction electron density in oxygen-reduced BaTiO3-δ with . Conduction electrons reside on Ti atoms. Because the polar displacements are suppressed and the material is close to a cubic structure, conduction electrons occupy three Ti orbitals with approximately equal occupancy. This leads to an iso-value surface of a dice-like shape. Fig. 4a4 shows the number of conduction electrons on each Ti atom by integrating the Ti- states from the band gap to the Fermi level. We find that in the presence of oxygen vacancy, while there is non-negligible variation in conduction electron distribution, insulating-metallic phase separation does not occur in our first-principles calculations. Each Ti atom in the supercell has a sizable amount of conduction electron. The results of oxygen-reduced BaTiO3-δ from supercell calculations are very consistent with rigid-band calculations. We also use the LDA+ method and change the supercell size to test the robustness of this conclusion (see the Supplementary Materials for details). We find that in oxygen-reduced BaTiO3-δ, conduction electrons on each Ti atom are almost uniformly distributed.
However, supercell calculations of oxygen-reduced LiNbO3-δ show more complicated results than rigid-band calculations. Fig. 5a1 shows the crystal structure of a 119-atom LiNbO3 supercell that contains one oxygen vacancy. The oxygen vacancy is highlighted by the orange open circle. Fig. 5a2 shows for each Li atom and for each Nb atom in the LiNbO3-δ supercell (the definitions of and are identical to those in the rigid-band calculations). We find that while there is non-negligible variation in and , the cation displacements on each Li and Nb atoms are non-zero throughout the supercell. For comparison, we also show the and in pristine LiNbO3 in panel a2. We find that in the presence of oxygen vacancy in LiNbO3-δ, the cation displacements are still substantial, compared to undoped LiNbO3.
The average value of is 0.68 Å and the average value of is 0.24 Å, both of which are close to the results of rigid-band calculations with the same electron concentration (in the rigid-band approximation, is 0.69 Å and is 0.21 Å). Fig. 5a3 shows an iso-value surface of conduction electron distribution in oxygen-reduced LiNbO3-δ with . Different from oxygen-reduced BaTiO3-δ which has almost uniform conduction electron distribution, some of Nb atoms have negligible conduction electrons, indicating that those Nb sites are almost insulating. This phenomenon can be more clearly seen from Fig. 5a4, which shows the number of conduction electrons on each Nb site by integrating Nb- states from the band gap to the Fermi level. Nb #3, #9 and #20 have less than 0.01 per atom, while Nb #7 and #17 have more than 0.12 per atom. With electron doping in LiNbO3, the conduction electrons on Nb sites are far from uniformly distributed. This implies that the charge disproportionation of conduction electrons on Nb atoms occurs in real materials. Such charge disproportion can be suppressed with a higher electron concentration. We calculated oxygen-reduced LiNbO3-δ with . Cation displacements and conduction electron distribution on Nb- states are shown in Fig. S9 in the Supplementary Materials. While there is non-negligible variation in the electron distribution, all Nb atoms have conduction electrons with a higher concentration of oxygen vacancies, as expected.
Finally we estimate the formation energy of a charge-neutral oxygen vacancy in BaTiO3-δ and in LiNbO3-δ using a supercell calculation. We study a charge neutral oxygen vacancy by removing an oxygen atom from a charge neutral supercell. The definition of formation energy of a charge-neutral oxygen vacancy in the oxygen rich limit is:
[TABLE]
where is the total energy of a supercell with one oxygen vacancy, and is the total energy of a pristine supercell. is the total energy of an oxygen molecule (obtained in a spin-polarized calculation).
Fig. 6 shows the oxygen vacancy formation energy in oxygen-reduced BaTiO3-δ and oxygen-reduced LiNbO3-δ as a function of oxygen vacancy concentration. Red points and blue triangles are the formation energies of oxygen vacancy in BaTiO3-δ and LiNbO3-δ, respectively. The blue cross is a reference value from previous works Choi et al. (2011).
We use different supercells to test different concentrations of oxygen vacancies. The formation energy of an oxygen vacancy does not have a strong dependence on vacancy concentration, implying that the vacancy concentration is low enough such that vacancy-vacancy interaction is negligible. The formation energy of a charge neutral oxygen vacancy in LiNbO3-δ is larger than that in BaTiO3-δ by about 0.9 eV per vacancy. This is reasonable considering the fact that the gap of LiNbO3 is larger than that of BaTiO3 by about 1 eV (see Fig. 3). While the formation energy of oxygen vacancy in LiNbO3-δ is higher, oxygen vacancy has been widely observed in LiNbO3-δ in experiments Li et al. (2015); DeLeo et al. (1988); Smyth (1983); Sweeney and Halliburton (1983).
IV Conclusion
In conclusion, we perform first-principles calculations to study the possible co-existence of conduction electrons and polar distortions in -doped BaTiO3 and -doped LiNbO3, using both rigid-band modeling and more realistic supercell calculations. From rigid-band modeling, we find that upon electron doping, cation displacements in BaTiO3 are quickly reduced and completely vanish at a critical electron concentration of 0.1 /f.u.. In contrast, in -doped LiNbO3, Li-O and Nb-O displacements are significantly larger than cation displacements in -doped BaTiO3, and more importantly they are much more robust and can persist even at a concentration of 0.3 /f.u.. In -doped LiNbO3, Li-O displacements decay more slowly than Nb-O displacements, while in -doped BaTiO3, Ba-O and Ti-O displacements decay approximately at the same rate. From supercell calculations (using oxygen vacancy as electron donors), we find that in BaTiO3-δ with , cation displacements in BaTiO3 are almost completely suppressed, which is consistent with the result of rigid-band modeling. Conduction electrons on Ti atoms are uniformly distributed, underlying rigid-band calculations. On the other hand, the results of oxygen-reduced LiNbO3-δ () from supercell calculations are more complicated than rigid-band calculations. Substantial polar displacements and occur throughout the supercell, but strong variations are found in conduction electron distribution. This implies that the rigid-band approximation should be used with caution in simulating electron doped LiNbO3 and related oxides.
Our work indicates that electron doping of LiNbO3-type ferroelectrics is a simple and feasible approach to approximately creating the rare polar metallic phase. Incorporating doped ferroelectric semiconductors (in particular LiNbO3-type ferroelectrics) into devices may lead to new functionality and applications.
Acknowledgements.
Hanghui Chen is supported by the National Natural Science Foundation of China under project number 11774236, Shanghai Pujiang Talents Program (Grant No. 17PJ1407300) and Seed grant of NYU-ECNU Research Institute of Physics. Yue Chen and Chengliang Xia are supported by Research Grants Council of Hong Kong under project numbers 17200017 and 17300018, and the National Natural Science Foundation of China under project number 11874313. NYU Shanghai HPC and HKU-ITS provide computational resources.
I Details of crystal structures
Fig. S1 shows the crystal structure of BaTiO3. Panel a1 shows zero Ba-O and Ti-O displacements in centrosymmetric BaTiO3 (space group ), and it is the reference state. Panel a2 shows non-zero Ba-O and Ti-O displacements in non-centrosymmetric BaTiO3 (space group ). Ti-O displacement is defined as:
[TABLE]
where is the position of the four nearest O atoms around a given Ti atom in plane. We note that in 119-atom cell, Ti#18 and Ti#23 that are closest to the oxygen vacancy have only three nearest O atoms.
Fig. S2 shows the crystal structure of LiNbO3. We show different bonding because we need different bondings to define and . To define , we need the tetrahedron formed by one Li atom and three O atoms. For , we need the octahedron with six oxygen atoms enclosing one Nb atom. Panels a1 and a3 show zero Li-O and Nb-O displacements in centrosymmetric LiNbO3 (space group ), and it is the reference state. Panels a2 and a4 show non-zero Li-O and Nb-O displacements in non-centrosymmetric LiNbO3 (space group ). Li-O displacement is defined as:
[TABLE]
where is position of the plane that is formed by the three nearest O atoms for a given Li atom. We note that in a 119-atom cell, Li#4 that is closest to the oxygen vacancy has only two nearest O atoms. Nb displacement is defined as:
[TABLE]
where is position of the six nearest O atoms around a given Nb atom. We note that in a 119-atom cell, Nb#12 and Nb#24 that are closest to the oxygen vacancy have only five nearest O atoms.
II Ba-O cation displacements in oxygen reduced
BaTiO3-δ
FIG. S3 shows the Ba displacements along the -axis in the 119-atom BaTiO3 supercell with an oxygen vacancy. It is noticed that there is no net average Ba displacement in electron-doped BaTiO3 from our supercell calculations. The polar displacements on Ba atoms #1 and #24 (#8 and #17 etc.) are of the same magnitude but opposite in direction. These are caused by the presence of the oxygen vacancy.
III Comparison of LDA and PBEsol calculations
We check our key results using PBEsol and find no significant changes. The comparison between LDA and PBEsol results is shown in FIG. S4. Ba-O and Ti-O displacements are completely suppressed upon 0.3/f.u. doping, while Li-O and Nb-O displacements are still significant at the same level of electron doping. At 0.3/f.u. doping, the centrosymmetric and non-centrosymmetric structures are essentially the same for BaTiO3 but are distinct for LiNbO3. Our results are robust against different exchange correlation.
IV Comparison of two type electrons in oxygen redueced
BaTiO3-δ and LiNbO3-δ
Fig. S5 compares two types of Ti- electrons in 119-atom BaTiO3 supercell with an oxygen vacancy. The upper panel shows the Ti- conduction electrons which are obtained by integrating the Ti- states from the band gap to the Fermi level. The lower panel shows the atomic Ti- electrons that are obtained by integrating charge density in a spherical region. Atomic Ti- electrons include both Ti- electrons in the conduction bands (which are above the band gap) and Ti- electrons in the valence bands (which are below the band gap). The Ti- electrons in the valence bands are due to strong hybridization between Ti- and O- states Marianetti et al. (2004). From Fig. S5, we find that indeed the two nearest-neighbor Ti atoms have the largest number of Ti- electrons. However, not all these electrons are in the conduction bands.
Fig. S6 compares two-types of Nb- electrons in 119-atom LiNbO3 supercell with an oxygen vacancy. Electron distribution in LiNbO3 is similar to that in BaTiO3. Nb #12 and Nb#24 have the most Nb- electrons (Fig. S6 b), but their conduction electrons are not necessarily the most (Fig. S6 a).
V Calculations of oxygen reduced BaTiO3-δ using LDA+ or larger supercell
We check oxygen reduced BaTiO3 using LDA+ method (with = 4 eV). The new results are shown in Fig. S7. Panel a shows the iso-value surface of Ti- conduction electrons on Ti sites and panel b shows the number of Ti- conduction electrons on each Ti atom in oxygen reduced BaTiO3-δ. From LDA+ calculations, we find Ti- conduction electrons are still homogeneously distributed.
We also test the cell size by calculating conduction electrons on each Ti atom in the 134-atom BaTiO3 supercell. The new result is shown in Fig. S8. Conduction electron distribution in Ti- states is homogeneous in a 134-atom BaTiO3 cell, similar to 119-atom cell calculation.
VI Calculations of oxygen redueced LiNbO3-δ with a higher doping concentration
FIG. S9a shows for each Li atom and for each Nb atom in oxygen reduced LiNbO3-δ with f.u. FIG. S9b shows the number of conduction electrons on each Nb atom in 59-atom LiNbO3 supercell. The number of conduction electrons on each Nb atom is obtained by integrating Nb-d states from band gap to the Fermi level. Li#4, Nb#6 and Nb#12 are closest to the oxygen vacancy in 59-atom LiNbO3 cell. The minimum conduction electron in 59-atom LiNbO3 is , which is much larger than that in 119-atom LiNbO3 supercell, only .
VII Oxygen reduced LiNbO3-δ with two oxygen vacancies
We introduce two oxygen vacancies into a 120-atom LiNbO3 supercell and study conduction electron distribution in these cells with different vacancy distances. These results are shown in FIG. S10. For all three separations, conduction electrons on Nb atoms are inhomogeneously distributed.
References
- Marianetti et al. (2004)
C. Marianetti, G. Kotliar, and G. Ceder, Physical Review Letters 92, 196405 (2004).
The reference list from the paper itself. Each links out to its DOI / PubMed record.
- 1Puggioni and Rondinelli (2014) D. Puggioni and J. M. Rondinelli, Nature Communications 5 , 3432 (2014).
- 2Cao et al. (2018) Y. Cao, Z. Wang, S. Y. Park, Y. Yuan, X. Liu, S. M. Nikitin, H. Akamatsu, M. Kareev, S. Middey, D. Meyers, et al., Nature Communications 9 , 1547 (2018).
- 3Balachandran et al. (2017) P. V. Balachandran, J. Young, T. Lookman, and J. M. Rondinelli, Nature Communications 8 , 14282 (2017).
- 4Page et al. (2008) K. Page, T. Kolodiazhnyi, T. Proffen, A. K. Cheetham, and R. Seshadri, Physical Review Letters 101 , 205502 (2008).
- 5Bock et al. (2015) J. A. Bock, S. Lee, S. Trolier-Mc Kinstry, and C. A. Randall, Applied Physics Letters 107 , 092902 (2015).
- 6Mc Carty and Whitesides (2008) L. S. Mc Carty and G. M. Whitesides, Angewandte Chemie International Edition 47 , 2188 (2008).
- 7Rabe et al. (2007) K. M. Rabe, C. H. Ahn, and J.-M. Triscone, Physics of ferroelectrics: a modern perspective , vol. 105 (Springer Science & Business Media, 2007).
- 8Mooradian and Wright (1966) A. Mooradian and G. Wright, Physical Review Letters 16 , 999 (1966).