Multinuclear Absolute MR Thermometry
Emilia Silletta, Alexej Jerschow, Guillaume Madelin, Leeor Alon

TL;DR
This paper introduces a novel multinuclear MRI thermometry method that accurately measures absolute temperature by leveraging the distinct frequency dependencies of proton and sodium nuclei, validated through experiments in solutions, gels, and tissues.
Contribution
The paper presents a new multinuclear approach for absolute MR thermometry, overcoming limitations of existing methods by using proton and sodium nuclei frequency differences.
Findings
Accurate temperature mapping achieved in solutions, gels, and tissues.
Excellent agreement with infrared temperature measurements.
Demonstrated feasibility of one-to-one frequency-temperature mapping.
Abstract
Non-invasive measurement of absolute temperature is important for proper characterization of various pathologies and for evaluation of thermal dose during interventional procedures. The proton magnetic resonance (MR) frequency shift method can be used to map relative temperature changes in tissues; however, spatiotemporal variations in the main magnetic field and the lack of an internal frequency reference at each location challenge the determination of absolute temperature. Here, we introduce a novel multinuclear method for absolute MR thermometry, based on the fact that the proton and sodium nuclei exhibit a unique and distinct characteristic frequency dependence with temperature. A one-to-one mapping between the precession frequency difference of the two nuclei and absolute temperature is demonstrated. Proof-of-concept experiments were conducted in aqueous solutions with different…
Click any figure to enlarge with its caption.
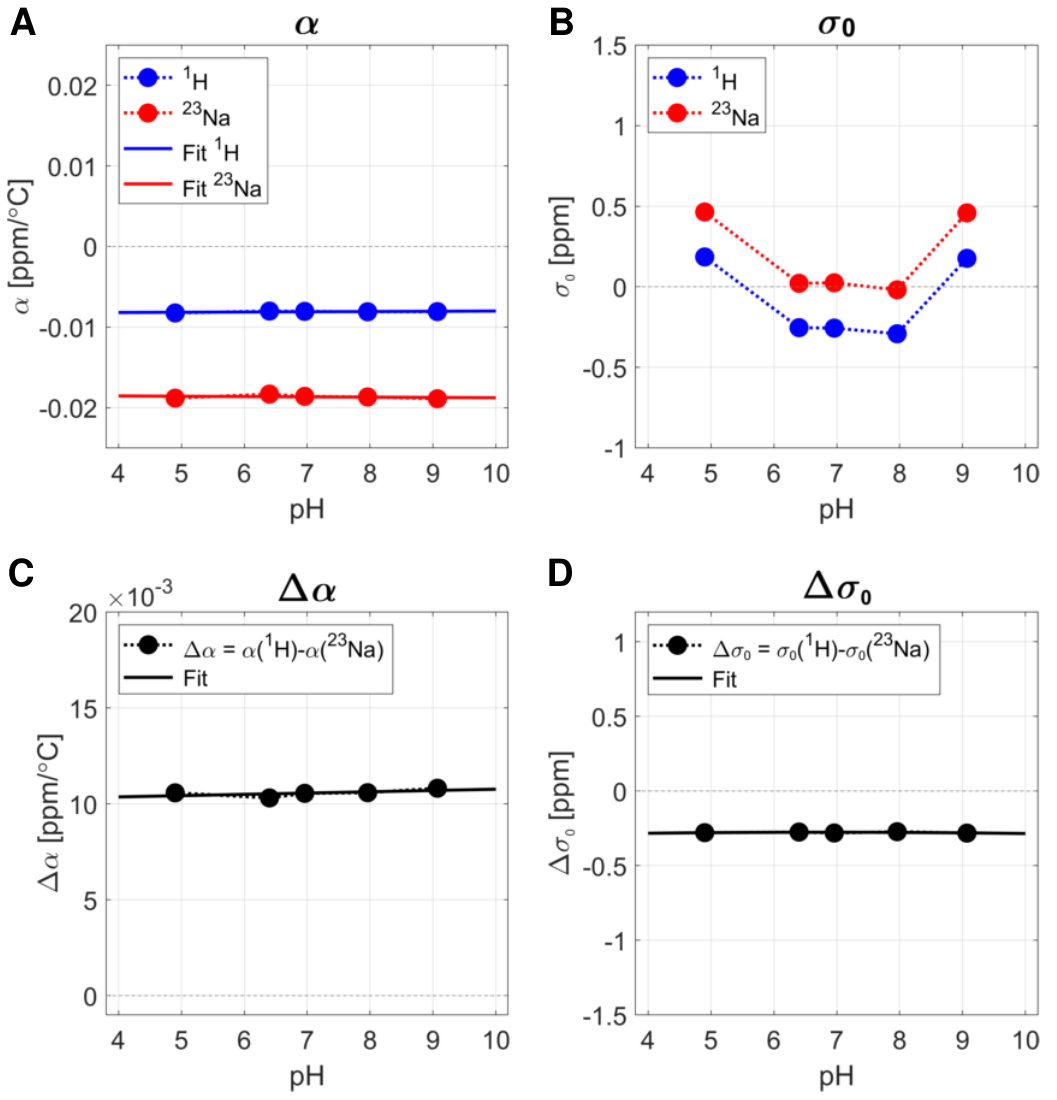 Figure 1
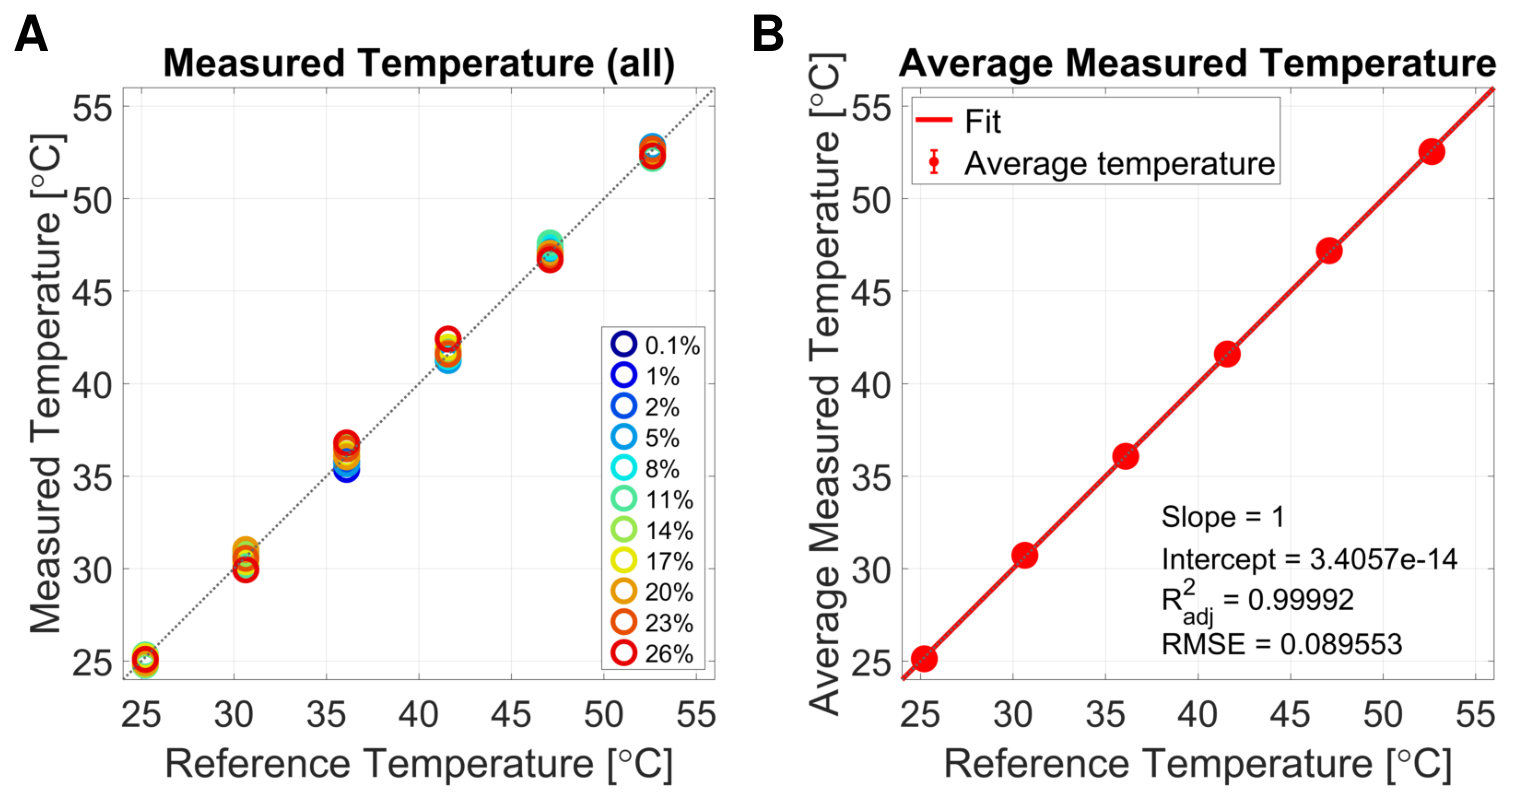 Figure 2
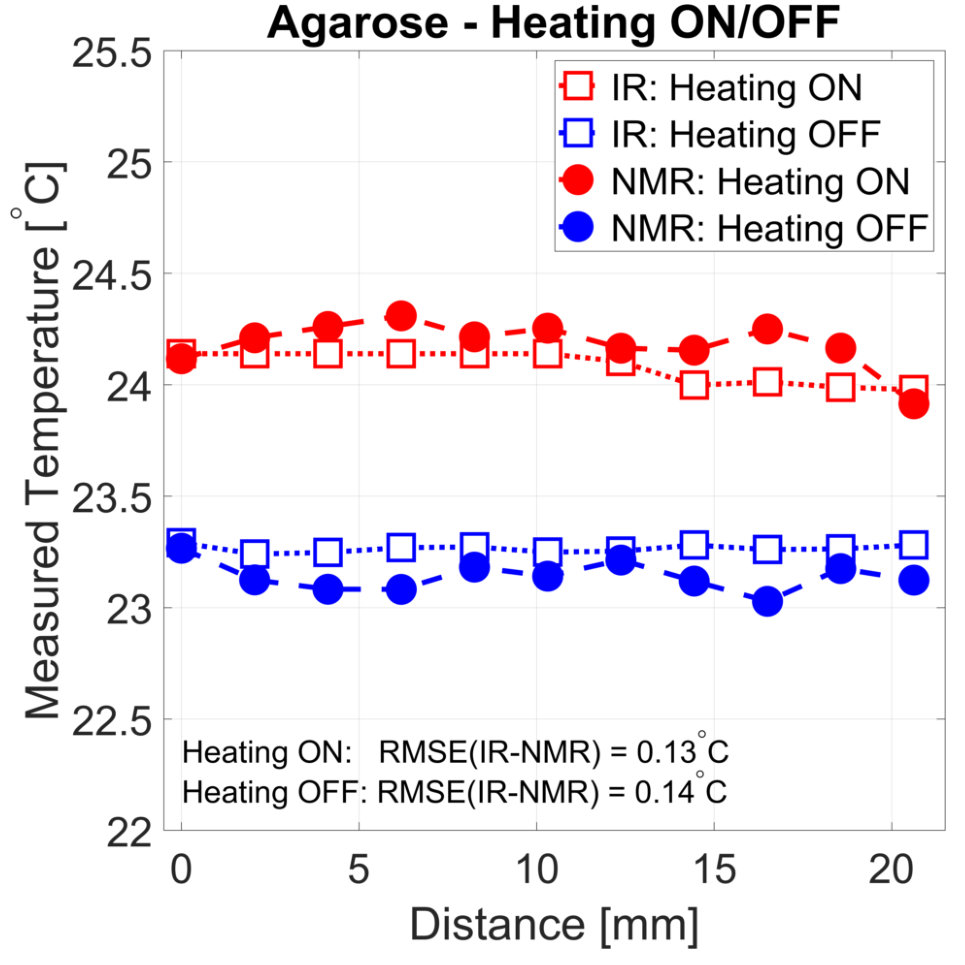 Figure 3
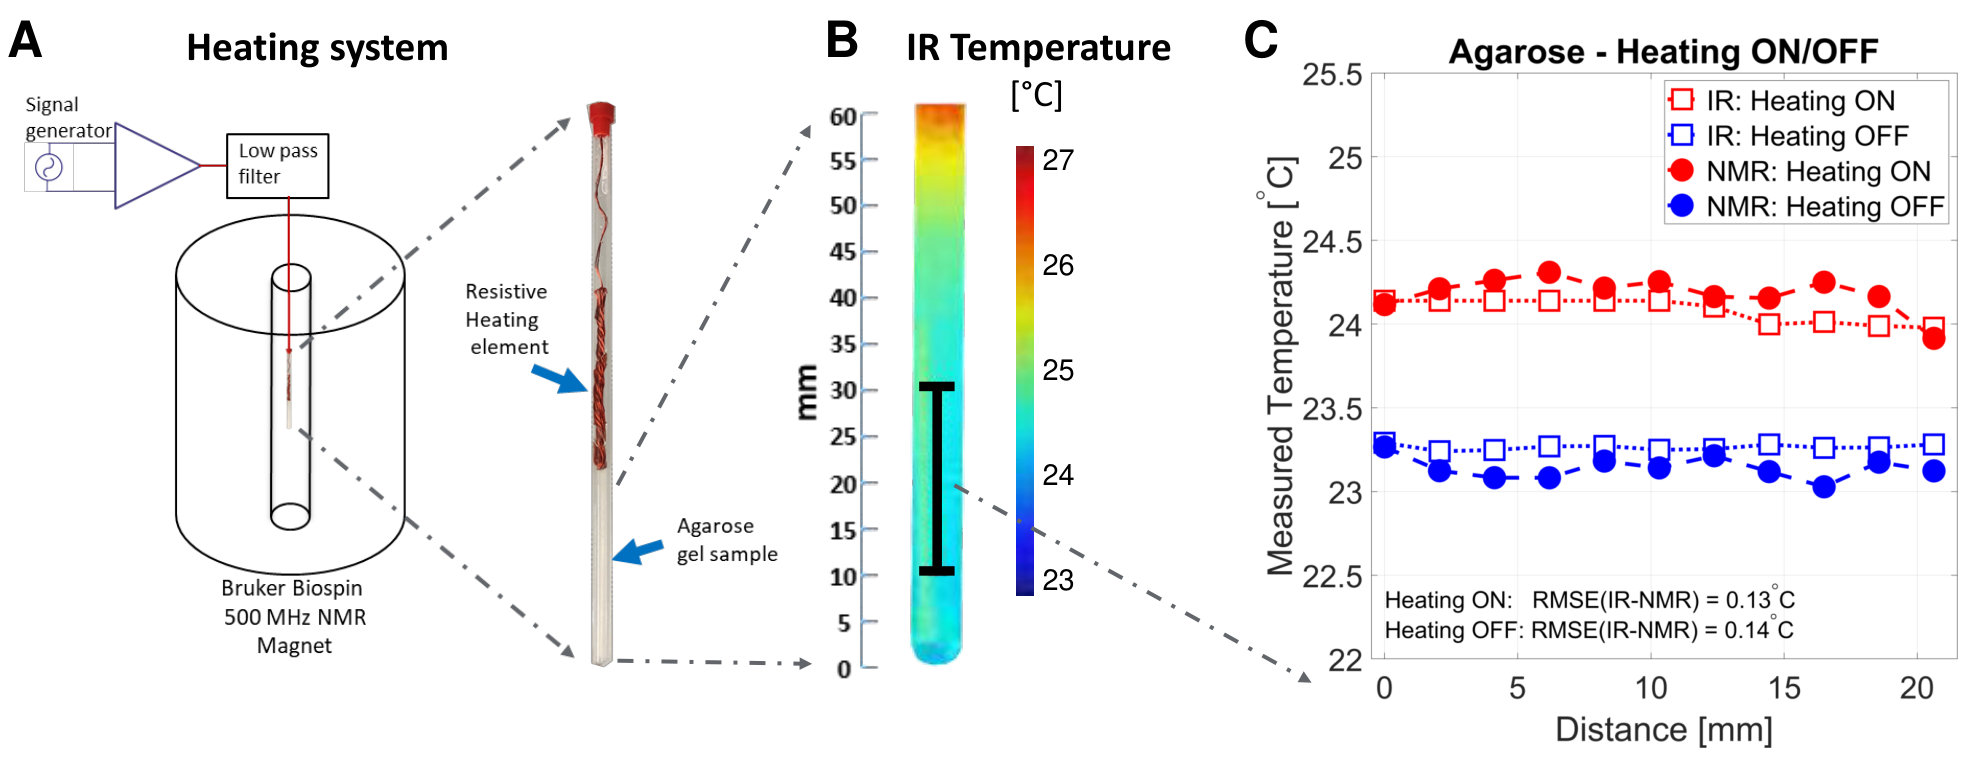 Figure 4
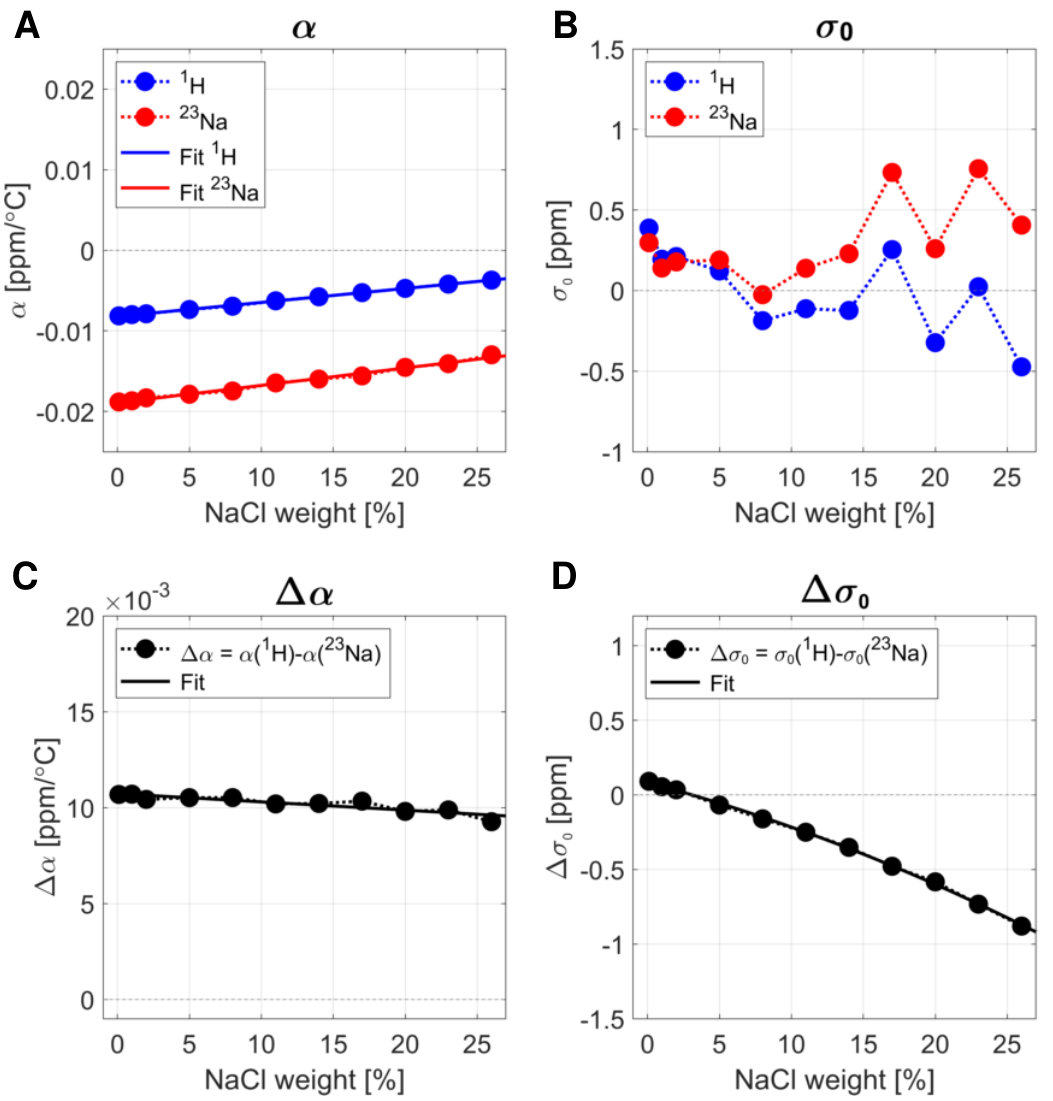 Figure 5
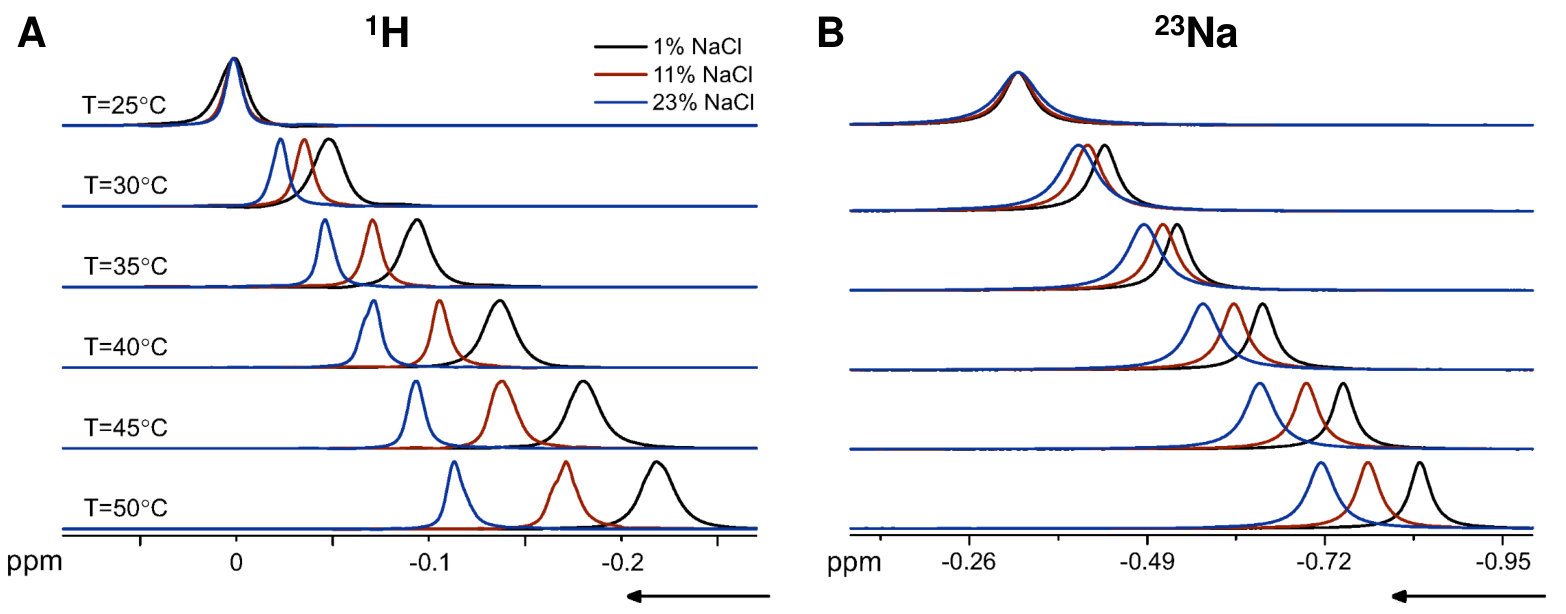 Figure 6
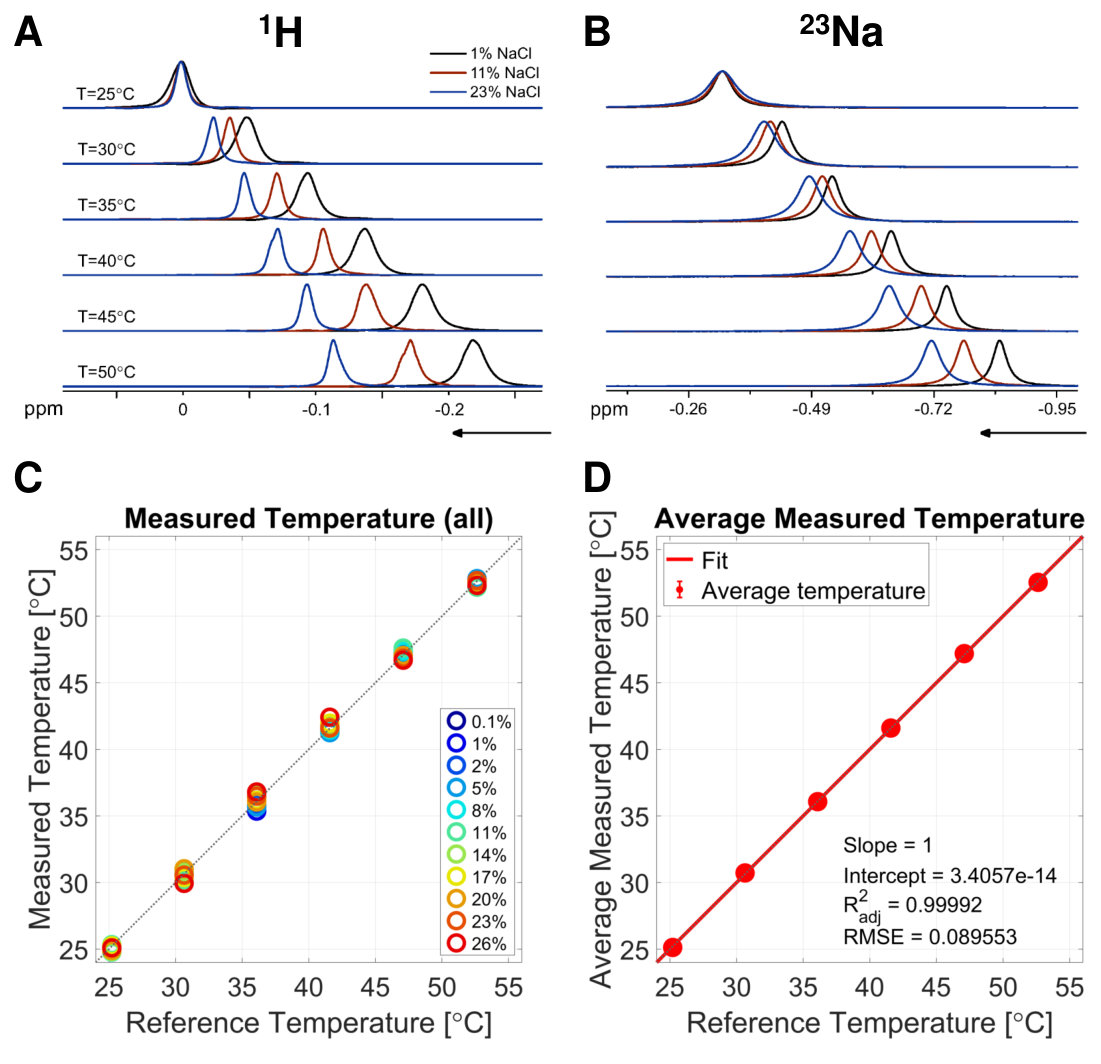 Figure 7
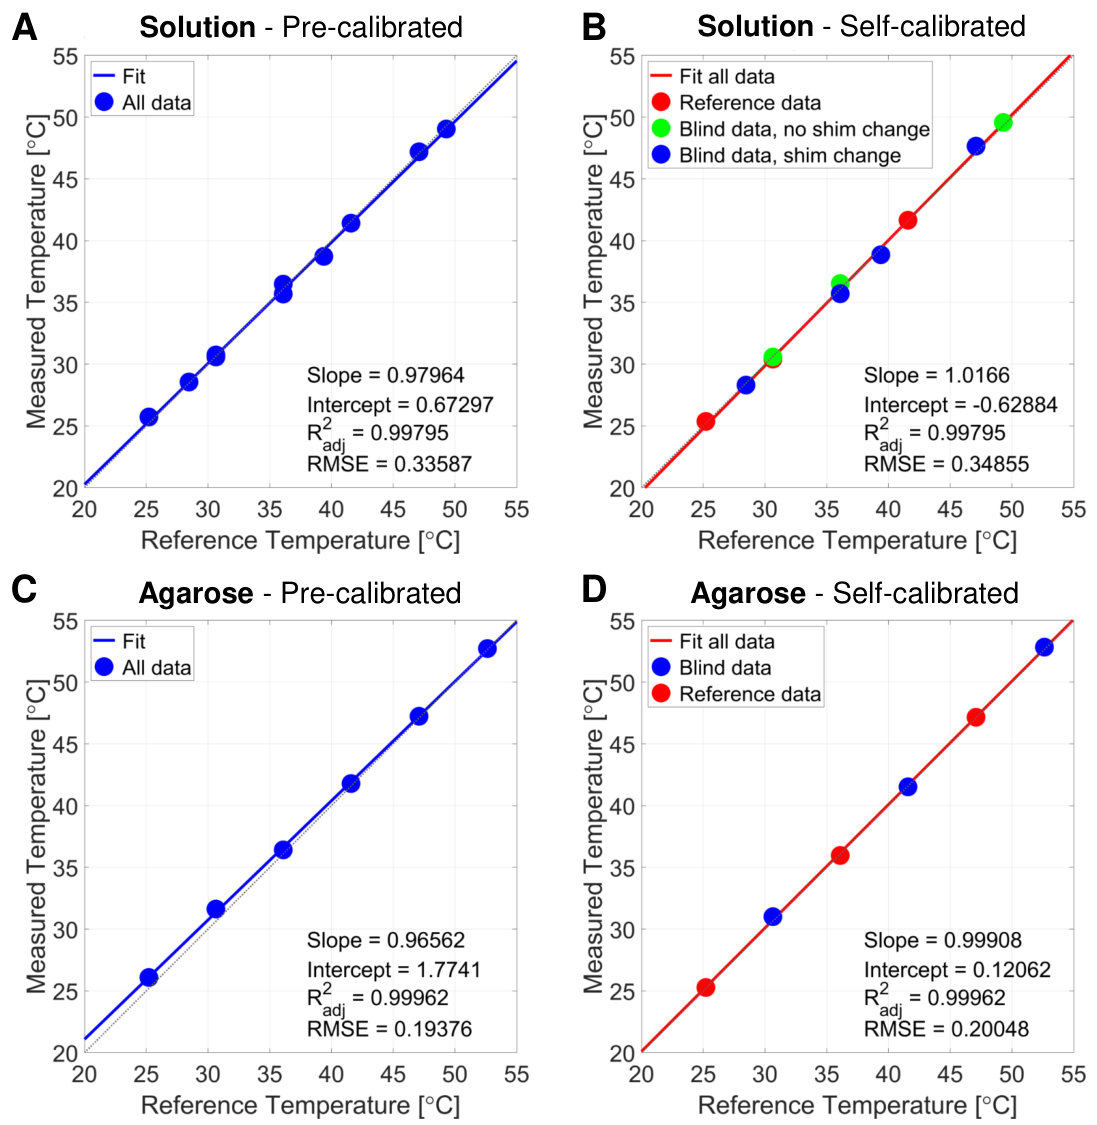 Figure 8
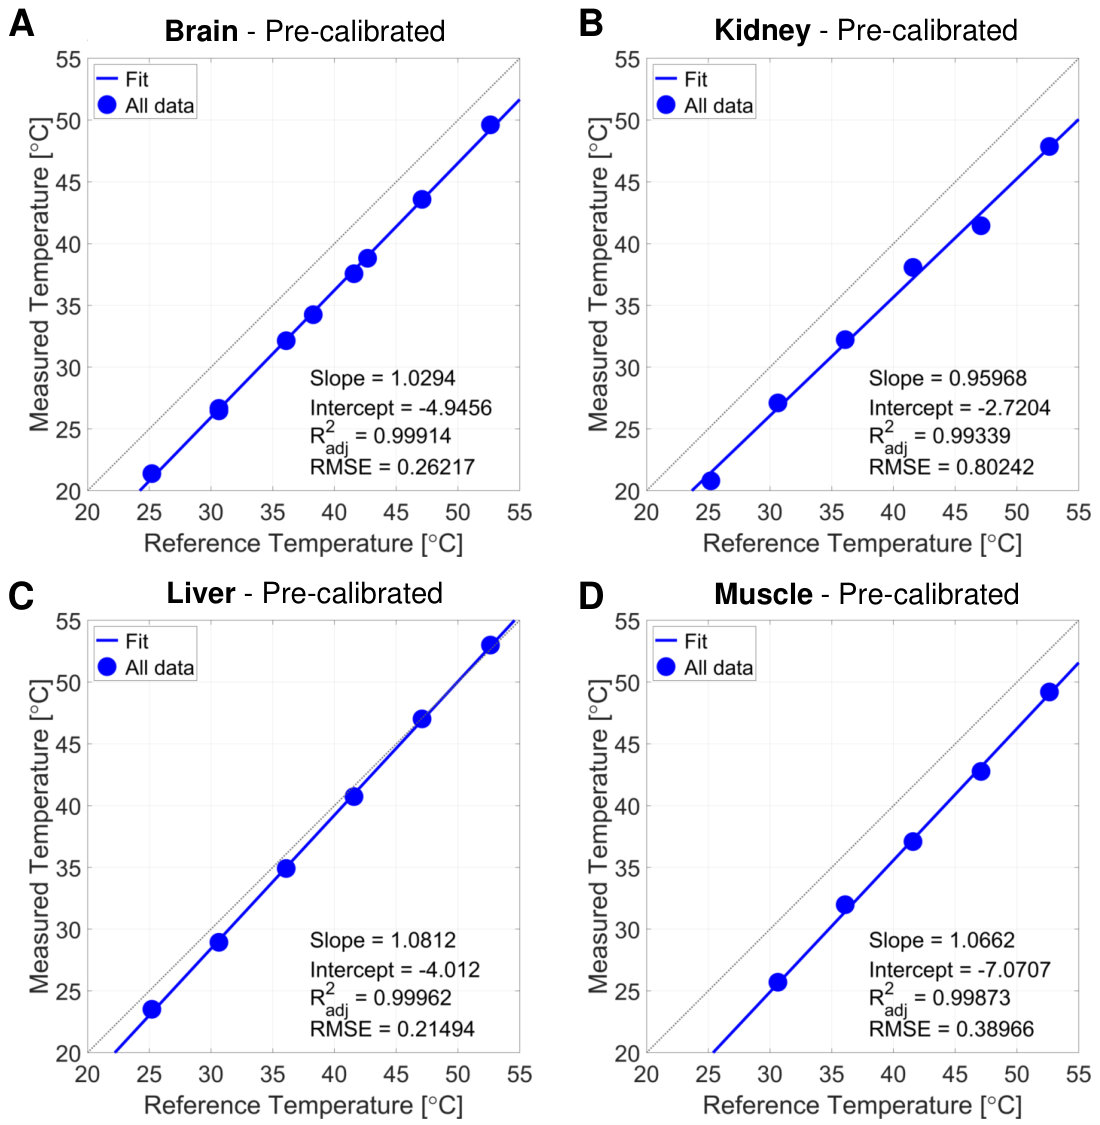 Figure 9
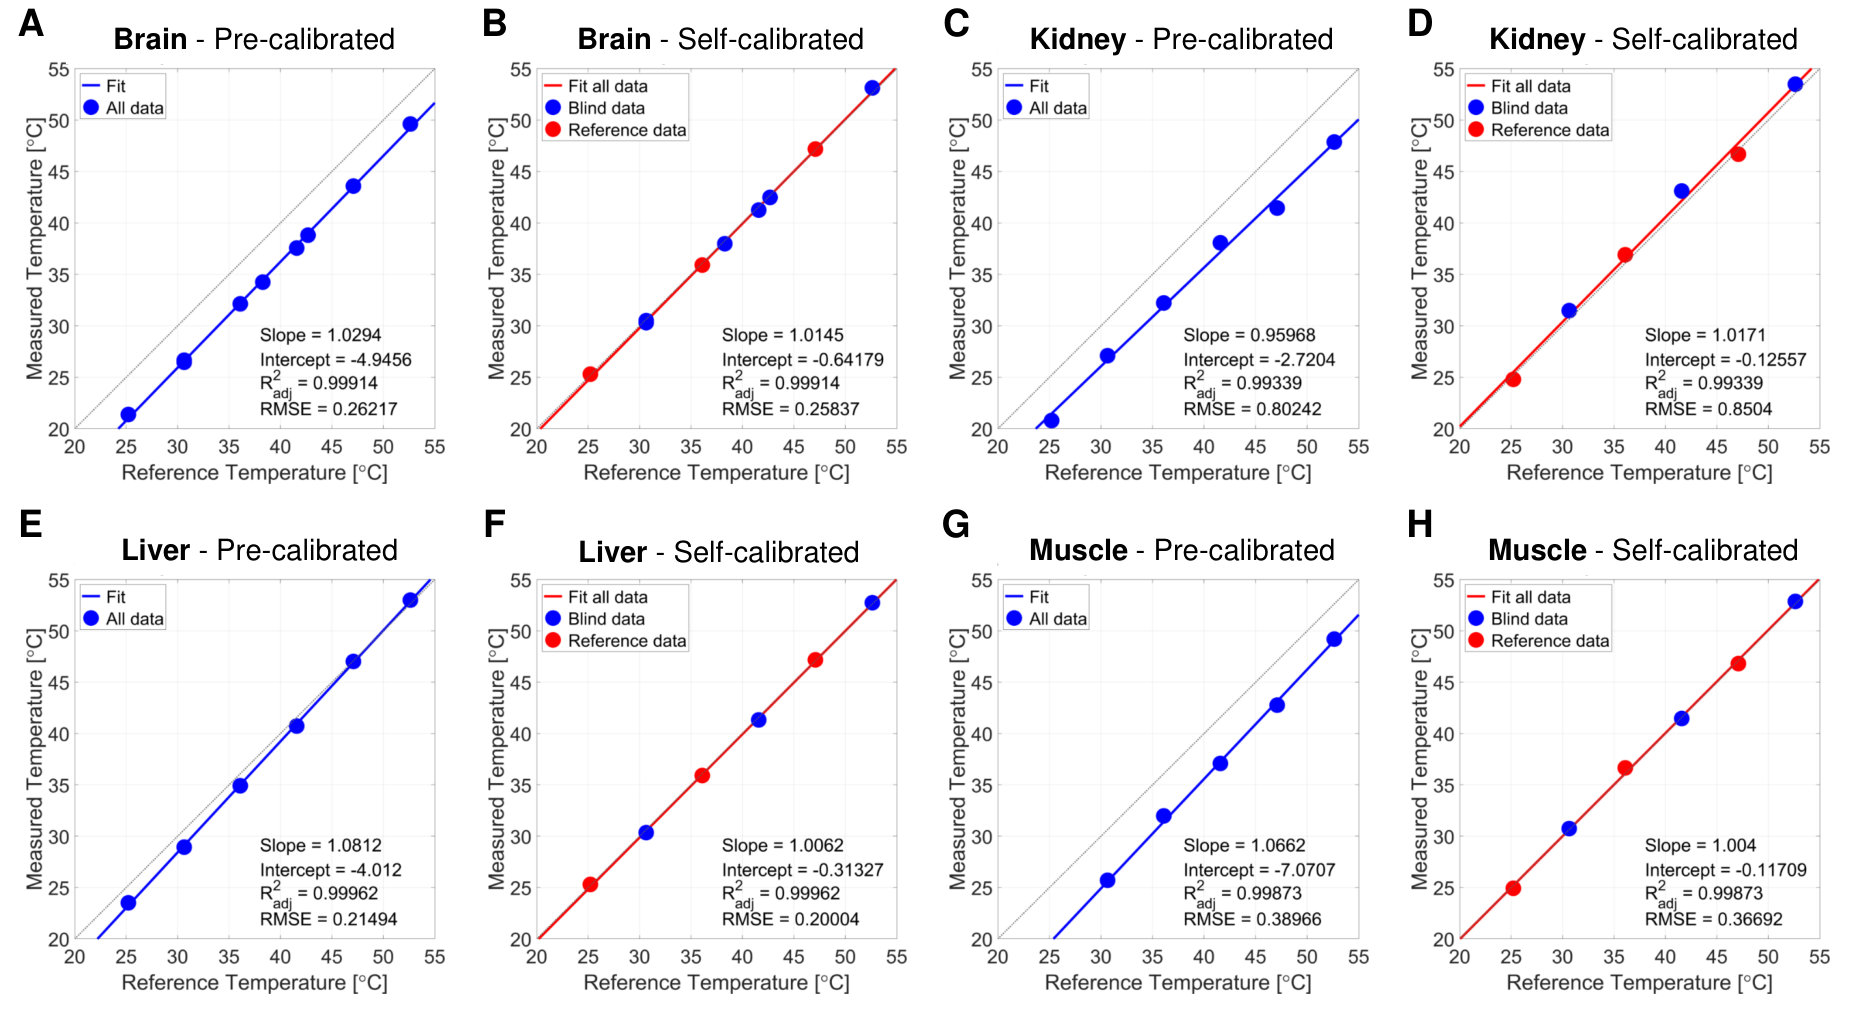 Figure 10
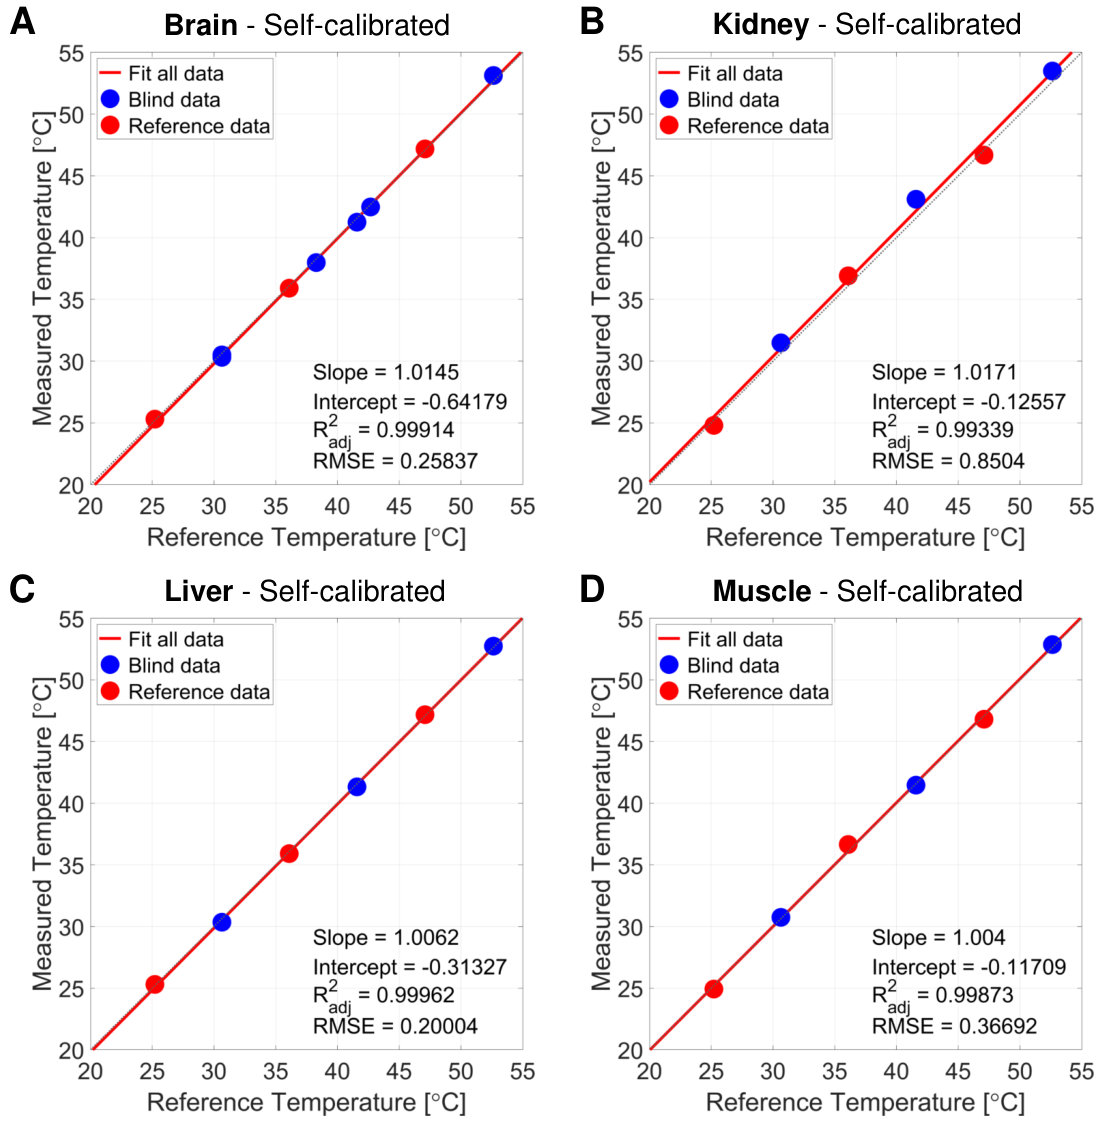 Figure 11
| Samples | Calibration | (ppm/C) | (ppm) |
|---|---|---|---|
| Solution 1% | Solutions 0.1-26% | 0.010690 | 0.056744 |
| Solution 1% | Self-calibration | 0.010301 | 0.070416 |
| Solution 0.3% | Solutions 0.1-26% (fit) | 0.010720 | 0.075141 |
| Agarose | Self-calibration | 0.010321 | 0.075775 |
| Brain | Self-calibration | 0.011060 | 0.023918 |
| Muscle | Self-calibration | 0.011887 | -0.01556 |
| Kidney | Self-calibration | 0.011206 | 0.029343 |
| Liver | Self-calibration | 0.011500 | 0.034852 |
| Temperature (C) | ||||||
| Theoretical (spectrometer) | 25 | 30 | 35 | 40 | 45 | 50 |
| Corrected (real) | 25.21 | 30.64 | 36.09 | 41.58 | 47.09 | 52.63 |
| [NaCl] | |||||||||||
|---|---|---|---|---|---|---|---|---|---|---|---|
| in % weight | 0.1 | 1 | 2 | 5 | 8 | 11 | 14 | 17 | 20 | 23 | 26 |
| in mol/L | 0.017 | 0.172 | 0.346 | 0.885 | 1.446 | 2.030 | 2.637 | 3.269 | 3.924 | 4.605 | 5.311 |
| Fit parameters | for 1H | for 23Na | ||
|---|---|---|---|---|
| a | 0.000172 | 0.000215 | -4.303e-05 | -0.0004218 |
| 95% CB for a | (0.000168,0.000177) | (0.000199,0.000232) | (-5.735,-2.87) | (-0.0005425,-0.000301) |
| b | -0.008183 | -0.01892 | 0.01073 | -0.02573 |
| 95% CB for b | (-0.008248,-0.008117) | (-0.01915,-0.01868) | (0.01053,0.01094) | (-0.02884,-0.02262) |
| c | 0.0829 | |||
| 95% CB for c | (0.06756,0.09823) | |||
| R2adj | 0.99866 | 0.98882 | 0.81874 | 0.99898 |
| RMSE | 5.77 | 2.09 | 1.83 | 0.01056 |
Peer Reviews
No public reviews on file for this paper yet. If you reviewed it on a platform where reviews are public (OpenReview, ICLR, NeurIPS, ICML), you can paste yours below so the community can read it here.
Videos
No videos yet. Explain this paper in a talk, walkthrough, or lecture? Add one.
Taxonomy
TopicsNuclear Physics and Applications · Photoacoustic and Ultrasonic Imaging · Infrared Thermography in Medicine
Multinuclear Absolute MR Thermometry
Emilia V. Silletta
New York University
Department of Chemistry
New York, NY 10003, USA;
Universidad Nacional de Córdoba
Facultad de Matemática Astronomía, Física y Computación
Medina Allende s/n, X5000HUA, Córdoba, Argentina;
Instituto de Física Enrique Gaviola
CONICET, Medina Allende s/n, X5000HUA, Córdoba, Argentina
\ANDAlexej Jerschow
New York University
Department of Chemistry
New York, NY 10003, USA;
\ANDGuillaume Madelin*
New York University School of Medicine
Department of Radiology
Center for Biomedical Imaging
New York, NY 10016, USA
\ANDLeeor Alon
New York University School of Medicine
Department of Radiology
Center for Biomedical Imaging
New York, NY 10016, USA
[email protected] Shared last authorship
Abstract
Non-invasive measurement of absolute temperature is important for proper characterization of various pathologies and for evaluation of thermal dose during interventional procedures. The proton magnetic resonance (MR) frequency shift method can be used to map relative temperature changes in tissues; however, spatiotemporal variations in the main magnetic field and the lack of an internal frequency reference at each location challenge the determination of absolute temperature. Here, we introduce a novel multinuclear method for absolute MR thermometry, based on the fact that the proton and sodium nuclei exhibit a unique and distinct characteristic frequency dependence with temperature. A one-to-one mapping between the precession frequency difference of the two nuclei and absolute temperature is demonstrated. Proof-of-concept experiments were conducted in aqueous solutions with different NaCl concentrations, in agarose gel samples, and in freshly excised ex vivo mouse tissues. One-dimensional chemical shift imaging was also conducted at two steady-state temperatures, demonstrating excellent agreement with infrared measurements.
K****eywords Nuclear Magnetic Resonance Absolute Temperature Mapping Thermometry Sodium Frequency Shift Proton Frequency Shift
1 Introduction
Magnetic resonance imaging (MRI) has become a valuable diagnostic tool for visualization of subtle pathologies with millimeter resolution. In recent years there has been a growing interest in the utilization of MR techniques to measure temperature changes in vivo [1]. While most MR contrast mechanisms vary with temperature change [2, 3, 4, 5, 6, 2, 7, 6, 8], it has been shown that the proton resonance frequency (PRF) method has greatest sensitivity to thermal change in most tissues [9]. The temperature dependence of the PRF was first discovered by Hindman when conducting NMR experiments on intermolecular forces and hydrogen bond formation [9], and adapted to estimate temperature change through MR phase imaging measurements by Ishihara et al. [10] and De Poorter et al. [11]. The method is currently the gold standard for mapping thermal changes in interventional applications such as high-intensity focused ultrasound (HIFU) [12, 13, 14], radiofrequency (RF) hyperthermia [15], RF ablation [16], and RF power deposition from wireless devices [17].
The PRF method relies on the subtraction of pre- and post-exposure phase images, or on the local determination of the frequency shift of protons with MR spectroscopy (MRS), to calculate temperature change due to exposure conditions [18, 19]. However, non-thermal changes, such as due to movement [20, 21], magnet field drift [22], flow [22], or shim changes, greatly limit the applicability of the PRF method. Today, PRF thermometry is restricted to experiments with large thermal gradients or phantom studies with minimal drift throughout the experiment. Furthermore, PRF methodologies are not capable of reconstruction of absolute temperature in tissues, because an internal frequency reference (in each voxel) is required. Knowledge of the absolute temperature in tissues is particularly important due to the correlation of many pathologies with thermal disruption and is fundamental for quantification of thermal dose during interventional procedures [23, 24, 25, 26, 27, 28].
In nuclear magnetic resonance (NMR) experiments, internally-referenced measurements of temperature are widely used to monitor temperature of samples by measuring the chemical shift between two or more temperature-dependent peaks such as between the OH and CH2 groups in ethylene glycol [29]. Internally-referenced experiments are robust against instabilities of because changes in macroscopic equally shift the independent peaks [30, 31], enabling the reconstruction of absolute temperature. In the brain, the amid proton in N-acetylaspartate (NAA) peak has been utilized as a temperature-independent reference. However, due to the low concentration of NAA in the brain (10 mM) [32], challenges associated with water suppression, pH-dependent separation of the NAA-water peaks, and imaging time required to obtain adequate signal-to-noise ratio (SNR), absolute thermometry via imaging of the NAA peak remains challenging [33]. Overall, utilization of a frequency reference, endogenous to most tissues, for the reconstruction of absolute temperature has not been attainable since the advent of NMR.
In this work, we introduce a novel multinuclear approach for absolute MR thermometry. We demonstrate that 23Na nuclei exhibit an NMR frequency shift dependency with temperature that is roughly twice that of the 1H nuclei. Thus, measuring the difference of NMR frequencies of the 23Na and 1H nuclei provides a one-to-one mapping with temperature, allowing absolute temperature reconstruction that is robust against macroscopic inhomogeneities. Proof-of-concept experiments were conducted in aqueous solutions with different NaCl concentrations, in agarose gel samples, and in freshly-excised ex vivo mouse tissues. One-dimensional chemical shift imaging (CSI) was also performed for two steady-state temperature regimes.
2 Theory
Temperature dependence of the NMR frequency shift
The Larmor frequency of the magnetic moment of a nucleus is determined by the magnetic field that the nucleus experiences and the gyromagnetic ratio of the nucleus. is the result from a shielding constant altering the macroscopic magnetic field according to:
[TABLE]
The shielding constant is expressed as:
[TABLE]
where is the intramolecular shielding constant, is the intermolecular electric shielding effect, and is the volume magnetic susceptibility shielding effect of nucleus . Both and can change with temperature . The precession frequency can thus be expressed as:
[TABLE]
By defining , we can calculate the frequency shift of a nucleus , in parts-per-million (ppm), as:
[TABLE]
This can be expressed as the sum of a temperature-independent component and a temperature-dependent component:
[TABLE]
Since the temperature dependency of and is linear with temperature [9, 34], the susceptibility and electric shielding can be written:
[TABLE]
Equations 6a and 6b can be combined such that the nucleus’ frequency shift is rewritten as a constant (in ppm) and a frequency shift thermal coefficient (in ppm/*∘*C):
[TABLE]
with
[TABLE]
Measurement of relative temperature change
The frequency shift thermal coefficient can be calibrated for a specific nucleus (e.g. 1H) and a sample of interest. Since can vary with local fluctuations (shim, motion, field drift), and the component is generally unknown and can vary due to different electronic and susceptibility shieldings, absolute temperature cannot be calculated using Eq. 7. This equation can however be used to measure relative temperature changes using nucleus = 1H MRS or MRI (PRF method) and a calibrated value -0.01 ppm/*∘*C [34] in human tissues. By subtracting the frequency shifts measured at 2 different times (e.g. before and after heating), the effect of is cancelled and relative temperature changes are calculated as:
[TABLE]
Measurement of absolute temperature
Absolute temperature can be derived from Eq. 7 by detecting the frequency shift of two nuclei within the same sample or voxel (in case of localized MRS or MRI), where the difference between their respective frequency shift thermal coefficients and constants are well-known theoretically or calibrated experimentally. Using the following definitions for two nuclei (which can even be of the same species, but from a different molecule or local environment):
[TABLE]
the frequency shift difference between the two nuclei can thus be written:
[TABLE]
Upon calibration of and for the two nuclei and samples of interest (fluid, tissue), absolute temperature of the sample can be calculated as follows:
[TABLE]
Methods
NMR experiments
Experiments were carried out on an 11.7 T NMR Bruker Avance I spectrometer (Bruker BioSpin) operating at 500.19 MHz for 1H, and 132.3 MHz for 23Na, using a 5 mm double resonance broadband probe. The test tubes with different samples under investigation (aqueous solutions with different NaCl concentrations, agarose gel, ex vivo tissues) were placed inside the spectrometer where the sample temperature could be controlled using gas flow and a temperature sensor providing a precise, stable and reliable temperature regulation. After each desired temperature was reached, a standard free induction decay (FID) pulse sequence was used with a 90 pulse. The duration of the pulse is 11 s and 9 s for 1H and 23Na, respectively, and 8 averages were used with TR = 15 s for 1H, and 0.5 s for 23Na, dwell time = 100 s, spectral width = 5 kHz.
Solutions and agarose gel
Solution samples with 11 different NaCl concentrations ( = 0.1, 1, 2, 5, 8, 11, 14, 17, 20, 23, 26 % weight) were prepared by mixing mg of NaCl in mg of deionized water in a beaker (with = 0.01, 0.1, 0.2, 0.5, 0.8, 1.1, 1.4, 1.7, 2.0, 2.3, 2.6), and transfered to 5 mm NMR tubes. The solution at 26% weight correspond to NaCl saturation in water. Corresponding NaCl concentrations in mol/L can be calculated according to the equations NaCl concentration calibration and NaCl concentration calibration below, and results are presented in Table LABEL:tab:nacl_concentration. A gel was prepared by mixing 2% w/v of agarose with 1% w/v NaCl in deionized water. The gel mixture was incrementally heated in a microwave to fully dissolve the agarose. The solution was poured into a 5 mm NMR tube forming a uniform, homogeneous gel upon cooling.
Tissue samples
Four tissues samples (brain, kidney, liver and muscle) were obtained from two female mice whose weights were 22.2 and 25 g.
Effect of pH
In order to study the effect of pH on the multinuclear MR temperature measurements, solutions with different pH values were tested for and calibration. The solutions of different pH values were prepared by adding a small amount of acid HCl or base KOH solutions to the water solution sample with 1% weight NaCl, to adjust to the desired pH value. The pH was measured with a Fisher ScientificPM accumetPM AB150 pH Benchtop Meter and calibrated with three standard buffers with pH values 4.01, 7 and 10.01. The reported pH values were measured before acquiring the NMR data. The pH range was from 4.9 to 9.07. The results are shown in Figure 3 and demonstrate that pH has negligible influence on the and values.
Heating system and 1D CSI procedure
An in-house built alternating-current resistive heating setup was constructed to create an NMR-compatible heating setup that does not interfere with the multinuclear NMR acquisition [35]. A signal generator (B071HJ31WN, KKmoon, China), operating at 100 KHz was connected to a 130W class D amplifier (TPA3250D2EVM, Texas instruments Inc., USA). The output of the amplifier was connected an in-house built low pass filter with a cutoff frequency of 10 MHz to mitigate radiofrequency waves being picked up and transmitted in close proximity to the RF coil in the NMR spectrometer. The output of the low pass filter was connected to a resistive wire insert made of wounded AWG 32G enameled copper wire (ECW32AWG1LB, Bntechgo Inc., USA) placed inside the 5 mm NMR test tube filled with 2% agarose and 1% NaCl in water. A baseline proton 1D chemical shift imaging (CSI) acquisition was conducted with the following imaging parameters: 16 steps in the z-encoding, 1 average, and a repetition time of 15 s, giving a total experimental time of 5 min. A sodium 1D CSI acquisition over the same field of view was then acquired with the following parameters: 16 steps in the z-encoding, 32 averages, and a repetition time of 0.3 s, with a total experimental time of 5 min. The 1D CSI pulse sequence consisted of a 90 pulse followed by a pulse gradient which encodes the spatial position in z-direction.
After the baseline proton and sodium acquisitions were conducted, a 1V peak-to-peak sinusoidal waveform was used to drive the amplifier. The waveform at 100 KHz was used in order to not interfere with the RF, gradient or field. Sample temperature was monitored in real time with the internal temperature probe of the Bruker 500MHz spectrometer to ensure that heating of the sample was in a steady state. After twenty minutes, a steady state of the temperature was attained, and CSI acquisitions were acquired at proton and sodium frequencies. Sodium and proton spectra were then used to reconstruct the absolute temperature. The absolute temperature was plotted and compared with infrared temperature measurements acquired at steady state temperature using a FLAIR infrared (IR) camera (E75, FLIR Systems Inc., USA).
Results
All experiments were performed at 11.7 T with the following spectrometer reference frequencies: = 500.2031765 MHz, = 132.3120951 MHz (fixed ratio / = 3.7804796). We first measured and in 11 samples with NaCl concentrations ranging from 0.1% to 26% (saturation) by weight. For each solution, NMR spectra were acquired at 6 different temperatures, as measured by the spectrometer sensor: 25, 30, 35, 40, 45 and 50C (the corresponding real temperatures corrected using the spectrometer temperature calibration are shown in SI: Materials and Methods, and Table S1). The position of the peak maximum followed a linear trend with temperature, with the slope corresponding to the frequency shift thermal coefficient , and the intercept .
Figure 1(A,B) shows examples of 1H and 23Na spectra at different temperatures, where the frequency changes with temperature are shown to vary with the NaCl concentration. Figure 1(C) shows the measured temperature for all NaCl solutions after calibration of and from the results shown in Figure 2, compared to the reference temperature at which the experiments were performed. The average measured temperature for all solutions is plotted in Figure 1(D), showing excellent agreement with reference temperature (adjusted = 0.99992, and root mean square error RMSE = 0.09*∘*C).
Figure 2 shows the results of the linear fitting of the frequency shift of 1H and 23Na versus temperature for the 11 samples. The fits are shown in SI, Figures S1-S11. The frequency shift thermal coefficient for 1H, shown in Figure 2(A), is consistent with literature, where the value of approximately -0.01 ppm/C is typically found for low NaCl concentrations (1% weight or less in biological tissues). It was found that the frequency shift thermal coefficient for 23Na was approximately twice higher in magnitude than for 1H. The 1H and 23Na spectra for each sample were acquired on the same day at 6 temperatures, and the same shim was used for both nuclei. Different samples were acquired on different days in the following order: 1%, 26%, 11%, 17%, 23%, 8%, 0.1%, 2%, 5%, 14%, 20%. This random order ensures that the smooth variation that was detected for and with NaCl concentrations was not an effect of the spectrometer magnetic field drift or shim changes on different days. As shown on Figure 2(C,D), both and showed a smooth variation with NaCl concentration, even when individual values for 1H and 23Na seem to fluctuate randomly in different samples acquired on different days. The variation of is linear with increased NaCl concentration, while the variation of shows a nearly linear decrease with increasing NaCl concentration.
In order to study the effect of pH on the multinuclear MR temperature measurements, solutions with different pH values were tested for and calibration. The pH range was from 4.9 to 9.07. The results are shown in 3 and demonstrate that pH has negligible influence on the and values.
In order to test the ability of the method to predict unknown temperatures, 10 experiments were then carried out on a solution with NaCl concentration of 1% weight (similar to physiological conditions). Figure 4(A) shows the calculated temperatures for all the data using the and calibration obtained with the 1% solution used in Figure 2 and Table 1. As a next step, three peak frequency measurements at 25, 30 and 40*∘*C were used to self-calibrate and for this sample, plotted by red dots in Figure 4(B). The sample was then brought to three random blind temperatures with the same shimming conditions (green dots in Figure 4(B)). Then, the sample was brought to four more random blind temperatures where the magnet shims were randomly changed to alter (blue dots in Figure 4(B)). All calculated temperatures in 4(A,B) were in excellent agreement with the reference temperatures ( = 0.998, RMSE C). A similar experiment was conducted in a sample with 2% agarose and 1% NaCl. Figure 4(C) shows the results of the calculated temperature plotted against the reference value using the pre-calibrated and from the 1% NaCl solution used in Figure 1(C). In Figure 4(D), three frequency measurements were used to self-calibrate and in the gel itself, and three blind temperatures were calculated. In both cases, pre-calibration in a 1% NaCl solution and self-calibration in gel lead to very similar results with accurate and precise measurement of the sample temperatures ( = 0.999, RMSE C).
Figure 5 shows the temperatures measured in freshly excised ex vivo mouse tissues (brain, kidney, liver, and muscle) using three peak frequency measurements at 25, 35 and 45*∘*C for self-calibrating and , and other blind temperatures were calculated from this self-calibration. In all tissues, an excellent agreement was found for the calculated temperature when this self-calibration procedure was used. However, when the pre-calibration of and was calculated from a 0.3% NaCl solution (or approximately 50 mM, similar to biological tissue concentrations) from fitting of the data measured at 0.1 to 26% NaCl, a constant offset is detected. Pre-calibration of and from the 1% NaCl and the 0.1% NaCl solution were also tested, with similar results than with 0.3% NaCl. Only in the case of liver, the pre-calibrated temperature measurement showed a good agreement with the reference temperature, as shown in Figure 5(E). The main difference in sample preparation was that the consistency of the liver sample was still homogeneous when introduced in the NMR tube, while the other tissue samples were composed of small pieces, leading to a more inhomogeneous system which increased the susceptibility effects significantly (air bubbles, fat mixture within the tissue), resulting in a constant temperature offset.
Finally, in order to test the ability to map absolute temperature spatially, a 1D CSI measurement was carried out as shown in Figure 6. The experiment was conducted in the gel sample with 2% agarose and 1% NaCl. The heating system setup is shown in Figure 6(A) and the spatial temperature map of the sample measured with an infrared (IR) camera is shown in Figure 6(B). Figure 6(C) shows the measured temperatures using both IR camera (open square) and CSI data (closed circles) over 20 mm in the sample (NMR-detectable zone) before and after heating the sample. The measured temperatures using both methods are in good agreement, showing an increase of 1C along the entire sample after sample heating.
The values of and used in this paper for calculating temperatures in 1% NaCl solution, in agarose gel, and in tissue samples, are summarized in Table 1.
Discussion
In this work, we present a new method of multinuclear absolute MR thermometry which takes advantage of the different and unique frequency shifts of the sodium and proton nuclei with temperature. The method is validated in fluid samples with different NaCl concentrations, in agarose gels, and in ex vivo fresh tissue from mice, with precise temperature control. The method was shown to be robust to inhomogeneities which are a challenge for thermometry methods such as the PRF.
Changes in water proton frequency shifts with temperature reflect changes in the hydrogen-bonded structure of water [36, 9, 37, 38]. The nature of these changes has been studied extensively, and two main models have been proposed to explain it [9, 39]. In the first model, the temperature-induced frequency shift of water relates to the stretching and bending of the hydrogen bonds which are responsible for the electrical shielding effect [39]. The second model describes a change in electrical shielding due to the breaking of the hydrogen bonds. Specifically, a steady state is created between ice-like lattice water structure, where hydrogen bonds are fully formed, and a monomeric water structure where no hydrogen bonds are present. These two models, when used independently, cannot fully explain the temperature- and ionic concentration-dependent frequency shift of water. Consequently, a mixed model where hydrogen bond length stretching and bending (model 1) alongside hydrogen bond rearrangements (model 2) best explains and predicts experimental results on the temperature and ionic concentration dependency of the water frequency shift [40]. The effect of strong electrolytes (such as NaCl) causes a concentration-dependent shift in the proton resonance frequency, with some electrolytes inducing an increase in the frequency, while others, such as Na+, inducing a reduction in the frequency [41, 34, 42]. The chloride ion Cl- has been shown to have a small effect on the proton frequency shift relative to that of Na+ [34]. When the sodium ion is surrounded by water, a hydration shell is created, where, depending on the temperature, four to eight [43, 44, 45] molecules of water can temporarily coordinate a single Na+. In such solutions, water molecules can be in an unbound state with the ion (free water outside the hydration shell), which causes minimal change to the electrostatic structure of the hydrogen bond. For a fraction of time, water molecules are in a bound state with the ion (hydration shell) [46], causing a structural modification to the hydrogen bond, thus altering the electrical shielding of the 1H nucleus. The time for which water is bound to the ion is dependent on the NaCl concentration.
With respect to the frequency shift of the sodium ion, a strong correlation with the frequency shift of water was observed, suggesting that a temperature-related modification of the hydrogen bonds coexists with a modification of the electrical shielding of the sodium ion. A temperature rise increases the effective hydrogen bond length of water, increasing the negative charge distribution around the oxygen nucleus within the water molecule. This increase in negative charge distribution intensifies the ion-dipolar attraction between oxygen and sodium, consequently enhancing the electrical shielding of the sodium nucleus. As the concentration of NaCl increases, the magnitude of the frequency shift thermal coefficient of sodium decreases due to the competition between the ions for the water molecules, causing a decrease in average time for which water is bound to the ion [40]. These effects form the basis for the multinuclear absolute thermometry method, enabling a sample-specific bijective mapping between the frequency difference of 1H and 23Na nuclei and temperature.
Our results demonstrate that once the proposed multinuclear thermometry method was calibrated on the aqueous solution with 1% NaCl, the frequency shift difference between the 1H and 23Na nuclei can be used to calculate the absolute temperature of the same sample under different shimming conditions with high accuracy (with an error of the order of 0.3C for temperatures between 25 and 50C). When calibration of the multinuclear thermometry method was conducted in aqueous solutions and then applied to predict the temperature in ex vivo tissue samples (brain, muscle, liver and kidney), a constant temperature offset was observed. We believe that this offset can occur due to two main factors influencing the calibration of and : (1) the preparation of the tissue samples, and (2) the presence of multiple ions inside the tissue samples. In case (1), the tissue samples were inserted in small pieces into the 5 mm NMR tubes, thus creating relatively inhomogeneous samples with air bubbles that are artificially inducing strong local susceptibility effects which are significantly stronger than under in vivo conditions. This tissue susceptibility was not present in the aqueous solution calibration of and , and is most likely the main source of error. An exception was the liver sample that was kept uniform and homogeneous in the tube, hence a closer agreement between the pre-calibrated and the self-calibrated temperature measurements was found. In case (2), previous studies have shown that, for example, the presence of potassium ions K+ can cause a proton frequency shift, while other ions generally induce smaller shifts due to their small chemical shift effect or their smaller concentrations in tissues [34, 42]. These ions were not present in the liquid samples, yet present in tissues at varying concentrations. The effect of these ions on the sodium resonance frequency shift is poorly understood and needs further future investigation.
Studies have shown that the volume of magnetic susceptibility changes linearly with temperature [47], and its effect on the 1H resonance frequency shift is roughly an order of magnitude smaller than the electrical shielding effect [47, 48, 18]. As a result, calibration of the absolute thermometry method on the sample includes the sample-specific magnetic susceptibility shielding information for both sodium and proton. While susceptibility changes are accounted for in the model, measurement of temperature in voxels with very high susceptibility that alters the lineshapes of the spectra can be challenging since the reconstruction relies on detection of the proton and sodium spectra’s center frequency. This effect was observed in our CSI measurements, where voxels close to the edge of the tube and close to the metallic resistive heating apparatus had to be excluded from the reconstruction due to spectral distortion.
In conclusion, we present a proof-of-concept method for measuring the absolute temperature non-invasively in samples using a multinuclear magnetic resonance approach, based on the detection of the frequency shift difference between two different nuclei (1H and 23Na is this case). This absolute temperature mapping method is compatible with an implementation using phase MRI or localized MRS at both the 1H and 23Na frequencies, for potential medical applications. Phase measurement acquisitions are more time-efficient than spectroscopic imaging as long repetition times needed to obtain high spectral resolution are not necessary, which can have an impact on the timing of clinical scanning. Translation and optimization of the multinuclear absolute thermometry technique to in vivo imaging, where both sodium and proton phase images can be acquired simultaneously or in an interleaved fashion [49], will be the subject of a future investigation.
Acknowledgement
The authors want to thank Dr Seena Dehkharghani for useful discussions on the mechanisms underlying the proton and sodium frequency shift dependence with temperature. This work was supported in part by the National Institutes of Health (NIH): grants R01EB026456, R01NS097494, R21CA213169 and P41EB017183. The work was also supported by an award from the US National Science Foundation: NSF CBET 1804723.
Supplemental Material
NaCl concentration calibration
The conversion of NaCl concentration from % weight (%wt) unit to mol/L unit was calculated using the two following equations:
[TABLE]
with the density of water in kg/L or g/mL, a = 1.682, b = 0.007079 and c = 0.9984, calculated using the data from the CRC Handbook of Chemistry and Physics (86th ed), p. 8-71 [50], on the properties of water-NaCl mixtures (density of water at different NaCl concentrations in %wt); and
[TABLE]
with M = 58.44 g/mol the molar mass of NaCl.
Spectrometer temperature calibration
The sample temperature was controlled with a variable temperature system, which is part of the Bruker spectrometer. The gas flow streams through a pipe along the sample tube and leaves the probe head at the top. A temperature sensor measures the temperature and gives the value to a control unit that regulates the heater power to keep the temperature constant. Since the temperature sensor is not inside the NMR tube, a calibration must be done in a sample with a known temperature-dependence behavior. Calibration data was previously acquired on this spectrometer on methanol, where the chemical shift difference between the peaks correlates to the real temperature [51]. The range of temperatures was from -50C to 67C. The real temperatures calculated from the frequency shifts of the peaks are compared to the temperatures obtained from the control unit in the spectrometer, and the following fitting parameters were obtained between the real temperature in the sample and the temperature measured by the spectrometer sensor :
[TABLE]
with a = 5.944181, b = 1.052388, and c = -1.470807. We used the same correction for all of our experiments. See Table LABEL:tab:temperature_calibration for the resulting corrected (real) temperatures used in our experiments. The frequency shifts of the 1H and 23Na signals were detected at each temperature by tracking the position of the maximum of peak of their NMR spectrum. All data processing was performed in Matlab (The MathWorks Inc., Natick, MA, USA).
Measurements of frequency shift thermal coefficient and constant for 1H and 23Na in solutions
The frequency shift thermal coefficient and constant intercept were measured in 11 solutions with different NaCl concentrations ( = 0.1, 1, 2, 5, 8, 11, 14, 17, 20, 23, 26 % weight), by fitting the frequency shift of the maximum of the NMR peak versus 6 temperatures ( = 25, 30, 35, 40, 45, 50*∘*C), for both the 1H and 23Na nuclei:
[TABLE]
Fitting of , , , versus NaCl concentrations
The values of , , , measured at different NaCl concentrations were fitted using the equations below. The fitting parameters are given in Table • ‣ 4.
For and of 1H and 23Na, and for :
[TABLE]
For :
[TABLE]
The reference list from the paper itself. Each links out to its DOI / PubMed record.
- 1[1] V. Rieke and K. Butts Pauly. MR Thermometry. J Magn Reson Imag , 27(2):276–390, 2008.
- 2[2] Nicolaas Bloembergen, Edward Mills Purcell, and Robert V Pound. Relaxation effects in nuclear magnetic resonance absorption. Phys Rev , 73(7):679, 1948.
- 3[3] JH Simpson and HY Carr. Diffusion and nuclear spin relaxation in water. Phys Rev , 111(5):1201, 1958.
- 4[4] TR Nelson and SM Tung. Temperature dependence of proton relaxation times in vitro. Mag Res Imag , 5(3):189–199, 1987.
- 5[5] Alistair S Hall, Michael V Prior, Jeffrey W Hand, Ian R Young, and Robert J Dickinson. Observation by mr imaging of in vivo temperature changes induced by radio frequency hyperthermia. J Comp Ass Tom , 14(3):430–436, 1990.
- 6[6] RJ Dickinson, AS Hall, AJ Hind, and IR Young. Measurement of changes in tissue temperature using mr imaging. J Comp Ass Tom , 10(3):468–472, 1986.
- 7[7] Paul A Bottomley, Thomas H Foster, Raymond E Argersinger, and Leah M Pfeifer. A review of normal tissue hydrogen nmr relaxation times and relaxation mechanisms from 1–100 mhz: dependence on tissue type, nmr frequency, temperature, species, excision, and age. Med Phys , 11(4):425–448, 1984.
- 8[8] José Delannoy, Ching-Nien Chen, Robert Turner, RL Levin, and Denis Le Bihan. Noninvasive temperature imaging using diffusion mri. Mag Res Med , 19(2):333–339, 1991.