Nucleation and growth bottleneck in the conductivity recovery dynamics of nickelate thin films
Elsa Abreu, Derek Meyers, Verner K. Thorsmolle, Jingdi Zhang, Xiaoran, Liu, Kun Geng, Jak Chakhalian, Richard D. Averitt

TL;DR
This study explores the ultrafast conductivity recovery in nickelate thin films after thermal quenching, revealing distinct dynamics in different compounds and potential for rapid electronic switching.
Contribution
It demonstrates that NdNiO$_3$ exhibits non-exponential, first-order recovery dynamics well-described by a 2D Avrami model, highlighting phase coexistence and supercooling effects.
Findings
NdNiO$_3$ shows non-exponential, slower recovery.
EuNiO$_3$ exhibits exponential recovery.
Large transient responses suggest fast switching potential.
Abstract
We investigate THz conductivity dynamics in NdNiO and EuNiO thin films following a photoinduced thermal quench into the metallic state and reveal a clear contrast between first- and second-order dynamics. While in EuNiO the conductivity recovers exponentially, in NdNiO the recovery is non-exponential and slower than a simple thermal model. Crucially, it is consistent with first-order dynamics and well-described by a 2d Avrami model, with supercooling leading to metastable phase coexistence. The large transients seen in our films are promising for fast electronic (and magnetic) switching applications.
Click any figure to enlarge with its caption.
 Figure 1
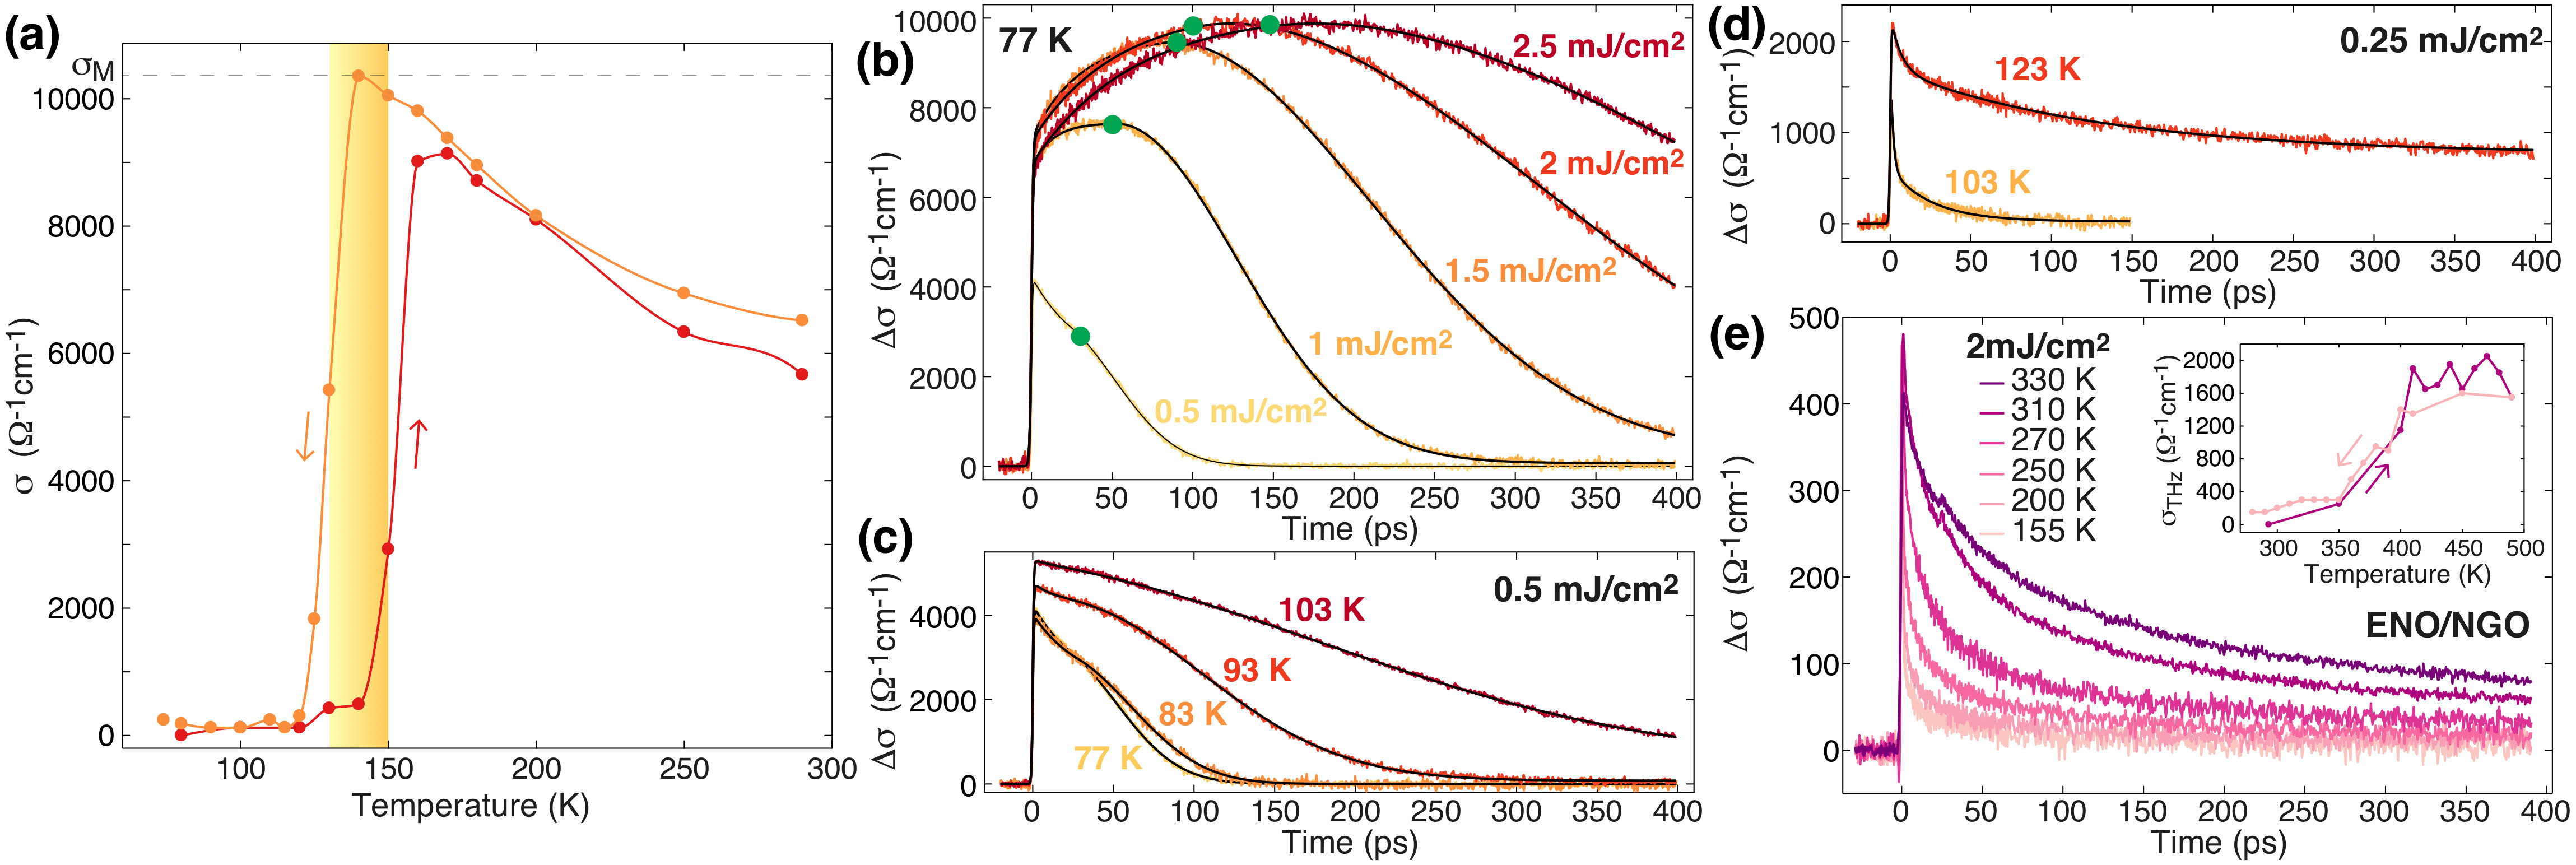 Figure 1
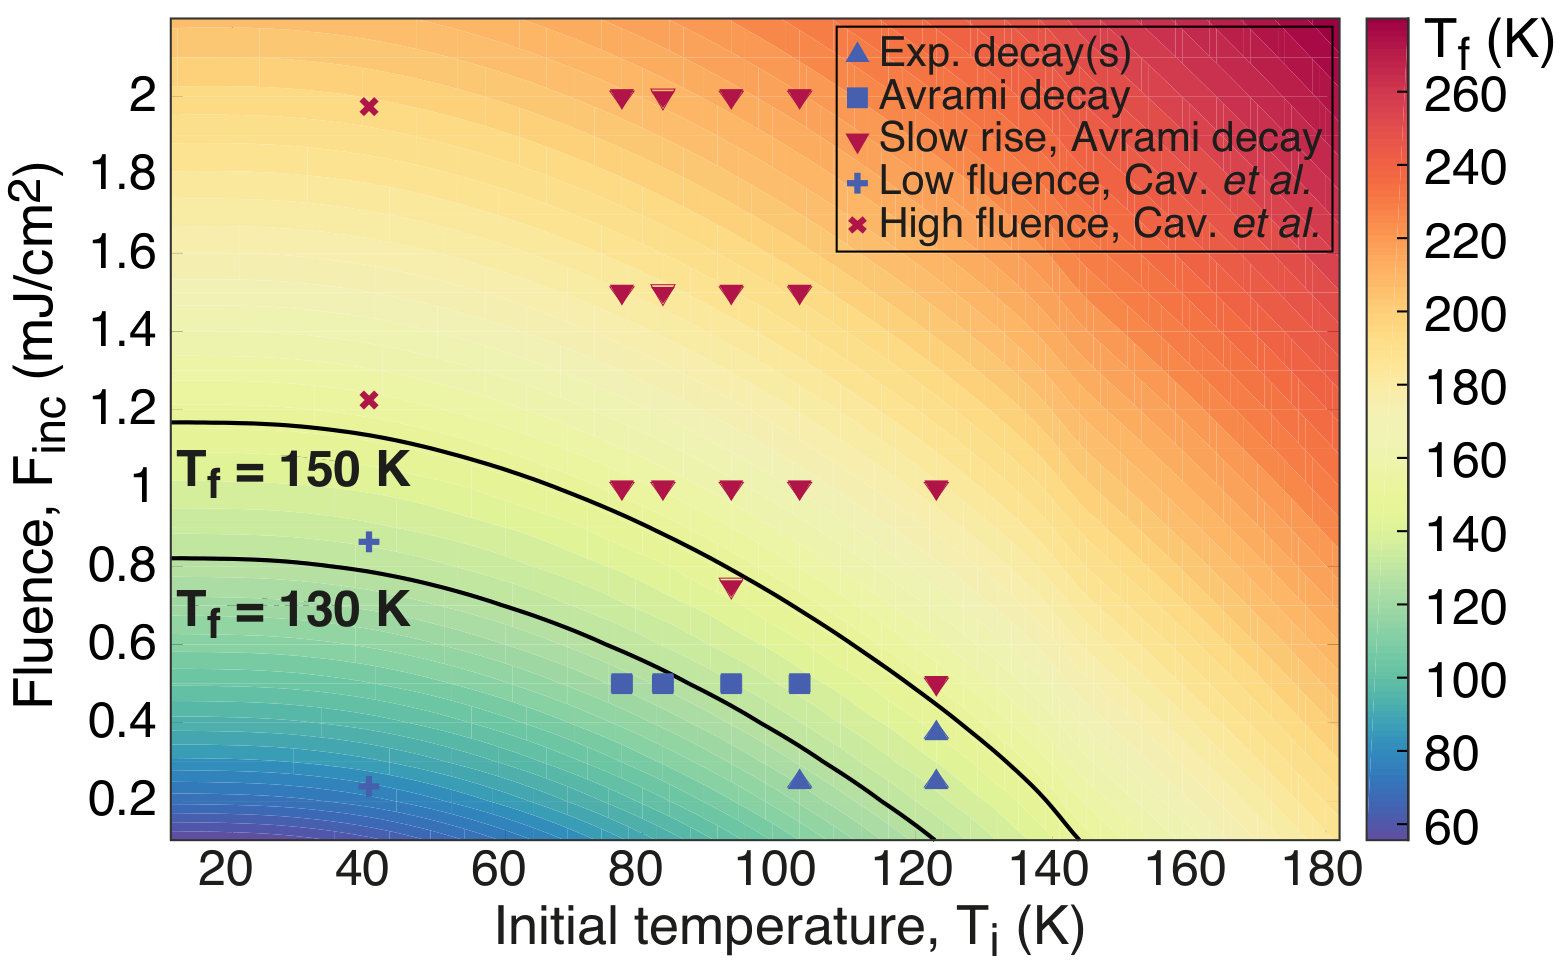 Figure 2
 Figure 3
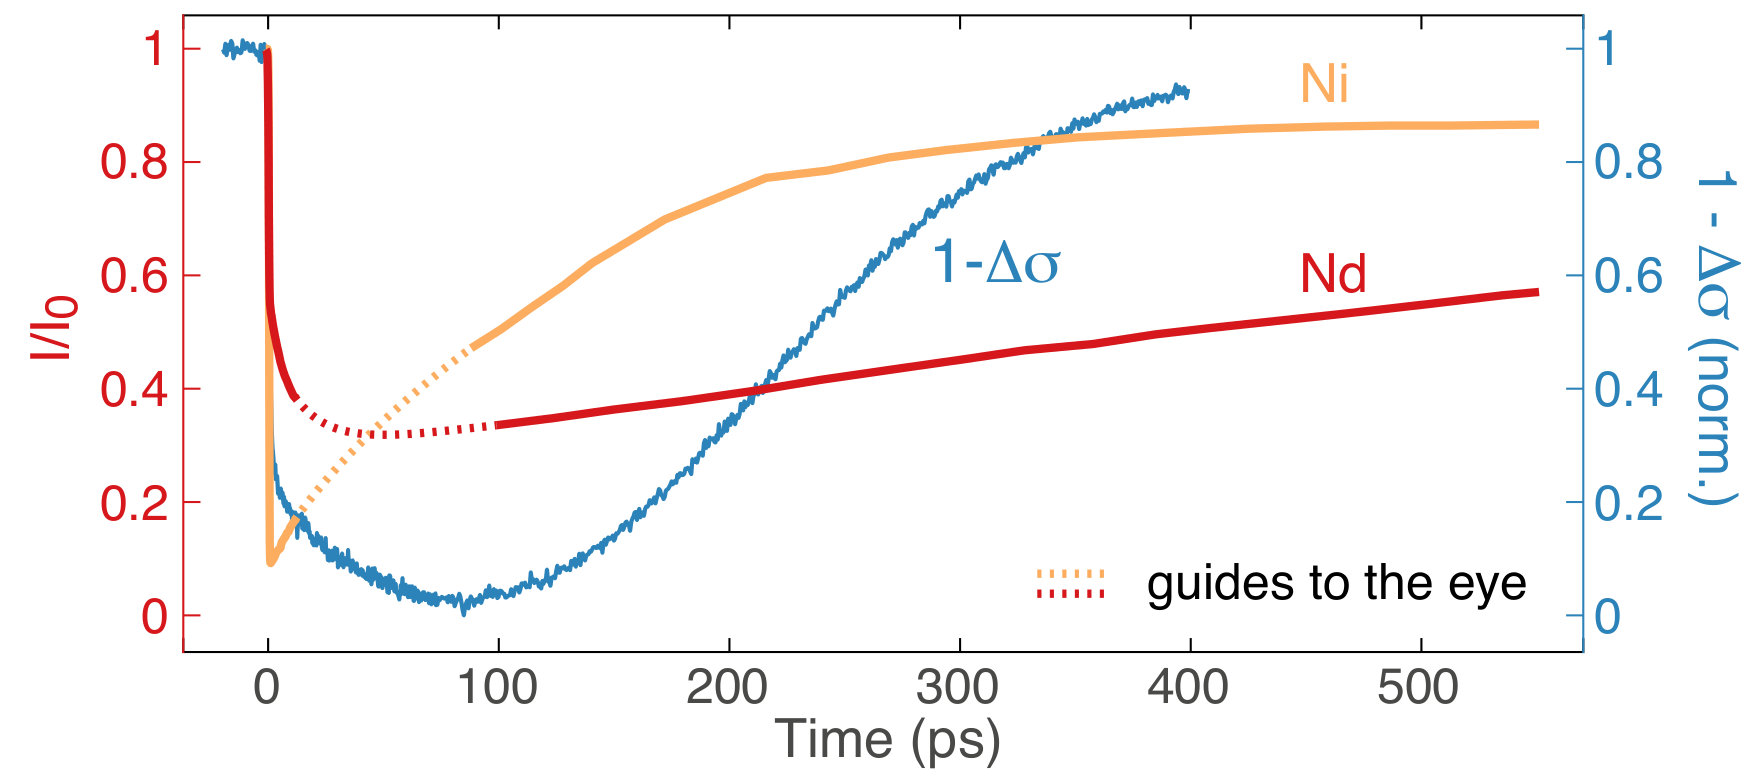 Figure 4
Peer Reviews
No public reviews on file for this paper yet. If you reviewed it on a platform where reviews are public (OpenReview, ICLR, NeurIPS, ICML), you can paste yours below so the community can read it here.
Videos
No videos yet. Explain this paper in a talk, walkthrough, or lecture? Add one.
Nucleation and growth bottleneck in the conductivity recovery dynamics of nickelate thin films
E. Abreu
Institute for Quantum Electronics, Department of Physics, ETH Zurich, 8093 Zurich, Switzerland
D. Meyers
Department of Materials Science and Engineering, University of California, Berkeley, CA 94720, USA
V. K. Thorsmølle
Department of Physics, Boston University, Boston, MA 02215, USA
Department of Physics, UC San Diego, La Jolla, CA 92093, USA
J. Zhang
Department of Physics, UC San Diego, La Jolla, CA 92093, USA
Department of Physics, The Hong Kong University of Science and Technology, Clear Water Bay, Kowloon, Hong Kong, China
X. Liu
Department of Physics and Astronomy, Rutgers University, Piscataway, NJ 08854, USA
K. Geng
Department of Physics, Boston University, Boston, MA 02215, USA
J. Chakhalian
Department of Physics and Astronomy, Rutgers University, Piscataway, NJ 08854, USA
R. D. Averitt
Department of Physics, UC San Diego, La Jolla, CA 92093, USA
Abstract
We investigate THz conductivity dynamics in NdNiO3 and EuNiO3 thin films following a photoinduced thermal quench into the metallic state and reveal a clear contrast between first- and second-order dynamics. While in EuNiO3 the conductivity recovers exponentially, in NdNiO3 the recovery is non-exponential and slower than a simple thermal model. Crucially, it is consistent with first-order dynamics and well-described by a 2d Avrami model, with supercooling leading to metastable phase coexistence. The large transients seen in our films are promising for fast electronic (and magnetic) switching applications.
Order parameter coupling is one of the hallmarks of transition metal oxides (TMOs), in which macroscopic properties arise from competition between microscopic interactions. The richness of the resultant phase diagrams Dagotto (2005) imbues these materials with extreme sensitivity to external perturbations which can be investigated using various time-resolved measurements Zhang and Averitt (2014). In particular, materials that exhibit insulator-to-metal transitions (IMTs) present an ongoing challenge, regarding both fundamental properties and photoinduced phase transitions Dobrosavljevic et al. . Photoinduced IMTs have been investigated in a host of TMOs, with vanadates (VO2 and V2O3) as canonical examples Cavalleri et al. (2001); Wegkamp et al. (2014); Morrison et al. (2014); Gray et al. (2018); Abreu et al. (2015); Singer et al. (2018). However, in order to better understand the fundamental aspects of photoinduced dynamics and the technological potential of IMTs in TMOs it is imperative to investigate materials with coupled charge, spin and structure orders.
Rare earth nickelates, RNiO3, are excellent candidates for this purpose. They exhibit a variety of electronic, magnetic and structural phases, accessible through changes in temperature and pressure, or by a variation of the tolerance factor of their characteristic distorted perovskite structure through a change of R Torrance et al. (1992). In particular, RNiO3 with smaller R radius, such as EuNiO3 (ENO), exhibit two distinct second-order transitions associated with magnetic ordering (at the Néel temperature, ) and an IMT (at ), whereas large R nickelates, such as NdNiO3 (NNO), undergo a single first-order transition between an antiferromagnetic insulator and a paramagnetic metal. This strongly suggests that a coupling exists between electronic and magnetic properties. The coupling is expected to be R dependent but its precise nature remains unclear, with an intriguing example being the recent observation of antiferromagnetic order in bulk metallic LaNiO3 Guo et al. (2018). The rich phase diagram of RNiO3 has remained somewhat unexplored due to challenges in bulk crystal growth Torrance et al. (1992). Thin epitaxial films and heterostructures arose as a convenient alternative, enabling the investigation of intrinsic nickelate properties while also opening up an entire new functional landscape through tuning of e.g. epitaxial strain and interfacial effects Catalan (2008); Boris et al. (2011); Liu et al. (2013); Middey et al. (2016).
In this work we investigate thin epitaxial films of NNO and ENO using optical pump - THz probe (OPTP) spectroscopy. In the NNO films K (compared to 200 K in bulk samples due to strain in the films) Torrance et al. (1992); Liu et al. (2013), while for the ENO films K (as in bulk) and K (100 K lower than in bulk) Meyers et al. (2013); Torrance et al. (1992). Our investigation of NNO and ENO enables a direct comparison of first- and second-order IMT conductivity dynamics. We note that previous time-resolved studies of the IMT in RNiO3 thin films focused on vibrational excitation of substrate phonon modes Caviglia et al. (2012); Först et al. (2015, 2017) or were performed indirectly using an optical probe Ruello et al. (2007); Esposito et al. (2018). Magnetic Caviglia et al. (2013); Först et al. (2015) and charge order dynamics Esposito et al. (2018) in photoexcited NNO films were also investigated, using time-resolved resonant soft x-ray diffraction. Our conductivity dynamics are initiated with above bandgap photoexcitation which induces a thermal quench from the insulating to the metallic state. Photoexcitation of NNO drives a prompt collapse ( ps) into the metallic state followed by an additional conductivity increase upon cooling within the metallic phase. Crucially, further cooling to below causes the conductivity to decrease exhibiting slowed down first-order dynamics, with supercooling leading to metastable phase coexistence and percolative recovery of the antiferromagnetic insulating state. ENO also exhibits a prompt increase of the conductivity but the recovery follows the simple exponential relaxation expected for a continuous IMT, in stark contrast to the novel first-order dynamics observed in NNO. Comparison of our results to the magnetic dynamics from Caviglia et al. Caviglia et al. (2013) suggests that the collapse of magnetic order tracks the conductivity, and that a strong coupling exists between the magnetic and electronic order.
Thin films of NNO and ENO (15 u.c., nm) were fabricated using layer-by-layer growth on [001]-oriented NdGaO3, leading to 1.4 and 1.5 tensile strain, respectively Liu et al. (2013); Meyers et al. (2013). For the transient conductivity measurements we used 50 fs 1.55 eV pulses from a 3 mJ Ti:Sapphire amplified laser operating at 1 kHz. THz probe pulses peaked at THz were generated by optical rectification and detected by electro-optic sampling in 1 mm thick ZnTe crystals. The pump and probe beams impinged on the sample at approximately normal incidence, with a pump focal spot size of mm diameter FWHM, significantly larger than the probe. The penetration depth of the pump and probe beams are both much larger than the film thickness.
We begin with our results on NNO. First, we performed temperature dependent THz time domain spectroscopy measurements of the NNO film without photoexcitation. The THz conductivity, , is shown in Fig. 1(a), which effectively corresponds to the d.c. conductivity since the carrier scattering frequency lies beyond the measured spectral range (0.1 - 2.5 THz). The IMT occurs at K, accompanied by hysteresis. This is consistent with the first-order nature of the transition and reveals a K range of phase coexistence (shaded region in Fig. 1(a)). The maximum conductivity, obtained around , is ( cm)-1, comparable to bulk values Torrance et al. (1992). For higher temperatures the conductivity decreases significantly with increasing temperature.
Next, we use OPTP spectroscopy to measure the conductivity changes () arising from dynamic spectral weight transfer following excitation at 1.55 eV. is plotted in Figs. 1(b) - 1(d) for initial temperatures of 77 - 123 K, and incident pump fluences 0.25 - 2.5 mJ/cm2. For all fluences there is a fast initial rise of the conductivity, 1 ps, that occurs on the timescale of electron phonon (e-ph) thermalization. The evolution after this photoinduced thermal quench depends strongly on and , which determine the proximity of the final temperature (immediately after e-ph thermalization) to . Figure 1(b) shows the dynamics for 77 K over a range of fluences. For 0.5 mJ/cm2, is ( cm)-1 at 1 ps, with a subsequent decrease and a slight shoulder at ps (marked with a green dot). This last feature becomes much clearer for 1 - 2.5 mJ/cm2. For these higher fluences the thermal quench () is well above , with the initial increase at 1 ps reaching ( cm)-1. A subsequent second rise in the conductivity peaks at later times with increasing fluence, as indicated with the green dot on each trace sup . Finally, there is a non-exponential recovery, with a decay time that increases with fluence. This deviation from a simple exponential recovery suggests the onset of first-order dynamics, as discussed in detail below. With decreasing fluence the dynamics evolve towards an exponential recovery, as shown in Figs. 1(c) - 1(d). Indeed, at mJ/cm2 (Fig. 1(d)) there is a two-exponent decay of , with a fast component, ps, and a longer decay time that increases as approaches .
Further insight into the dynamics in NNO can be obtained by fitting the data in Figs. 1(b) - 1(d) to:
[TABLE]
where and correspond to the initial ultrafast conductivity increase. At low and (Fig. 1(d)), and are the decay time and amplitude of the fast conductivity decrease while and (0) correspond to the slow decrease. For large and (Fig. 1(b)), and (0) are the rise time and amplitude of the second slow conductivity increase. Note that for 0.5 mJ/cm2 (Fig. 1(c)) there is still a small recovery component, absent for higher fluences. The term in corresponds to the non-exponential conductivity recovery, which has an associated delay, , discussed below. Finally, accounts for a small and long lived ( ns) decay component arising from the final stage of heat transfer to the NdGaO3 substrate.
Fits to Eq. 1 are superimposed onto the data in Figs. 1(b) - 1(d) sup . Fitted values for are on the order of the ps time resolution of our THz probe which limits the determination of exact rise times. We note that there is no finite fluence threshold for the onset of the dynamics since is nonzero for all fluences. Notably, we observe a change close to ( cm)-1, occurring in ps in a 5.7 nm thick film. Such a conductivity transient is significantly larger and faster than those observed in other IMT materials, such as VO2 and V2O3 Abreu et al. (2017); Hilton et al. (2007). These fast dynamics correspond to the thermal quench, which sets the stage for the subsequent dynamics shown in Figs. 1(b) - 1(d). As such, to understand the dynamics beyond it is important to estimate the final temperature , the peak temperature obtained in the sample before it cools down as heat transfers to the substrate, as a function of and .
can be estimated sup from , the specific heat Barbeta et al. (2010) and the deposited energy density at a given Stewart et al. (2011). Results are shown in Fig. 2 as an intensity map of vs. and . Importantly, calculated values shown in Fig. 2 agree well with the values obtained by comparing with the static curve (Fig. 1(a)). The colored points in Fig. 2 correspond to determined for the data in Figs. 1(b) - 1(d) (the vertical row of points at 40 K are estimated from Caviglia et al. Caviglia et al. (2013)). Two regions can be clearly identified, corresponding roughly to the weak thermal quench region () and the strong quench region (). Red triangles label the strong quench region, where dynamics subsequent to the quench exhibit a conductivity increase followed by non-exponential relaxation (Fig. 1(b), 0.5 mJ/cm2). The weak quench region for which there is no slow rise of conductivity (Figs. 1(c) - 1(d)) is labeled with blue symbols, with further refinement to indicate the onset of non-exponential decay (blue squares) versus a simple two-exponent decay (blue pyramids). The results of Figs. 1(b) - 1(d) and Fig. 2 reveal that the IMT dynamics strongly depend on the magnitude of the quench.
Next, we turn to the IMT dynamics of ENO (Fig. 1(e)), as an interesting point of comparison to NNO. The static (inset of Fig. 1(e)) yields K and exhibits no clear hysteresis. in ENO is measured for 1 - 3 mJ/cm2 (Fig. 1(e) shows mJ/cm2) and 120 - 330 K, both below and above K. For all values the dynamics show a fast rise and a two-exponent decay (as observed for NNO in the low fluence range, Fig. 1(d), where the weak thermal quench is not sufficient to stabilize the metallic phase). No slow conductivity rise or non-exponential recovery dynamics is observed for any of the and combinations. This is true even for K, at the onset of the static IMT, where photoexcitation places ENO well into the IMT region. in ENO therefore does not exhibit any features suggestive of first-order dynamics, which is consistent with the lack of hysteresis in (Fig. 1(e)) and d.c. transport Meyers et al. (2013) measurements. The conductivity dynamics are purely thermal with the decrease tracking the film temperature as cooling proceeds via heat transfer to the substrate. The contrast between ENO and NNO further suggests that the high fluence results for NNO in Fig. 1(b) arise from strong first-order dynamics.
We now focus on the NNO post quench dynamics when is well above , corresponding to the data in Fig. 1(b) for 0.5 mJ/cm2. In Fig. 3(a), we label as step 1 the initial ultrafast increase of , corresponding to carrier excitation and heating dynamics that quenches the system to . The second increase in , on a timescale, arises from cooling via heat escape from the ultrathin film (step 2) and is consistent with the negative slope of for . For the transient conductivity reaches the maximum metallic conductivity (, top panel of Fig. 3(a)), such as for the 1.5 mJ/cm2 dynamics plotted in Fig. 3(d) (red). At lower , though still above , increases but follows a modified hysteresis loop that never reaches (dashed loop in the top panel of Fig. 3(a) and 1 mJ/cm2 trace in Fig. 3(d) (blue)).
Importantly, the metallic state conductivity dynamics persist until (see Eq. 1), when is finally reached. Up to this point the dynamics are purely thermal. As such, the sample temperature can be estimated by converting the transient conductivity increase between the fast rise and to a transient temperature decrease using the static data of Fig. 1(a) sup . In this procedure we use the and values obtained from the fits to Eq. 1. The sample temperature decrease dynamics and decay times are shown in Figs. 3(b) and 3(c), with error bars estimated from the fitting errors of . The cooling rate is on the order of 1 K/ps (though it slows down with time given the exponential evolution) and cooling continues unabated below . Thus, beyond the sample is supercooled into the coexistence region, initiating non-equilibrium first-order phase transition dynamics.
As determined from the fit of the data in Fig. 1(b) to Eq. 1, the conductivity recovery dynamics of NNO are non-exponential. Indeed, these dynamics are well described by a 2d Avrami model, characterized by a stretched exponential with an exponent of 2, as expected from quickly exhausted nucleation and 2d ballistic growth in thin films Abreu et al. (2015); sup . Using the sample temperature determined in Fig. 3(b) we can determine how the conductivity dynamics would proceed for a purely thermal relaxation. This is plotted as solid lines in Fig. 3(d), revealing a clear discrepancy after (shaded regions). Crucially, the slow conductivity recovery is due to the growth of the initial insulating phase at the expense of the supercooled metallic regions, which hinders the recovery in comparison to a homogeneous thermal process.
Interestingly, appears to connect with the ultrafast magnetization dynamics. Ultrafast resonant soft x-ray diffraction experiments by Caviglia et al. Caviglia et al. (2013) have characterized the response of Ni3+ and Nd3+ magnetic moments, following photoexcitation at 800 nm, for a thicker 100 u.c. NNO film for which K. Two regions are reported as a function of fluence (crosses in Fig. 2), matching the ones we identify here for . This is the first indication provided by our comparison of a relationship between electronic and magnetic order during the IMT in NNO. As a side note, the charge order dynamics reported by Esposito et al. Esposito et al. (2018) exhibit only one region corresponding to photoexcitation into the strong thermal quench region ().
A closer comparison between magnetic and conductivity dynamics is shown in Fig. 4 for . The recovery of both the magnetic order of the Nd3+ ions () and is quite slow, contrary to , the magnetic order of Ni3+ ions. Indeed, it is clear that the slow increase in conductivity ( decay) is accompanied by a decrease in . , on the other hand, exhibits a prompt two-exponent recovery, similar to for . These qualitative conclusions are clear despite differences in the samples and in and , and attest to a strong coupling between the electronic and magnetic order of Nd3+ in NNO. Ultrafast magnetic order studies in smaller R systems such as ENO can reveal whether first-order signatures are observed in the magnetic dynamics of R**3+ close to or , though absent in . Such measurements can complement our conductivity dynamics study and help establish whether the role of in NiO3 might go beyond the pure steric effect of modifying the perovskite tolerance factor.
In order to characterize the contribution of magnetic and electronic effects during the magnetic and IM transitions in RNiO3, theoretical modeling is obviously required. Previous models were built upon the assumption that charge or bond length disproportionation occur for Mazin et al. (2007); Giovannetti et al. (2009); Lau and Millis (2013); Park et al. (2014), motivated by the charge order and structural transitions observed in the insulating phase of bulk Alonso et al. (2000); Zaghrioui et al. (2001) or bulk-like Staub et al. (2002) RNiO3 systems. Such models are able to reproduce one subset of the phases exhibited by bulk RNiO3. Our results support a direction of theoretical investigation that further examines the coupling between magnetic and electronic properties across the IMT Lee et al. (2011). It is important to keep in mind that strained ultrathin films differ from bulk; while retaining the characteristic interactions of the system they also pose new experimental and theoretical challenges Middey et al. (2016).
In summary, we report on the observation of a first-order conductivity recovery in supercooled NNO following photoexcitation above , due to nucleation and growth of the insulating phase which is well described by a 2d Avrami model. This novel observation is a fundamentally dynamic manifestation of the first order character of the IMT, which the reduced thickness of our films and their fast cooling rate uniquely enable us to detect. In contrast, the conductivity recovery in ENO follows a purely thermal exponential behavior and exhibits no first-order signatures. Our analysis emphasizes the critical importance of the coupling between electronic and magnetic degrees of freedom during the IMT in RNiO3. Furthermore, our work highlights the relevance of RNiO3 ultrathin films, not only for fundamental studies but also from a technological point of view (NNO exhibits a conductivity increase within ps), in ultrafast electronic and magnetic switching applications for which a performance better than that of other TMOs is expected.
E.A., J.Z. and R.D.A. acknowledge support from the DOE - Basic Energy Sciences under Grants DE-FG02-09ER46643 and DE-SC0012375. E.A. acknowledges support from the Fundação para a Ciência e a Tecnologia, Portugal, through doctoral degree fellowship SFRH/ BD/ 47847/ 2008. D.M. was supported by the Gordon and Betty Moore Foundation’s EPiQS initiative under Grant No. GBMF5307. X.L. was supported by the DOE under Grant DE-SC0012375. J.C. was supported by the Gordon and Betty Moore Foundation’s EPiQS initiative through Grant No. GBMF4534.
The reference list from the paper itself. Each links out to its DOI / PubMed record.
- 1Dagotto (2005) E. Dagotto, Science 309 , 257 (2005) , 0509041 . · doi ↗
- 2Zhang and Averitt (2014) J. Zhang and R. D. Averitt, Annual Review of Materials Research 44 , 19 (2014) . · doi ↗
- 3(3) V. Dobrosavljevic, N. Trivedi, and J. M. Valles, Jr., eds., Conductor-Insulator Quantum Phase Transitions .
- 4Cavalleri et al. (2001) A. Cavalleri, C. Tóth, C. W. Siders, J. A. Squier, F. Ráksi, P. Forget, and J. C. Kieffer, Physical Review Letters 87 , 237401 (2001) . · doi ↗
- 5Wegkamp et al. (2014) D. Wegkamp, M. Herzog, L. Xian, M. Gatti, P. Cudazzo, C. L. Mc Gahan, R. E. Marvel, R. F. Haglund, A. Rubio, M. Wolf, and J. Stähler, Physical Review Letters 113 , 216401 (2014) . · doi ↗
- 6Morrison et al. (2014) V. R. Morrison, R. P. Chatelain, K. L. Tiwari, A. Hendaoui, A. Bruháes, M. Chaker, and B. J. Siwick, Science 346 , 445 (2014) . · doi ↗
- 7Gray et al. (2018) A. X. Gray, M. C. Hoffmann, J. Jeong, N. P. Aetukuri, D. Zhu, H. Y. Hwang, N. C. Brandt, H. Wen, A. J. Sternbach, S. Bonetti, A. H. Reid, R. Kukreja, C. E. Graves, T. Wang, P. W. Granitzka, Z. Chen, D. J. Higley, T. Chase, E. Jal, E. Abreu, M. Liu, T.-C. Weng, D. Sokaras, D. Nordlund, M. Chollet, H. T. Lemke, J. Glownia, M. Trigo, Y. Zhu, H. Ohldag, J. W. Freeland, M. G. Samant, J. Berakdar, R. D. Averitt, K. A. Nelson, S. S. P. Parkin, and H. A. Dürr, Physical Review B
- 8Abreu et al. (2015) E. Abreu, S. Wang, J. G. Ramírez, M. Liu, J. Zhang, K. Geng, I. K. Schuller, and R. D. Averitt, Physical Review B 92 , 085130 (2015) . · doi ↗