Measuring the temperature and heating rate of a single ion by imaging
Bharath Srivathsan, Martin Fischer, Lucas Alber, Markus Weber, Markus, Sondermann, Gerd Leuchs

TL;DR
This paper introduces an imaging-based method to measure the temperature and heating rate of a single ion in a trap, allowing continuous monitoring without disrupting the cooling process.
Contribution
The novel technique enables simultaneous measurement of ion temperature and heating rate while maintaining the ion in thermal equilibrium, unlike previous methods.
Findings
Accurately determines ion temperature from spatial extent measurements.
Measures anomalous heating rate without switching off cooling.
Maintains the ion near the Doppler limit during measurements.
Abstract
We present a technique based on high resolution imaging to measure the absolute temperature and the heating rate of a single ion trapped at the focus of a deep parabolic mirror. We collect the fluorescence light scattered by the ion during laser cooling and image it onto a camera. Accounting for the size of the point-spread function and the magnification of the imaging system, we determine the spatial extent of the ion, from which we infer the mean phonon occupation number in the trap. Repeating such measurements and varying the power or the detuning of the cooling laser, we determine the anomalous heating rate. In contrast to other established schemes for measuring the heating rate, one does not have to switch off the cooling but the ion is always maintained in a state of thermal equilibrium at temperatures close to the Doppler limit.
Click any figure to enlarge with its caption.
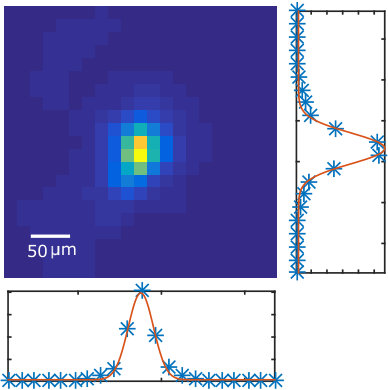 Figure 1
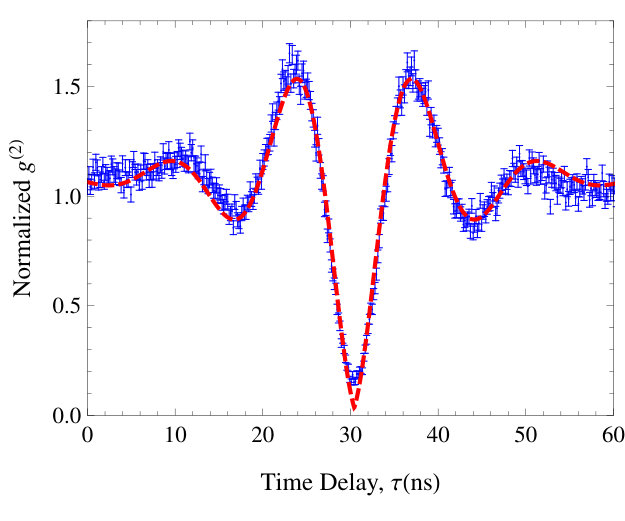 Figure 2
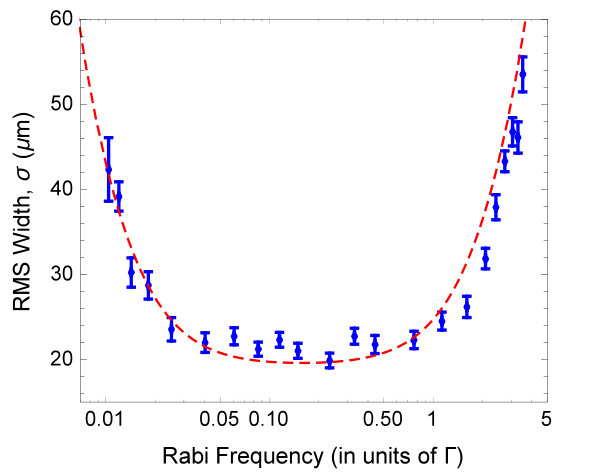 Figure 3
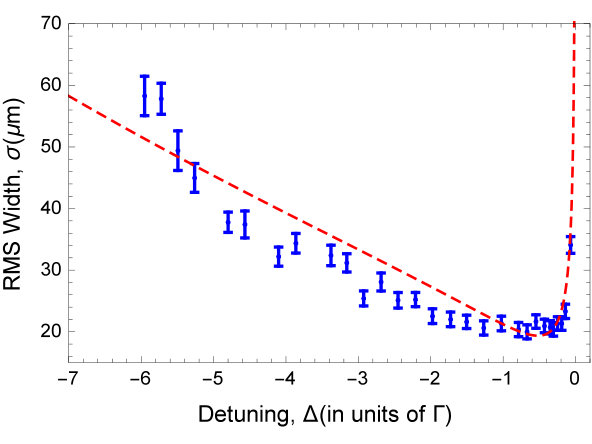 Figure 4
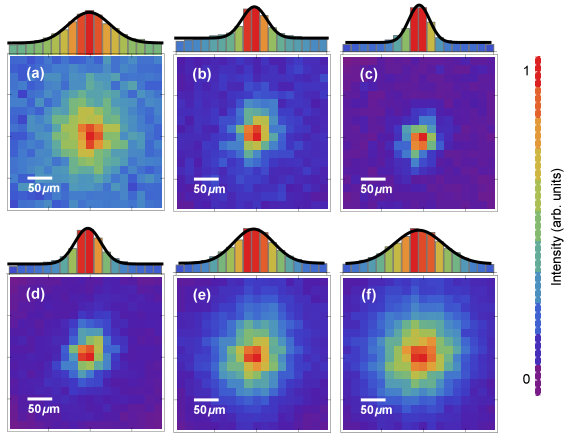 Figure 5
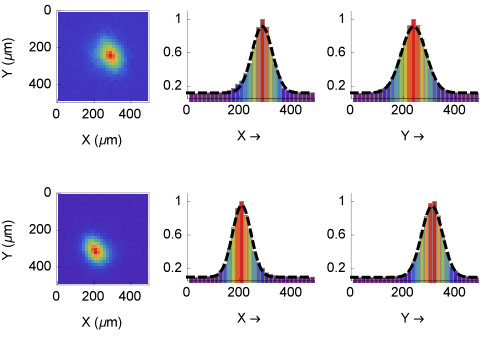 Figure 6
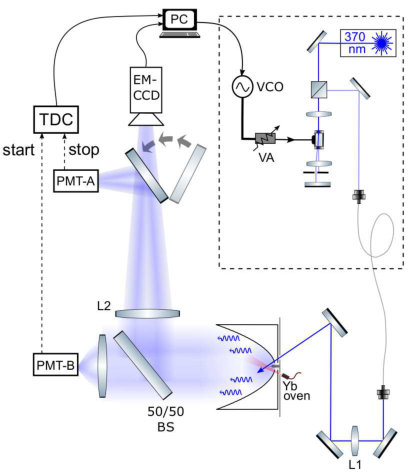 Figure 7
Peer Reviews
No public reviews on file for this paper yet. If you reviewed it on a platform where reviews are public (OpenReview, ICLR, NeurIPS, ICML), you can paste yours below so the community can read it here.
Videos
No videos yet. Explain this paper in a talk, walkthrough, or lecture? Add one.
Measuring the temperature and heating rate of a single ion by imaging
Bharath Srivathsan
Friedrich-Alexander-Universität Erlangen-Nürnberg (FAU), Department of Physics, Staudtstr. 7/B2, 91058 Erlangen, Germany
Max Planck Institute for the Science of Light, Staudtstr. 2, 91058 Erlangen, Germany
Centre for Cold Matter, Blackett Laboratory, Imperial College London, Prince Consort Road, London SW7 2AZ, United Kingdom
Martin Fischer
Friedrich-Alexander-Universität Erlangen-Nürnberg (FAU), Department of Physics, Staudtstr. 7/B2, 91058 Erlangen, Germany
Max Planck Institute for the Science of Light, Staudtstr. 2, 91058 Erlangen, Germany
Lucas Alber
Friedrich-Alexander-Universität Erlangen-Nürnberg (FAU), Department of Physics, Staudtstr. 7/B2, 91058 Erlangen, Germany
Max Planck Institute for the Science of Light, Staudtstr. 2, 91058 Erlangen, Germany
Markus Weber
Friedrich-Alexander-Universität Erlangen-Nürnberg (FAU), Department of Physics, Staudtstr. 7/B2, 91058 Erlangen, Germany
Max Planck Institute for the Science of Light, Staudtstr. 2, 91058 Erlangen, Germany
Markus Sondermann
Friedrich-Alexander-Universität Erlangen-Nürnberg (FAU), Department of Physics, Staudtstr. 7/B2, 91058 Erlangen, Germany
Max Planck Institute for the Science of Light, Staudtstr. 2, 91058 Erlangen, Germany
Gerd Leuchs
Friedrich-Alexander-Universität Erlangen-Nürnberg (FAU), Department of Physics, Staudtstr. 7/B2, 91058 Erlangen, Germany
Max Planck Institute for the Science of Light, Staudtstr. 2, 91058 Erlangen, Germany
Department of Physics, University of Ottawa, Ottawa, Ont. K1N 6N5, Canada
Abstract
We present a technique based on high resolution imaging to measure the absolute temperature and the heating rate of a single ion trapped at the focus of a deep parabolic mirror. We collect the fluorescence light scattered by the ion during laser cooling and image it onto a camera. Accounting for the size of the point-spread function and the magnification of the imaging system, we determine the spatial extent of the ion, from which we infer the mean phonon occupation number in the trap. Repeating such measurements and varying the power or the detuning of the cooling laser, we determine the anomalous heating rate. In contrast to other established schemes for measuring the heating rate, one does not have to switch off the cooling but the ion is always maintained in a state of thermal equilibrium at temperatures close to the Doppler limit.
I Introduction
In many atomic physics and quantum optics experiments, the temperature of the atoms under investigation plays a critical role Gibble and Chu (1993); Ludlow et al. (2015); Cronin et al. (2009); Bloch et al. (2008); Häffner et al. (2008); Saffman et al. (2010). From fundamental tests to quantum information applications, cooling the atoms to ultra-low temperatures has become a prerequisite. To this end, laser cooling and trapping of atoms has become an indispensable tool in many labs. Furthermore, measuring the temperature of the cold atoms becomes important, for instance to understand the physics of the cooling mechanism, or to disclose additional sources of heating and thermal decoherence in the experiment. Depending on the type of the trapping and cooling method employed, several thermometry techniques have been developed.
In the case of trapped ions, the most common way to determine the temperature is to measure the sideband absorption spectrum Diedrich et al. (1989); Roos et al. (1999). This technique requires the ion to be cooled close to the motional ground state of the trap, and therefore is used in combination with ground state cooling schemes such as Raman side-band cooling Monroe et al. (1995) or cooling employing electromagnetically induced transparency Roos et al. (2000). Outside the resolved sideband regime, various techniques exist. One way is to measure the Doppler broadening of the atomic transition due to the motion of the ion Wineland and Itano (1979, 1981). The accuracy of this approach relies on the ability to distinguish the Lorentzian spectrum of an atomic transition from the Gaussian spectrum. The Doppler broadening at sub-mK temperatures is small compared to the natural linewidth of the typically used transitions. Therefore, the statistical uncertainties in data evaluation prevent an accurate determination of the temperature close to the Doppler limit. Particularly, in the Lamb-Dicke Regime the first order Doppler effect is suppressed, and only the higher order Doppler shifts that are much weaker can be observed Dicke (1953); Itano et al. (1988).
In order to enable fast and accurate determination of the temperature of a trapped ion at mK temperatures, thermometry by imaging the spatial extent of an ion has been demonstrated Norton et al. (2011); Knünz et al. (2012). The accuracy of this method was limited only by the imaging resolution and the images’ signal-to-noise ratio. In this article, we present the thermometry measurement of a single ion by imaging via a deep parabolic mirror. Our improved resolution and high collection efficiency Maiwald et al. (2012) allows us to determine the absolute temperature close to the Doppler limit more accurately in comparison to previous demonstrations of this technique. Furthermore, it opens up the possibility to measure temperatures below the Doppler limit, which has until now been possible only by the resolved sideband method or by similarly involved methods such as the one based on interference of fluorescence photons Slodička et al. (2012).
In addition to the absolute temperature, the heating rate is another important figure of merit in thermometry of trapped ions Deslauriers et al. (2006); Brownnutt et al. (2015). In the resolved sideband regime, sideband themometry is generally employed to measure the heating rate. Outside this regime, the heating rate is traditonally measured from the time-resolved fluorescence rate of the ion during the Doppler cooling process Epstein et al. (2007). A similar technique combining the imaging approach and the time-resolved scattering method to determine the heating rate was recently demonstrated Boldin et al. (2018). Both these techniques involve heating up the ion to temperatures at-least a few orders of magnitude above the Doppler limit, and therefore depend on several simplifying assumptions about the system. We present an alternative way to determine the heating rate of a single ion employing the imaging approach while varying the cooling laser power or its detuning. The advantage of our technique is that for every measurement point the ion is maintained in a state of thermal equilibriumduring the entire measurement sequence.
II Theory
The temperature of an ion in an harmonic trap under weak confinement conditions can be approximated as , where is the average excitation number of the harmonic oscillator, is the trap frequency and is the Boltzmann constant Knünz et al. (2012). in turn is related to the RMS spread of the ion in position space as
[TABLE]
where is mass of the ion. In the experiment, we measure by imaging the ion, and thereby determine and .
In order to determine the heating rate induced by external factors, we use a simple model of laser cooling Leibfried et al. (2003) which neglects additional heating or cooling due to micromotion. Since micromotion is well compensated in our experiment, this model is well suited to describe the cooling process. Cooling as well as heating induced by interaction of the ion with the cooling light is governed by scattering of photons from the near-resonant cooling beam. The steady state scattering rate of these photons is given by , where is the spontaneous emission rate of the cooling transition and is the steady state excitation of the ion. is the detuning of the laser from the atomic resonance and is the Rabi frequency. Particles confined in harmonic traps can have anisotropic temperature, depending on the angle made by the cooling beam with the trap axes Norton et al. (2011). To include this effect in our model, we define an effective k-vector, , where is the angle made by the cooling laser with a trap axis. The cooling rate along the chosen trap axis is given by
[TABLE]
The heating rate during the final stages of Doppler cooling can be approximated as
[TABLE]
The first term in the brackets corresponds to the momentum change along the trap axis due to absorption of a photon, while the second term corresponds to the momentum change due to spontaneous emission along this direction. is a geometry factor that originates from the spatial emission characteristics of the scattered photons. In our experiment, we use a transition with a nearly isotropic emission pattern. Therefore, we use a geometry factor of . In addition, we use a constant factor to include anamalous heating in the model.
The equilibrium temperature is reached when the heating and cooling rates are equal: . Below, we will measure while either varying or . In both cases, we will obtain by fitting our model to the experimental data.
III Experiment
The schematic of our experimental setup is shown in Figure 1. We trap a single 174Yb+ ion in the focal region of a deep parabolic mirror using a stylus like ion trap Maiwald et al. (2009). The trap is mounted on a XYZ piezo translation stage (PIHera P-622K058) with a positioning accuracy of about 1 nm. With the aid of the piezo stage, the ion can be positioned and scanned in all three directions around the focal point of the mirror. A 370 nm frequency doubled diode laser (Toptica) is used for Doppler cooling the ion. The detuning of the laser is tuned by using a 200 MHz Accusto-Optic-Modulator (AOM), aligned in “double-pass” configuration, and driven by the amplified signal of a Voltage Controlled Oscillator (VCO). The frequency shifted beam is coupled into a polarization maintaining single mode optical fiber, and focused onto the ion using a 400 mm focal length lens (L1). The optical power of the cooling beam can be tuned by varying the RF power supplied to the AOM using a Variable attenuator (VA). The parabolic mirror (focal length of 2.1 mm) collimates the fluorescence light scattered by the ion, and acts as an objective for our imaging system. A 300 mm focal-length lens (L2) along with a one-to-one telescope using lenses of focal length 50 mm (not shown in Fig. 1) is used to image the ion on an electron-multiplying charge-coupled device (EM-CCD) camera. A flip mirror (FM) directs the fluorescence photons instead to a Photo-Multiplier-Tube (PMT-A). The trap frequencies were measured to be 205 kHz and 196 kHz in the lateral directions (X and Y), and 390 kHz in the axial direction (Z) by applying AC fields to one of the trap electrodes. The cooling beam has an angle, of 71*∘* with both the lateral trap axes.
As introduced above, we measure the temperature of the ion by determining the width of the image recorded on the EM-CCD camera. Due to the geometry of the trap electrodes (cf. Ref. Maiwald et al. (2012)), the lateral trap axes make an angle of 45*∘* with respect to the edges of the pixel array of the camera. Therefore, we rotate the images by nearest neighbor interpolation to make the the pixel array axis coincide with the trap axis 111 We use MATLAB imrotate function to rotate the images. For simplicity, we restrict the discussion to one spatial dimension.
First, we project the image onto the horizontal direction by summing over all pixels in each column. We then determine the RMS image width from this projection by using a 1D Gaussian fit. The image recorded on the camera is a convolution of the imaging point-spread function (PSF) and the “true image” of the ion. Assuming both the PSF and the true image to be Gaussian spots, the width of the recorded image can be approximated as
[TABLE]
In order to determine the temperature of the ion, we need to extract from the measured . For this process the magnification of the imaging system as well as the width of the imaging PSF need to be known. is measured by moving the ion in lateral directions, and measuring the image shift on the camera as outlined in App. A, yielding . We use as a free parameter in the fitting procedure discussed below.
Several example images acquired at different Rabi frequencies are shown in Fig. 2. The Rabi frequency is obtained by one calibration measurement at fixed power (see App. C). All other values of are then calculated from the power of the cooling laser and the power used in the calibration measurement. As expected, the width of the images in Fig. 2 varies with the Rabi frequency .
We now turn to the determination of the heating rate . We fit our model to a set of image widths by varying either at fixed or vice versa. The free fit parameters are and . The result of the measurement and the fit for varying at a fixed detuning are shown in Figure 3. The increase of the image width and thus the ion temperature at very small Rabi frequencies indicates a non-zero excess heating. The corresponding heating rate as determined from the fit is 0.380.07 quanta/ms. The width of the imaging PSF is = 6.62.7,m, which is in good agreement with the expected PSF of determined from the simulations including the interferometrically measured aberrations of our parabolic mirror Leuchs et al. (2008) (see App. B). The average phonon number and thus the temperature of the ion for any can now be determined using these parameters.
The lowest measured is 0.1660.013 m, for a Rabi frequency of = 0.23 . This corresponds to a mean phonon occupation number of 97 15, and a temperature of 950147 K. In the Doppler limit, the temperature according to is expected to be about . Thus, the temperature of the ion is found to be about twice this Doppler limit, mainly due to a large angle between the cooling beam and the trap axis.
It can be seen that for the measured temperatures, the contribution of the PSF () to the measured image width () is much smaller than the contribution from spatial extent of the ion wavefunction (). Hence, this method can be used for measuring even lower temperatures. From the standard error estimates of and , we estimate the minimum measurable temperature with a 50% relative error to be 222 This estimate is an absolute lower limit for our experimental parameters, assuming that the poissonian noise in image acquisition is negligible compared to uncertainities of PSF and magnification estimates., which is well below the standard Doppler limit.
An alternative way to measure the heating rate of the ion is to measure when varying the detuning . We fix the cooling beam power such that = 0.2 . The detuning is varied by using the VCO, and the image width is measured as a function of the detuning. The result is shown in figure 4. From a fit we extract a heating rate of quanta/ms, which is in fair agreement with the previous measurement.
IV Conclusion
We have demonstrated a technique to measure the absolute temperature of a single ion and its heating rate by measuring its spatial probability distribution in the trap. The high resolution image of the ion obtained by using our parabolic mirror as imaging tool allows us to measure temperature close to the Doppler limit, indicating the potential to perform thermometry below the Doppler limit. We have also measured the heating rate in our trap, while the ion is constantly maintained in a thermal equilibrium. Therefore, this technique might be useful for traps exhibiting high anharmonicity or temperature dependent heating rates.
Acknowledgments
G.L. acknowledges financial support from the European Research Council (ERC) via the Advanced Grant ’PACART’.
Appendix A Magnification Calibration
To calibrate the magnification of the imaging system, we move the ion in the lateral direction using the piezo stage, and record the images on the camera as shown in figure 5. By comparing the image shift to the object (ion) displacement, we determine the magnification of our imaging system to be in the horizontal direction, and in the vertical direction. The magnification along the trap axes is .
Appendix B Imaging PSF
We simulate intensity distribution of a radially polarized doughnut mode focused by our parabolic mirror, include the interferometrically measured aberrations by a generalization of the method presented in Richards and Wolf (1959). We obtain a FWHM width of the intensity distribution of for our wavelength. Including the magnification of our imaging system, this translates to an expected PSF m at the EMCCD camera.
Although also extractable from the fits presented in Sec. III, we give an independent estimate of the size of the PSF of our imaging system as a consistency check. We generate a collimated radially polarized doughnut beam at the wavelength of the transition at 370 nm wavelength as described e.g. in Ref. Alber et al. (2017). This mode is focused by the parabolic mirror. The rediverging beam is collimated again by the paraboloid and also imaged onto the EM-CCD camera. It thus passes the same optical elements as the fluorescence photons detected during the temperature measurements. The RMS width of the image on the EM-CCD chip is determined by 1D Gaussian fits as shown in Figure 6, yielding a width of and for the horizontal and vertical direction, respectively.
The extracted from these measurements is also influenced by residual aberrations stemming from the optical elements used for preparing the doughnut beam. Moreover, this beam is reflected twice at the surface of the parabolic mirror. Thus, aberrations due to a non-perfect parabolic shape of the mirror Alber et al. (2017); Leuchs et al. (2008) are imprinted twice onto this beam. The phase front of the fluorescence photons emitted by the ion carries these aberrations only once. Furthermore, the spatial mode of the laser used in that measurement is not the same as the average spatial emission pattern of a 174Yb+ ion emitting photons on the transition. After collimation by the parabolic mirror, the intensity pattern of the ion’s fluorescence is of Lorentzian shape Maiwald et al. (2009). Therefore, the width of the PSF obtained in this measurement can be considered as an upper bound for in the temperature measurements.
Appendix C Determination of the Rabi frequency
In order to determine the temperature of the ion from the image size, it is essential to precisely measure the on-resonance Rabi frequency . We measure the effective Rabi frequency by performing a Hanbury-Brown-Twiss type experiment on the fluorescence photons. The detuning of the cooling beam is fixed at . The power of the cooling beam, as measured by a power meter (Ophir Nova II), is fixed at a calibration value of P = 50 W. This value is chosen such that , which makes it possible to observe Rabi oscillations in measurement within the decay time. The on-resonance Rabi frequency is then determined from and , .
The fluorescent light from the ion is split using a 50/50 beam splitter, and detected using two Photo-Multiplier Tubes PMT-A and PMT-B. A Time-to-Digital Converter (TDC) is used to measure a Start - Stop correlation histogram between the PMT clicks, with a timing resolution of 161 ps. The normalized correlation function () shown in Figure 7 oscillates with a period that corresponds to the Rabi frequency. Since , for subsequent measurements we determine by measuring the the cooling beam power .
The reference list from the paper itself. Each links out to its DOI / PubMed record.
- 1Gibble and Chu (1993) K. Gibble and S. Chu, Phys. Rev. Lett. 70 , 1771 (1993), URL https://link.aps.org/doi/10.1103/Phys Rev Lett.70.1771 .
- 2Ludlow et al. (2015) A. D. Ludlow, M. M. Boyd, J. Ye, E. Peik, and P. O. Schmidt, Rev. Mod. Phys. 87 , 637 (2015), URL https://link.aps.org/doi/10.1103/Rev Mod Phys.87.637 .
- 3Cronin et al. (2009) A. D. Cronin, J. Schmiedmayer, and D. E. Pritchard, Rev. Mod. Phys. 81 , 1051 (2009), URL https://link.aps.org/doi/10.1103/Rev Mod Phys.81.1051 .
- 4Bloch et al. (2008) I. Bloch, J. Dalibard, and W. Zwerger, Rev. Mod. Phys. 80 , 885 (2008), URL https://link.aps.org/doi/10.1103/Rev Mod Phys.80.885 .
- 5Häffner et al. (2008) H. Häffner, C. Roos, and R. Blatt, Physics Reports 469 , 155 (2008), ISSN 0370-1573, URL http://www.sciencedirect.com/science/article/pii/S 0370157308003463 .
- 6Saffman et al. (2010) M. Saffman, T. G. Walker, and K. Mølmer, Rev. Mod. Phys. 82 , 2313 (2010), URL https://link.aps.org/doi/10.1103/Rev Mod Phys.82.2313 .
- 7Diedrich et al. (1989) F. Diedrich, J. C. Bergquist, W. M. Itano, and D. J. Wineland, Phys. Rev. Lett. 62 , 403 (1989), URL https://link.aps.org/doi/10.1103/Phys Rev Lett.62.403 .
- 8Roos et al. (1999) C. Roos, T. Zeiger, H. Rohde, H. C. Nägerl, J. Eschner, D. Leibfried, F. Schmidt-Kaler, and R. Blatt, Phys. Rev. Lett. 83 , 4713 (1999), URL https://link.aps.org/doi/10.1103/Phys Rev Lett.83.4713 .